
Key takeaways
ICT Mentorship 2023 reviews E-mini S&P 500 ES and Nasdaq NQ futures across daily, hourly, 15-minute and five-minute charts, presenting a bearish framework rather than a demonstrated trading edge.
Read the full summary
ICT Mentorship 2023 reviews E-mini S&P 500 ES and Nasdaq NQ futures across daily, hourly, 15-minute and five-minute charts, presenting a bearish framework rather than a demonstrated trading edge. ES formed an outside day with a down close and traded into a daily inefficiency, while NQ reached the midpoint of a long wick without forming an outside day. ICT expected lower prices unless the session high was breached, with prospective objectives near 4412 on ES and roughly 15,020 on NQ, though neither target was shown as reached. His intraday case combined an hourly inversion fair value gap, NQ making a higher high while ES did not for SMT divergence, a break below a down-close candle, an order block, a proprietary bearish Reaper pattern, lunchtime fair value gaps and purged sell-side liquidity. His bearish-breaker rule selects the biggest down-close candle with the lowest close in the swing, prioritizing candle bodies while allowing wicks outside the range. He identified a five-minute lunchtime short setup and a 2 p.m. to 3 p.m. Silver Bullet sequence but said he did not trade the afternoon session. ICT reported taking $2,200 from a real account, although fills, risk, costs and repeatability were not verified, and disclosed that material discussed after about 19 minutes 41 seconds had been identified retrospectively after roughly 11 a.m. His main recommendation was to study live price formation without demo, funded-account or real-money pressure, compare correlated markets, define invalidation before entries, distinguish contemporaneous observations from hindsight and preserve financial and mental capital during difficult August conditions.
How we researched this article
BestProps used document-based research from primary firm sources, checked September 24, 2026. The complete source list, scope, limitations, and commercial-state record appear near the end of this article.
In ICT Mentorship 2023 – August 15, 2023 ES & NQ Futures Review, ICT reviews the E-mini S&P 500 (ES) and Nasdaq futures (NQ) on daily, hourly, 15-minute and five-minute charts, and closes with an argument for studying rather than trading.
This article is grounded in the recording’s timestamped English captions and summarises his interpretations. His terminology and conclusions are his own market framework; they are not a demonstrated trading edge, and nothing shown establishes what price did afterwards or what any trade actually returned.
ICT 2023 Futures ES Down Close and Outside Day
From 0:24, ICT compares the ES daily chart on the left with the NQ daily chart on the right and describes a down-close day trading to the low of an imbalance, what the captions render as “buy side of balance outside and efficiency.” From 1:29 he names the formation: an outside day with a down close, meaning the session’s high was above the prior day’s high and its low below the prior day’s low, so the range sat outside both the previous day and the day before that. He adds that price came down into the low of an inefficiency (2:03).
Two reading cautions belong here. First, the captions render several terms imperfectly (the “consequent encroachment” concept appears as “consequent encouragement” throughout, and “buy side of balance outside and efficiency” is almost certainly “buy-side imbalance / inefficient price”). Second, ICT's characterisation of August as a fickle, traditionally unfavourable month (0:57–1:10) is his discretionary impression, not a seasonality study conducted in the recording.
ICT 2023 Futures London Session Expectations
At 2:10 ICT sets out his conditions rather than a prediction. He wanted to see whether price traded outside the daily inefficiency in the London session, then returned to work inside the wick, or alternatively treated the low end of the imbalance as resistance and displaced downward. Only after that would he look for an opportunity toward the midpoint of that wick.
He notes that the sell-side reference sits below two relatively equal lows, with the midpoint of the wick also in view (2:45). He then states the expectation of lower prices on ES and NQ, and immediately gives its invalidation: a trade above that day’s high. The captions render that level as “trading 245 20” (3:13), which is not a usable number as written and cannot be resolved from the audio-visual record here; the chart itself would have to be checked.
ICT 2023 Futures Differences Between ES and NQ
At 4:10 ICT turns to the NQ daily chart and contrasts the two. NQ traded up into the midpoint of a long wick (his “consequent encroachment,” on the principle that wicks are treated like gaps and their midpoint is the reference) but it did not create an outside day. ES did. He also points out that ES had formed a swing low where NQ had not, and that NQ showed relative equal lows plus a mean threshold just below the prior day’s low (4:52).
This asymmetry matters methodologically: he explicitly compares the two instead of assuming correlated index futures must produce identical highs and lows. On these daily charts he treats the mismatch as a descriptive difference; the SMT divergence label appears later, on the intraday comparison. One detail resists the captions: the same passage that reads “relatively equal lows” also contains the phrase “the order block Bitcoin,” a recognition error of unknown form that does not identify which reference level he meant or on which of the two charts (4:52). That level has to be read off the chart rather than reconstructed from text.
ICT 2023 Futures Hourly Imbalances and Objectives
On the hourly charts at 5:36, ICT describes price running up into a sell-side imbalance, failing, then breaking down overnight so that the area acted as an inversion fair value gap. His warning is interpretive: a viewer might read that zone as support, but in his bearish reading it should act as resistance and deliver away from it. He describes price returning to the top of the inefficiency and selling off as “perfect delivery” (6:14) before consolidating inside it.
He then states two levels as prospective objectives rather than outcomes. On ES he names sell-side liquidity around 4412, the midpoint of that wick area, as a draw if the bearish premise held (6:57). On NQ he describes a rundown toward roughly 15,020 after a short-term premium retracement on a one- or five-minute chart (9:44). Both are levels he said he liked the idea of drawing toward; the recording does not show those targets being reached, and the NQ figure comes from captions spoken as “15 0 20” so it should be confirmed against the chart.
He also qualifies the ES idea as probably needing longer than NQ because ES sat in a wider range (9:51), and says he wanted the London session to support the idea before a New York move, rather than a quiet consolidation followed by a late-day run.
ICT 2023 Futures SMT Divergence on 15-Minute Charts
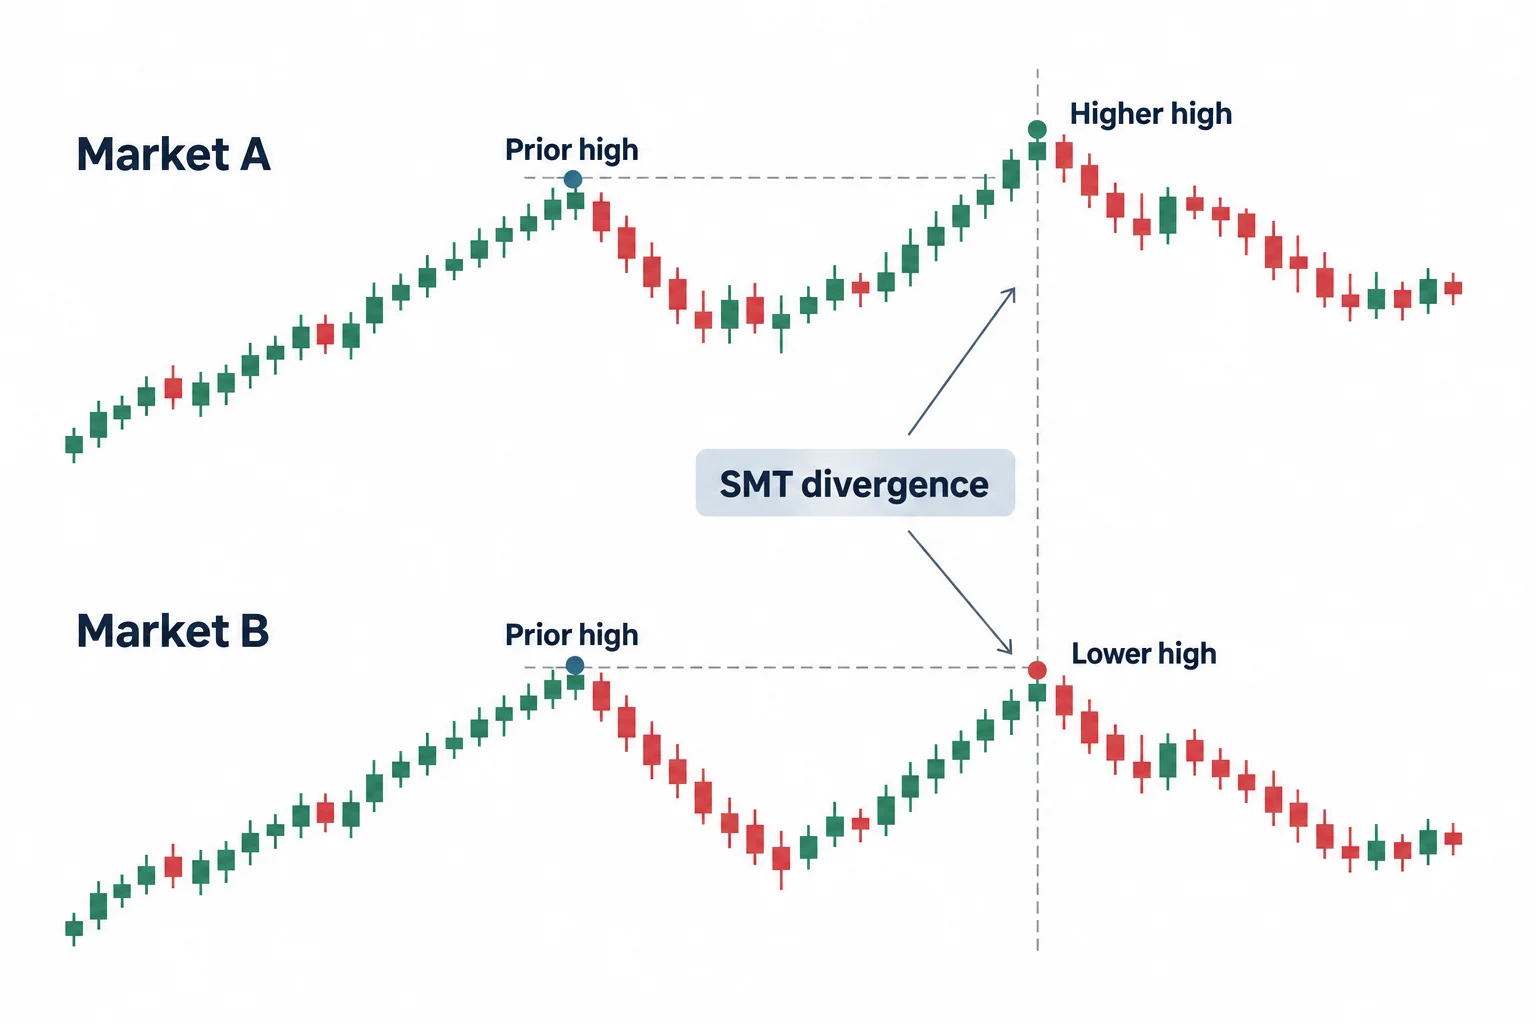
At 10:10 ICT drops to the 15-minute charts. He aligns a high on NQ with a corresponding high on ES and notes that NQ made the higher high while ES was unwilling to (his SMT divergence and, in his reading, a supporting argument for the bearish case). He emphasises that although the inefficiency was drawn from a higher time frame, its midpoint remains relevant on the lower one and, in his words, was “qualified and confirmed” by that divergence (11:21).
He then lists the elements he layers into the short-term reading: the break below a down-close candle, the immediate trade back up into the order block, a bearish “Reaper” pattern, a lunchtime fair value gap, and the sell-side pool that was purged before price traded into the hourly inefficiency and its midpoint (11:48–12:31). “Reaper” is a proprietary construct that the captions cannot be used to verify geometrically; treat that label as ICT’s own description of the pattern rather than as a confirmed formation.
ICT 2023 Futures Bearish Breaker Selection
From 12:44 ICT explains why he annotated one particular candle as the bearish breaker instead of the candle that actually printed the lowest low. His rule: use the biggest down-closed candle with the lowest close in the swing, because the bodies carry the narrative while the wicks are where price does its damage. Applied to a later candle at 13:16, he notes that the bodies respected the breaker’s range while the wicks were permitted to trade outside it.
His practical recommendation is process, not signal. At 13:33 he draws an explicit line between back-testing on static charts and what he calls “tape reading”: not demo trading, not passing a funded-account challenge, and not live trading, just watching price form with no risk and no concern about being right. He points out that a candle which closes bullish may still be read as a failure when it is measured against an intact bearish breaker.
ICT 2023 Futures Silver Bullet and Lunchtime Review
On the five-minute charts from 15:07, ICT revisits the ES inefficiency and bearish order block, the displacement lower, and the sell-side imbalance he associates with the lunchtime macro. He acknowledges he did not annotate everything, because a fully marked-up chart would be unreadable, and calls the setup at 15:28 one he would have wanted to short into the lunchtime macro if he were participating.
Later, at 20:16, he reviews the NQ move into a bearish order block inside the “Reaper” and a small gap, then the displacement below the prior lows that creates a fair value gap. He identifies this sequence as the 2:00–3:00 p.m. Silver Bullet window (captions render it “PM session”; 20:51) and states plainly that he did not trade the afternoon session.
ICT 2023 Futures Results and Evidence Limits
Around 18:58 ICT says he felt out of sync with the market while watching the dollar index, euro-dollar, ES, NQ and the Dow. He reports having taken $2,200 out of a real account and refers viewers to his Twitter feed for the record (19:17). That figure is his own account of his own result; the transcript, the video and this article cannot verify the fill, the account, the risk taken, the costs or whether it was repeatable, and it should not be read as an expected outcome or a recommendation to copy.
The more consequential disclosure follows immediately: everything he shows from about 19:41 onward was identified after roughly 11:00 a.m., as retrospective observation for journaling and back-testing practice. He says he mentioned two or three NASDAQ observations in live commentary on Twitter that were helpful that day, which is a report about his own posts and is likewise unverified here.
ICT 2023 Futures Observation Over Trading
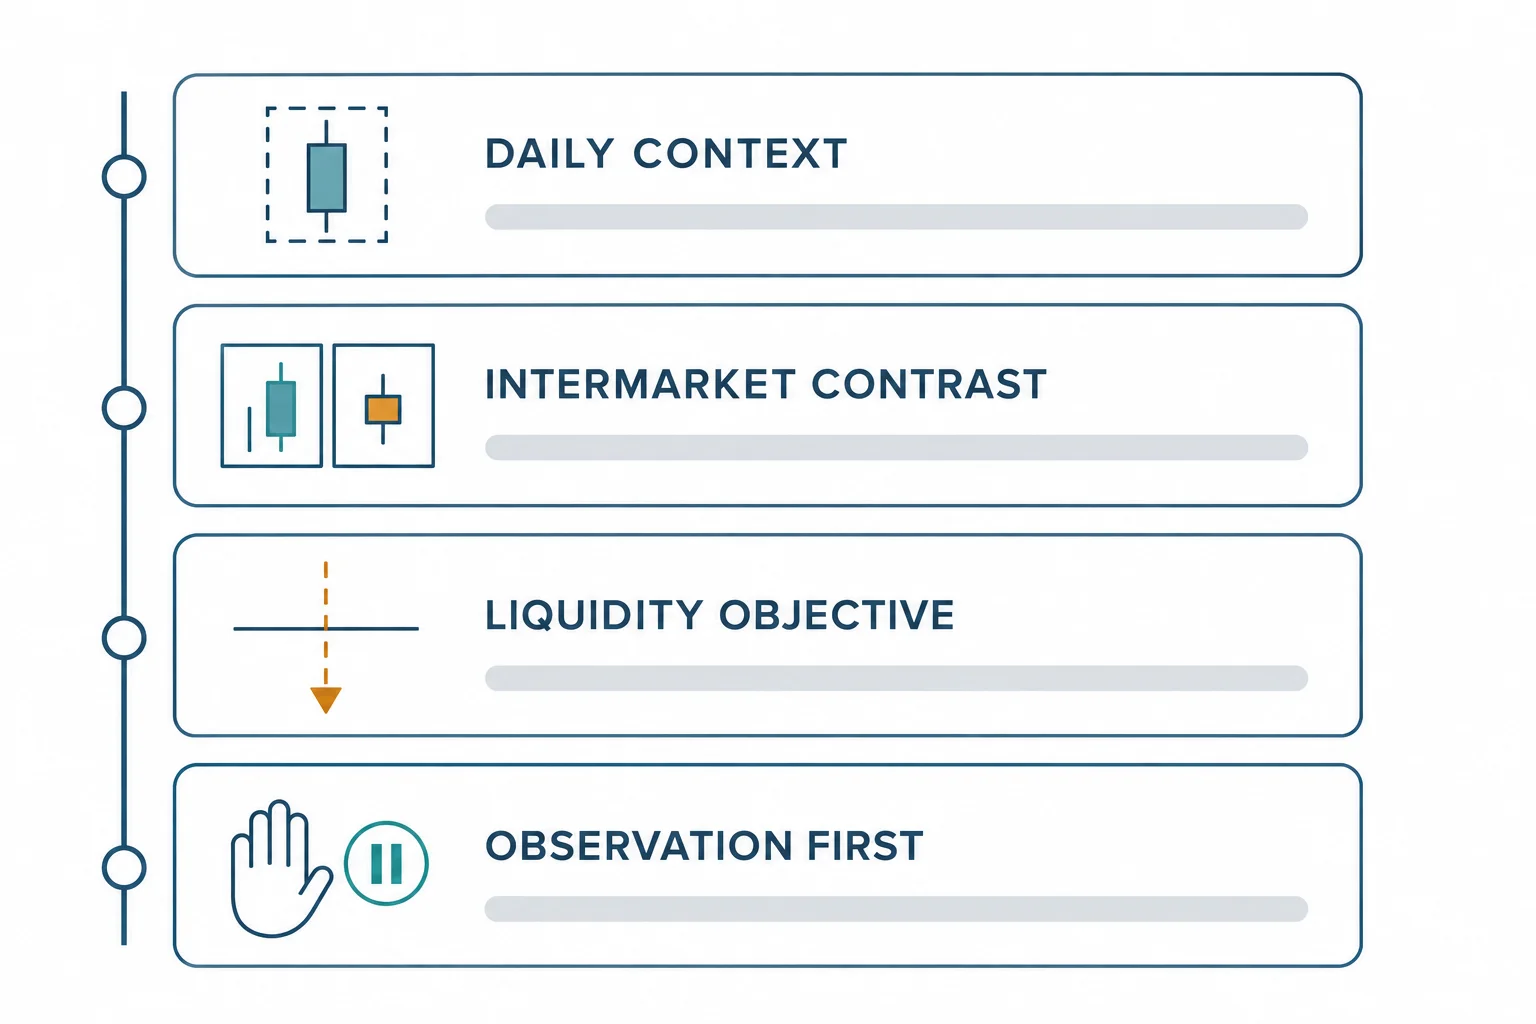
At 21:45 ICT closes from the other direction. He says he is not trying to inspire trades, and that this is a month to study, abstain from participating, and keep both funds and mental capital intact. His stated reason is practical rather than mystical: price action that wears a trader down in August can leave them unable or unwilling to participate when conditions improve, or leave them with no account at all.
Set aside the proprietary vocabulary and several general review practices remain, and they are the parts of the recording that do not depend on trusting his read of the chart:
- Establish the higher-time-frame context and any bias invalidation level before looking at an entry.
- Compare correlated markets instead of assuming they will agree.
- Prefer candle bodies over wicks when a rule needs a defined level, and state that rule in advance.
- Distinguish what the speaker says, what the chart actually shows and what you inferred, especially when the chart was annotated after the fact.
- Treat a reported personal result as a claim about one account and one day, not as a tested system.
This is independent educational commentary, not investment advice. Futures involve substantial risk, and no analytical framework guarantees a result.
Watch the ICT 2023 Futures Recording
This article draws on the timestamped English captions of ICT Mentorship 2023 – August 15, 2023 ES & NQ Futures Review. Captions support the speaker’s words; they cannot independently establish chart prices, fills or results. The chart markup is the substance of the lesson, so the recording is worth watching directly.
Watch the original lesson on YouTube
The video cannot be played inside another website: when its embedded player was opened and clicked on 15 September 2026, the player itself reported “Video unavailable” and “Playback on other websites has been disabled by the video owner.”, with no duration and no playback progress reported. That message is the reason no embed is reserved or left blank here; the recording itself is available directly on YouTube.
Watch ICT Mentorship 2023 – August 15, 2023 ES & NQ Futures Review on YouTube ↗
ICT 2023 Futures Sources and Further Reading
- The primary source: the original August 15, 2023 ES & NQ review: use the timestamp links above to compare each explanation with what he actually said.
- The Inner Circle Trader YouTube channel: the publisher’s own channel, where the original recording and adjacent sessions are posted. Unofficial third-party reuploads and summaries are not the source used here.
- YouTube’s “Embed videos & playlists” help page: platform documentation relevant to the disabled-embedding notice above.
- CFTC Learn & Protect: the US regulator’s investor-education and fraud-warning material. A general reference, not a statement that this recording or this article violates or complies with any particular rule.
This is independent educational commentary. It is not official ICT material, a tested trading system, or a claim that the reported results can be reproduced.
