
Key takeaways
ICT’s June 2022 topical study defines a dealing range as a range in which price has taken out the buy side, reversed and then taken out the sell side, and he uses the high and low those events leave behind as the boundaries he then analyses inside of.
Read the full summary
ICT’s June 2022 topical study defines a dealing range as a range in which price has taken out the buy side, reversed and then taken out the sell side, and he uses the high and low those events leave behind as the boundaries he then analyses inside of. The range is an analytical container, not a standalone signal: he first establishes higher-time-frame bias, identifies the proposed liquidity draw and waits when competing scenarios remain persuasive. He says there is no high-probability setup in EUR/USD because it can run for either side, has no strong feeling about the Aussie dollar, cannot frame USD/CAD either way, describes gold as consolidated and would not trade it. He then walks a daily S&P chart: an old low and relative equal highs, a cross above the highs and then below the low, a refinement to the most energetic swing inside the range, equilibrium and premium marked for bearish study, a fair value gap he renames a breakaway gap, a daily swing low he calls a discount inside a discount, and an overhead daily gap with a round ten level at its lower end that he says he published before the session. He later reports a Thursday trade that was stopped out for plus two points and says he was incorrect about the run he expected while right about the second part of the day. These are his interpretations and his own reported outcomes, not verified fills, participant intent, profitability or a repeatable trading advantage.
How we researched this article
BestProps used document-based research from primary firm sources, checked September 25, 2026. The complete source list, scope, limitations, and commercial-state record appear near the end of this article.
In the June 2022 lecture 2022 ICT Mentorship Topical Study – Dealing Ranges, ICT explains how he defines a dealing range and uses it to organise his interpretation of liquidity, directional bias, premium and discount. The lesson moves from uncertain currency and commodity conditions to a daily S&P chart that he says is clearer to work with.
The central message is not that every completed range creates a trade. He repeatedly says he first wants a directional context and a market that presents something so one-sided that it is very difficult to make a justification for the opposing side. When that clarity is missing, his stated preference is to sit on his hands and wait rather than force a forecast.
2022 ICT Mentorship Topical Study – Dealing Ranges
The Inner Circle Trader · watch page lists upload 26 June 2022 (14:18 US Pacific) · 3859 seconds, about 64 minutes 19 seconds. This is the recording every timestamp link on this page points at.
The recording is not embedded here. An embedded player was tested directly on 15 September 2026 from a BestProps page origin at desktop and mobile widths: the frame loads but then reports “Playback on other websites has been disabled by the video owner,” with no duration and no playback progress, while the video itself is publicly playable on YouTube. No half-working player is left on this page.
What ICT Means by Dealing Ranges
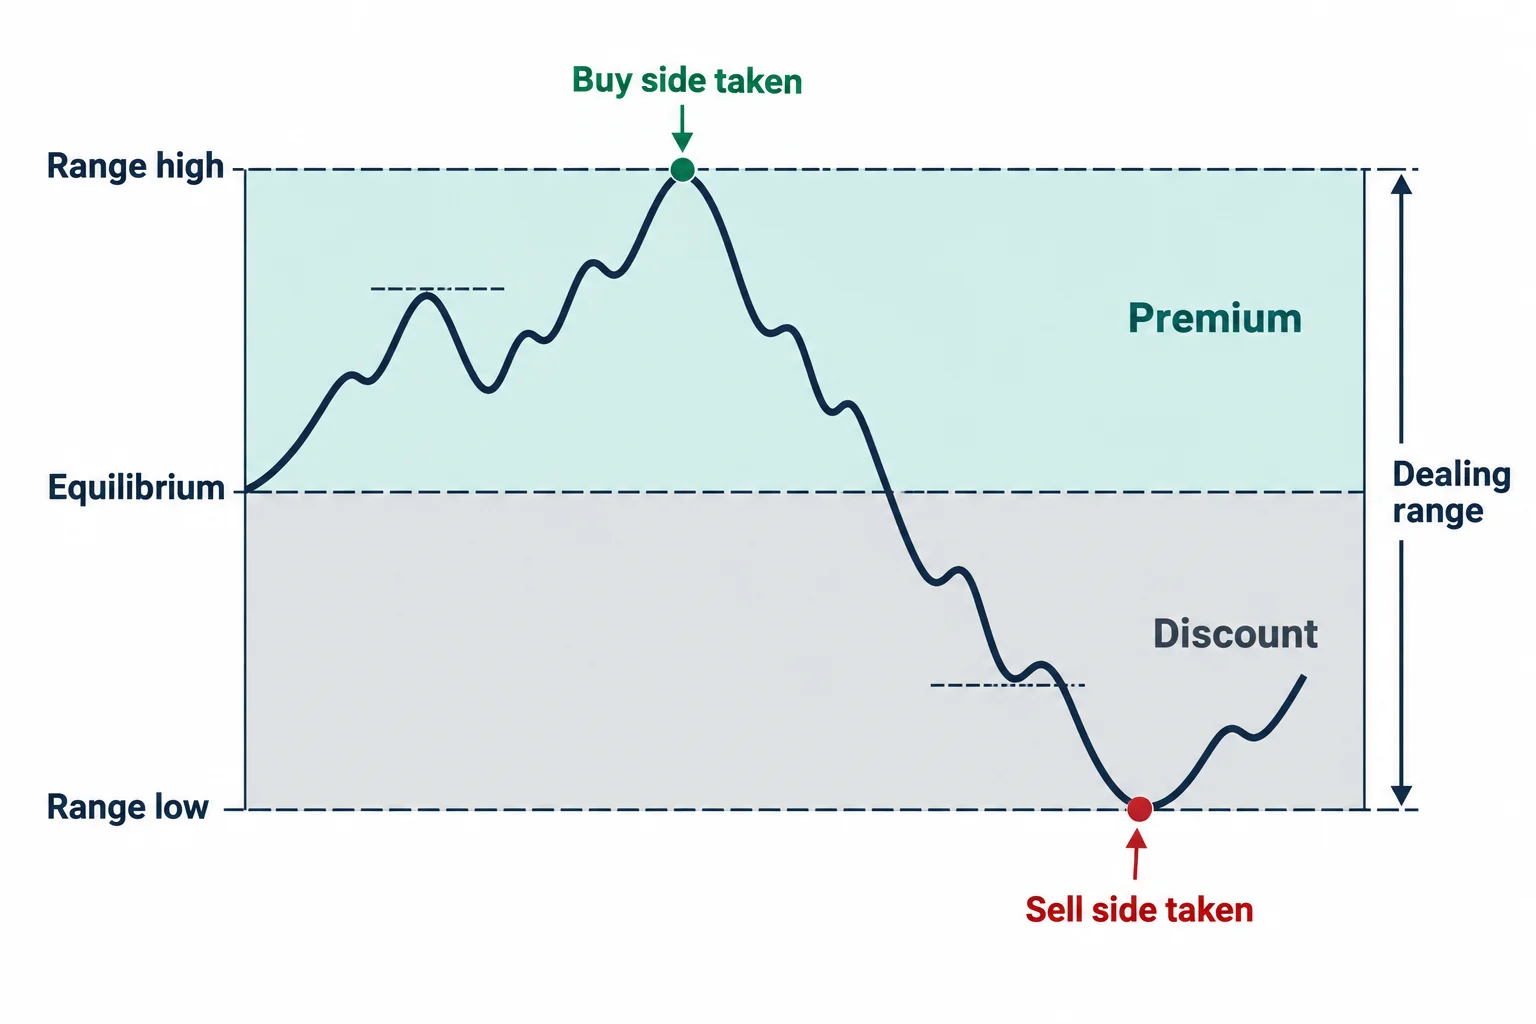
He introduces the definition at 1:31, asking students to make a note section for dealing ranges. In his terminology, a dealing range is a range where price has taken out the buy side, then reversed, and then taken out the sell side 1:40. The high and the low those events leave behind are the boundaries he then analyses inside of.
Within his framework:
- Buy-side liquidity refers to the orders he expects to rest above prior highs, including protective stops from short positions.
- Sell-side liquidity refers to the orders he expects below prior lows, including protective stops from long positions.
- Equilibrium is the midpoint of the selected range.
- Premium is the portion above equilibrium, while discount is the portion below it.
These are his market interpretations, not independently established facts about who placed particular orders. A chart can show that a high or low was crossed, but it cannot by itself identify every participant or prove the intent behind the move.
How ICT Sets Bias Before Dealing Ranges
Using the Dollar Index, he says he was working with a higher-time-frame bullish bias. At 2:43, he explains that he did not interpret a move below a short-term low as sufficient reason to call a bearish market-structure shift. Instead, he read it as sell-side liquidity being accumulated inside the prevailing bullish context, and he looked toward an earlier high as the likely draw.
He is explicit that he uses the dollar as a barometer rather than a market he trades 3:46: he says he never trades the dollar, and uses it to reason about whether foreign currency should go lower or higher. This illustrates an important qualification — a dealing range is an analytical container, not a standalone direction signal. He filters it through his higher-time-frame bias. In a bearish context he discusses equilibrium or preferably premium as the area to study a short; in a bullish context the logic reverses.
Why ICT Avoids Unclear Dealing Ranges
A substantial part of the lecture examines markets he did not regard as sufficiently clear. At 6:52 he defines his version of a high-probability condition: something in price so one-sided and so obvious that it is very difficult for the analyst to make a justification for the opposing side. If a likelihood of an opposing setup can be determined, he says that is not his definition of high probability, and his stated instruction is to be patient and wait for the setup to present itself.
He then applies that filter to several markets:
- He says there is no high-probability setup in EUR/USD because it can run for the buy side or the sell side, and concludes he is not in forex at all.
- He raises a possible correlated divergence between cable and EUR/USD and explicitly frames it conditionally, saying what he would do if he were bearish the dollar 9:54.
- He says he does not have a strong feeling about trading the Aussie dollar right now and is not touching it.
- He shows dollar versus Canadian dollar and says he cannot frame it with high probability on one side or the other, so he will not trade it personally.
- He describes gold futures as going from here to here and consolidating, says your guess is as good as his, and that this is why he is not talking about gold.
The practical educational takeaway is that uncertainty can be recorded without being converted into a position. At 15:53 he uses the gold chart to make the distinction between holding an expectation and risking money on it, and he calls the energy market full of knee-jerk reactions rather than a high-probability condition.
ICT S&P Dealing Range Walkthrough
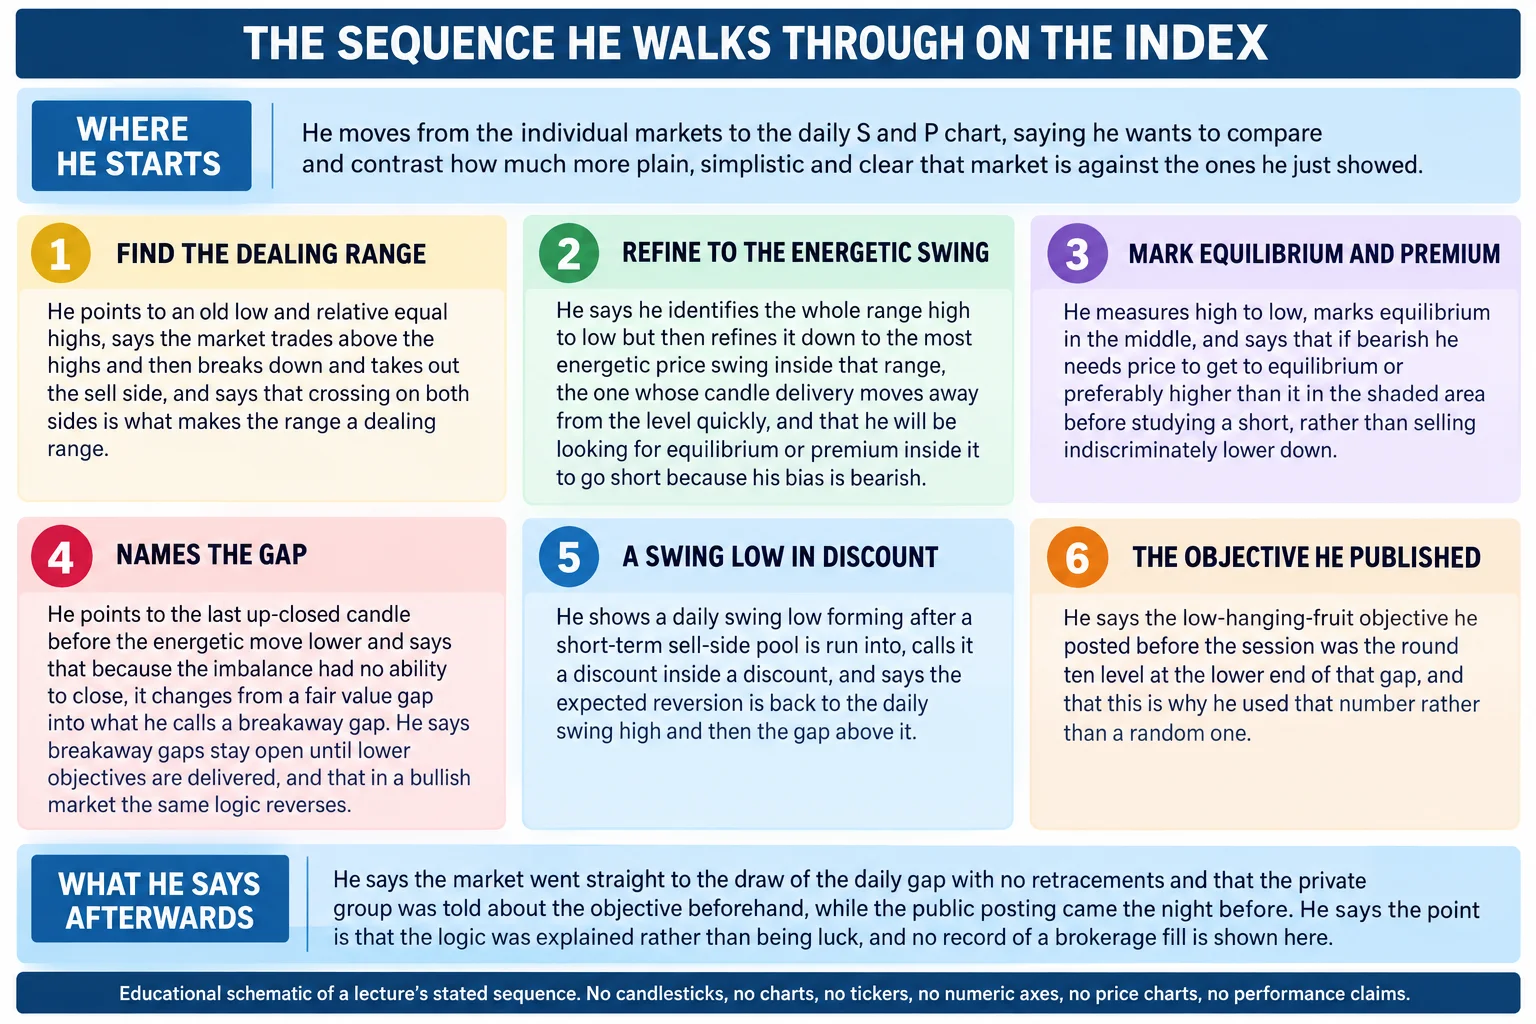
The detailed case study begins at 30:06 on a daily S&P chart. He points to an old low and relative equal highs, says the market trades above the highs and then breaks down and takes out the sell side, and says that crossing on both sides is what makes the range a dealing range. He notes the range is a long protracted consolidation rather than a short little run, and that it is a daily chart.
At 32:44 he refines the full range down to what he calls the most energetic price swing inside it — the level where the delivery of the candle moves away quickly — and says that from that refined range he will be looking for equilibrium or premium to go short because his bias is bearish.
Later he combines the range with concepts he calls a fair value gap, a breakaway gap and a bearish order block. At 41:54 he measures high to low, marks equilibrium in the middle, and says that with a bearish bias he needs price to get to equilibrium or preferably higher than it before studying a short, rather than selling indiscriminately in discount. He explains that the last up-closed candle before the energetic move lower becomes his bearish order block 44:12, and that an imbalance with no ability to close stays open as a breakaway gap until lower objectives are delivered.
He then examines a shorter-term reversal from sell-side toward buy-side liquidity. At 47:47 he describes a daily swing low forming after sell-side levels were crossed and a short-term sell-side pool was run into. Under his interpretation that put price in what he calls a discount inside a discount, and the expected reversion was toward the daily swing high and then the gap above it.
How ICT Builds Weekly Dealing Range Context
At 49:17 he moves to an hourly S&P chart and evaluates the week’s progression, adding day dividers so the profile of the week can be read. He says earlier sell-side activity, a developing swing low and the overhead daily gap supported the objective he had stated, and he explains he is referring to the shape of the week rather than volume profile, footprint or depth of market.
He then drops to a 15-minute chart, where he says the gap was traded into during London 55:38 and then ran aggressively right at the nine o’clock hour 55:50, and then to the one-minute chart into the New York 9:30 equity open 56:46. He says the objective he posted the day before was the round ten level at the lower end of the daily gap 56:03, and that this is why he used that number rather than a random one.
He also reports his own errors. At 52:57 he says that on Thursday he was initially wrong, took a trade and was stopped out for plus two points, and that while it was not a loss he was incorrect about the run he expected while right about the second part of the day. The transcript contains his retrospective account and mentions a prior public objective, but it does not independently verify unseen posts, orders, fills or profitability. The educational value lies in the top-down sequence he presents: define the higher-time-frame range, establish bias, identify the proposed liquidity draw and only then inspect lower-time-frame behaviour.
ICT Dealing Range Study Checklist
- Mark the high and the low left behind after liquidity is taken on both sides.
- State the higher-time-frame bias separately from the range itself.
- Refine the working range to the most energetic swing inside it and divide that at its midpoint into premium and discount.
- Identify the next proposed liquidity objective under the chosen bias.
- Note competing scenarios; if both remain persuasive, treat the condition as unclear and wait.
- Journal what would invalidate the interpretation rather than assuming the model must be correct.
This video presents his own analytical framework and retrospective chart commentary. It does not demonstrate that the concepts provide a repeatable trading advantage, and nothing here is investment advice or a performance promise.
Further reading
- [1] ICT, 2022 ICT Mentorship Topical Study – Dealing Ranges — The Inner Circle Trader (watch page read 15 September 2026; upload listed 26 June 2022 at 14:18 US Pacific; publicly playable). The primary source for every claim on this page.
- [2] U.S. Commodity Futures Trading Commission, Fraud Advisory: Commodity Trading Systems Sold on the Internet (read 15 September 2026) — explains that advertised system signals are typically technical analyses of price and volume data, that hypothetical or demonstrated results are simulations over historical prices rather than real fills, and lists market circumstances and execution realities such systems often fail to account for. Relevant to reading a lecture whose reported results cannot be checked.
- [3] U.S. Commodity Futures Trading Commission, Fraud Advisory: Foreign Currency (Forex) Fraud (read 15 September 2026) — states that the forex market is volatile and carries substantial risk and is not a place for money you cannot afford to lose, because you can lose most or all of it quickly. Relevant to the EUR/USD, cable and dollar sections above.
- [4] U.S. Securities and Exchange Commission, Investor.gov, Day Trading (read 15 September 2026) — describes day traders as buying and selling over very short holding periods and states that day trading is extremely risky and can result in substantial losses in a very short period of time. Relevant to the intraday, one-minute and 15-minute framing of the walkthrough.
- [5] CME Group, E-mini S&P 500 Futures Contract Specs (read 15 September 2026) — the exchange contract reference for the S&P futures market discussed in the walkthrough, including tick size and contract size. Official exchange documentation; the recording is not an official CME publication.
A note on the source
The article above was written from the timestamped caption track of the full original recording (about 64 minutes 19 seconds long), fetched on 15 September 2026, and cross-checked against the video’s public watch page metadata. The reviewer worked from the transcript and its timestamps and did not independently inspect the charts shown on screen, so nothing here claims first-hand observation of candles, fills or account results. Where the captions are ambiguous about a term or figure, the wording above follows the spoken context; reported trades and stated objectives are attributed to ICT as his own account rather than presented as verified outcomes.
