
Key takeaways
ICT’s Bridge Builder lecture uses a bridge as an analogy for a trade idea: one side is where price is now, which he calls the inception, and the other is a projected destination he calls the terminus (5:17).
Read the full summary
ICT’s Bridge Builder lecture uses a bridge as an analogy for a trade idea: one side is where price is now, which he calls the inception, and the other is a projected destination he calls the terminus (5:17). The lecture is divided into three stages — design, framework and building (2:39) — and its central instruction is to identify the draw on liquidity first, because that gives the framework for the idea and only then does the entry pattern matter (16:56). He stresses that the draw does not have to be reached for the idea to be useful, warns against the all-or-nothing reading in which a missed target counts as failure, and describes taking partials and reducing open risk as the trade progresses (17:56). Around the December 2022 S&P contract he marks a dealing range on the daily chart, calls the range midpoint equilibrium with premium above and discount below, and works down to hourly and five-minute charts around a non-farm-payroll session (25:34). He distinguishes a genuine gap where no trading took place from a fair value gap or volume imbalance where trading did occur but delivery was one-sided, and separates redelivery or repricing from what he calls a balanced price range (1:29:29). The lecture runs about 98 minutes, contains no tested rule set, no fills, no risk parameters and no verified results, and the charts being annotated are not visible in the captions.
How we researched this article
BestProps used document-based research from primary firm sources, checked September 24, 2026. The complete source list, scope, limitations, and commercial-state record appear near the end of this article.
In Bridge Builder – ICT Concepts Overview, ICT builds a single extended analogy around the engineering of a bridge. The lecture is the one published on the Inner Circle Trader channel on 9 October 2022, with a running time of about 98 minutes, and it opens by saying the idea is what bridges the gap for newer students who arrive with ordinary retail analysis (0:10).
He is explicit at the start about how the analogy should be read, and it is worth keeping in view: a bridge carries traffic from one side to the other, but traffic on a bridge can slow, divert or be reduced to a single lane, and those detours and delays are what he compares to market volatility and deviations from a smooth transition (7:56). The lecture also says plainly that it is looking for a snapshot of price action rather than a permanent forecast (6:21). What follows is his framework as he describes it, not a tested method; the captions record his words and cannot confirm the chart annotations, quoted fills or outcomes he refers to.
The bridge analogy: inception, terminus and three stages
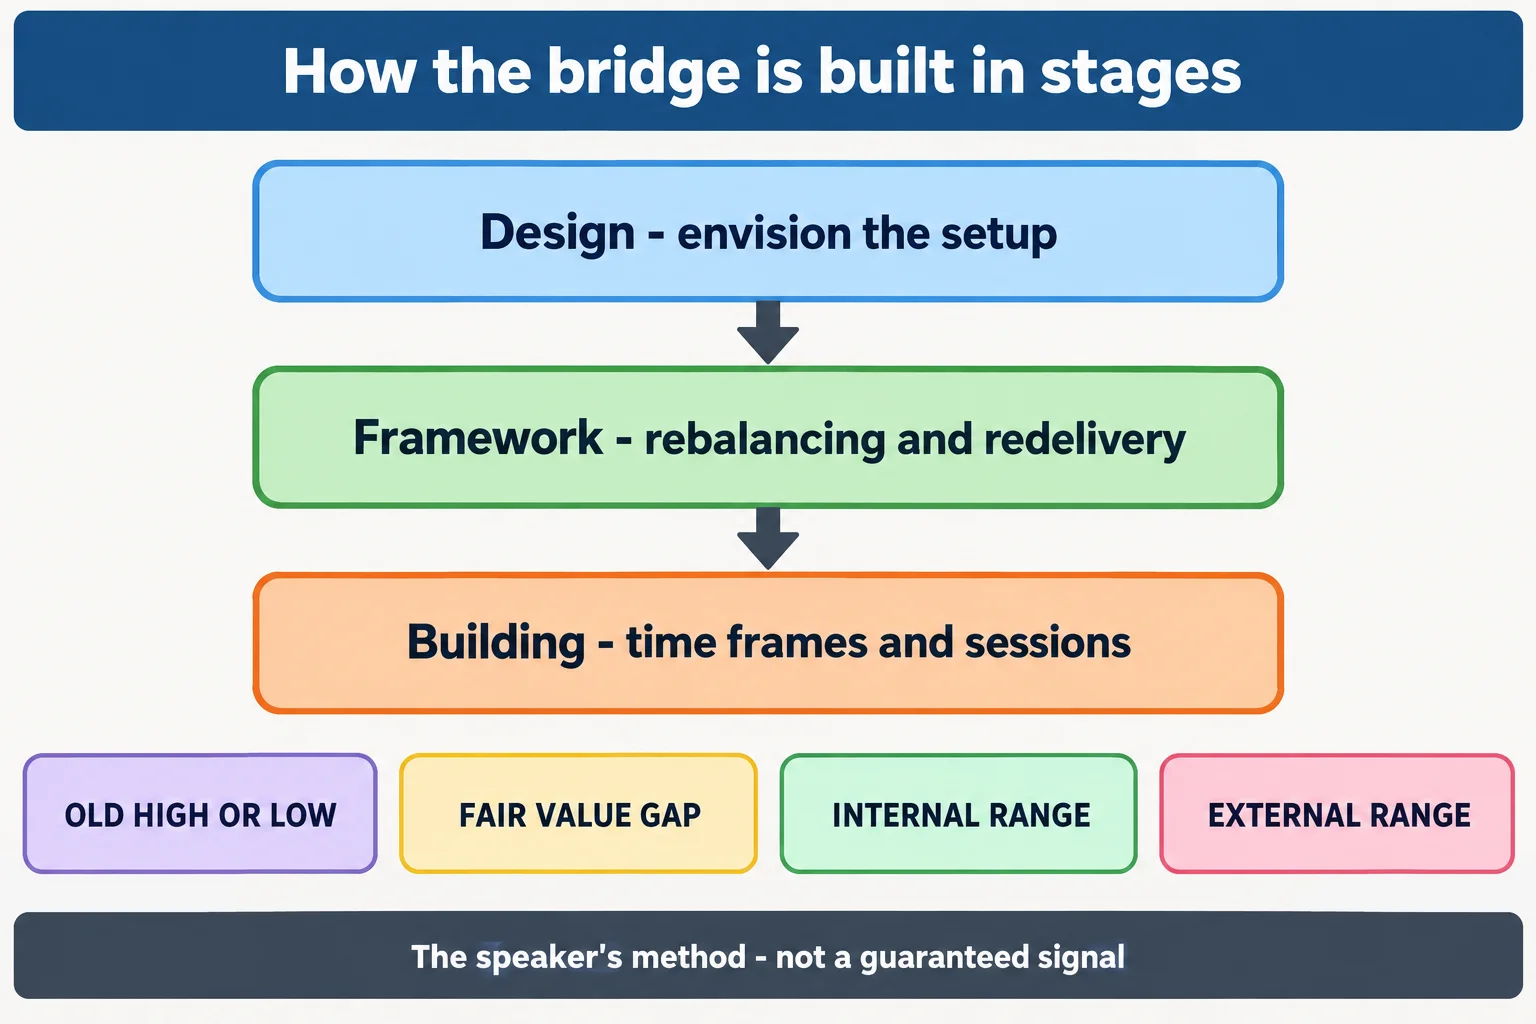
He divides the presentation into three stages (3:22). Design is envisioning what a setup looks like — the question of what the inception is and where the terminus sits, which he calls loosely the trade idea (2:58). Framework is how a trade setup is framed, and he ties it to his understanding of re-delivery and rebalance of price (3:33). Building brings in the setups themselves along with time frames, sessions and the locations where trades form (3:47).
The two endpoints are then defined against a picture of an actual bridge, which he notes he simply took off the internet for illustration (4:01). If you are on one side and want to reach the other, the beginning of the move — wherever market price is right now — is the inception, and the point you are trying to reach, based on your own assumptions and analysis, is the terminus (5:12). He adds that reaching the far side does not mean the road ends, because it continues and can branch in other directions, which is why he treats the exercise as a limited snapshot rather than a complete map (6:07).
The draw on liquidity comes before the entry
This is the load-bearing claim of the lecture. When he looks at price, the first thing he asks is where price is likely to go — what the draw on liquidity is — because understanding that gives him the framework for a trade idea and lets him build the bridge from where market price is now to that draw (16:56).
He then names the mistake he says newer students make. They believe the draw on liquidity must be traded to, and that anything less is a failure to be treated as an all-in decision where everything is collected at the target or the idea failed (17:20). He rejects that framing and attributes it to advice he has heard elsewhere, arguing instead for opening a measured amount of risk and taking partials as the trade moves in your favour (17:49).
His own practice is described in the same passage. A maximum stop loss is set at entry, but he says it is not kept there and the measure of risk does not stay constant through the life of the trade, especially once partials become possible, because each partial builds the bottom line and reduces the open risk in that specific trade (18:37). He concedes that full stop-outs happen to him and will happen to the viewer, and claims that the price action characteristics he teaches often tip him off before most of the damage that a stop loss would absorb (18:13).
He closes the same section with the priority he wants students to take: new traders fixate on how much they can make, whereas he wants attention on how much risk exists and how to control it (18:57).
What counts as a destination
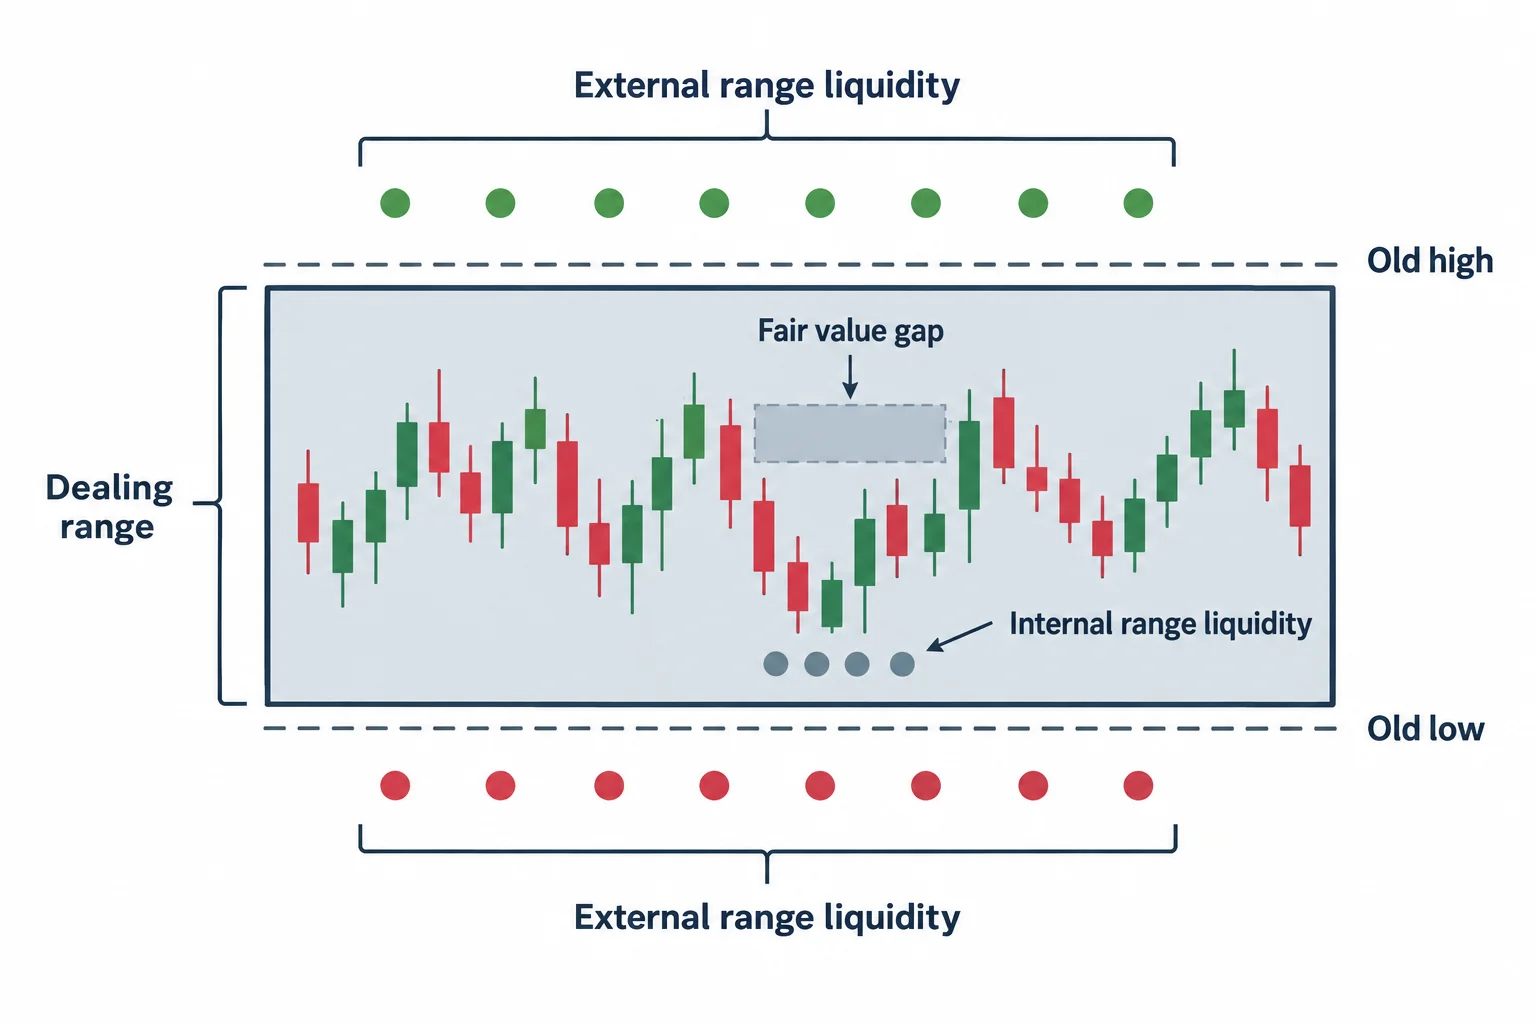
The lecture lists the kinds of place that can sit at the far end of the bridge, and it later demonstrates them on a live market example rather than defining them exhaustively. The candidate destinations discussed are:
- Liquidity resting above an old high or below an old low, which he describes as the pool price is likely to reach for (10:35).
- An inefficient area of delivery, in the form of a fair value gap or a volume imbalance (15:32).
- Liquidity internal to the dealing range — he uses the term internal range liquidity for a level inside an existing range, and is explicit that this does not require price to trade above the range high to offer a trade (28:58).
- Liquidity external to the range, which he calls external range liquidity and places outside the scope of the lesson (32:57).
The internal-versus-external distinction comes with a qualification worth recording, because it is the part of the lecture that is easiest to lose. He says he wants students to understand they can work inside dealing ranges, never see those ranges broken, and still find profitability — and that once price reaches the area being discussed he can build another bridge from there in his own mind (33:00).
Gaps, imbalances, repricing and rebalancing
He uses a badly joined bridge as the picture for several different flaws in price delivery, saying the image very closely represents a gap, a volume imbalance or a fair value gap (13:20). He then separates them. A genuine gap is where no trading took place at all, which he says is usually seen around session and weekly opens — the space between Friday’s close and Sunday’s open is his example — and there the absence of trading covers both buy side and sell side (15:44). A fair value gap or volume imbalance is different: there is a specific void of a specific type of liquidity because trading did occur, which he illustrates with a wick that bridges what would otherwise have been a gap between two candle bodies (15:32).
His account of what happens next is that the market draws back into those areas to recapitalise and find fair value, after which it can either continue in the direction it gapped or trade beyond the gap and later treat it as support or resistance (16:20).
The terminology distinction he draws is between repricing and rebalancing:
- Redelivery, repricing: the market returns to an area of inefficiency. He is emphatic that this is redelivery and explicitly not price being rebalanced (21:13).
- Rebalancing, balanced price range: he demonstrates this as a range that has been delivered through in both directions, and re-asserts later in the lecture, looking at a specific move, that the return to the old area is repricing rather than a rebalance (1:29:29).
These are his definitions inside his own model. They should not be read as standard industry terminology for gaps or imbalances.
The worked example: December 2022 S&P
The second half of the lecture applies the framework to the December 2022 S&P futures contract (25:34). He asks the viewer to find the dealing range for that time frame, picks a swing high defined by just three candles, and states explicitly that he does not use Williams fractals for this — a candle in the middle with a lower high either side is his swing high, and the mirror is his swing low (26:28).
From there he marks the equilibrium of the range by putting a Fibonacci retracement across it and posting the 50 percent level, saying he wants price to gravitate back to 50 percent — equilibrium — or preferably higher (27:38). Anything above that midpoint he calls premium, and he identifies a volume imbalance sitting above the 50 percent level as a premium array and therefore a draw on liquidity (28:23).
The sequence of charts descends from there: a daily range, then internal range liquidity as the nearer terminus, then the hourly frame, and finally a five-minute chart on non-farm payroll Friday (1:08:01). He points out that the same structure — relative equal highs, a sweep of the liquidity above them, then a move lower into a series of bearish patterns — is what he would expect on any medium or high impact news day, and tells viewers to take non-farm payroll out of the equation when reading it (56:45).
On entries, his conclusion is that the entry is the easy part and the destination is the hard part. He notes a multitude of approaches he teaches for getting into a trade, and says students wrongly assume that watching a video about daily bias, liquidity pools or PD arrays should be enough to know where price is going (1:09:05).
Immediately around that example he also warns against treating an event trade as a shortcut. He describes the difficulty of getting filled during the release, says he tells students not to try to trade non-farm payroll or FOMC announcements, and argues that if someone with his experience cannot get a favourable fill there, a newer trader should not expect to (1:27:58). He compares trying it with very little experience to playing Russian roulette, and states that losses larger than the account are possible (1:32:34).
Study, backtesting and the closing argument
He spends a stretch of the lecture on how the skill is supposed to be acquired. He tells viewers to study old price moves in detail rather than casually — the day, the time of day, the month, how many points the move covered, how much drawdown it had, and whether a high or medium impact news driver was around it (11:50) — and calls the resulting familiarity a pseudo experience, because you did not take those trades and cannot go back in time, but the material can be digested and then observed forward (12:22).
He is blunt that this takes time. He says anyone learning any method will have to back test it rather than trade a system that simply spits out signals, and calls the idea of trading someone else’s buy and sell instructions blindly ludicrous (57:37). Later he adds tape reading and forward testing done without placing trades, not even on demo, as part of the same progression, and gives a rule of thumb: if you feel you have to rush to a live account, that feeling is itself the signal to wait (1:34:06).
He also includes the psychological side, saying that many of the things that work against a trader are not known until they start trading and journal what they felt — what they were stressing about, what they felt overconfident about on entry, and how they reacted afterwards (24:16).
The closing argument returns to the analogy with a last comparison. He describes bridge engineers working from a survey and a blueprint that connect point A to point B specifically, not point A to point C or D, and says a trader who abandons the idea and builds a different bridge at a different angle when the move does not suit them is not operating the same way. His version is to hold one draw on liquidity with a directional bias and submit to it until proven wrong (1:33:11).
What the lecture does and does not establish
Read as a research programme rather than a signal service, the lecture has a coherent shape: decide where price is being drawn, frame the idea against a range with equilibrium, premium and discount, then work down through time frames to find an entry that fits the idea. What it does not provide is the part that would make it checkable. There is no rule for identifying the draw objectively, no measurement for the open risk he describes reducing with partials, no sample of results, and no evidence that the destination is reached more often than not.
Two of its own claims deserve to be repeated without the gloss. He says outright that the draw on liquidity does not have to be traded to for the idea to be valid, which means a failed target is not disproof of the framework either; and he concedes that full stop-outs happen to him. That combination is what makes the method hard to falsify from the outside, and it is the reason a reader should treat the price levels, annotations and fills referred to in the lecture as unverified. The captions record the speaker’s words, not the charts he was reading or the results he reports. Futures and similar leveraged products can produce losses larger than the amount committed. Nothing here is investment advice.
Watch the original lecture
This article was written from the timestamped English captions of the recording; the timestamp links above point to the passages being described.
Watch the original lecture on YouTube
The recording cannot be played inside another website. When its embedded player was loaded and clicked in a real browser on this article’s behalf on 15 September 2026, the player reported “Playback on other websites has been disabled by the video owner” and offered a “Watch on YouTube” prompt, with no duration loaded and no playback progress. No half-working embed is left here for that reason; the recording plays normally on YouTube itself.
Primary source and further reading
- The original Inner Circle Trader lecture: use the timestamp links in this article to compare each explanation with its source.
- Investopedia — liquidity: a general explanation of what liquidity means in a market, useful for separating the ordinary sense of the word from the specific “draw on liquidity” meaning used in the lecture.
- Investopedia — backtesting: an overview of what backtesting can and cannot show, relevant to how much weight the lecture’s study-and-forward-test advice can carry on its own.
- Investopedia — risk management: general material on position risk and exposure, the area the lecture itself tells students to prioritise over profit expectations.
- U.S. Commodity Futures Trading Commission — learning resources: regulator material on futures markets and on evaluating trading claims, including the leverage and loss risk the lecture touches on.
This is independent educational commentary. It is not official ICT material, not a tested trading system, and not a claim that the framework predicts prices or produces results. References to what banks or institutions are doing are the speaker’s characterisation of the market. The third-party pages linked here were consulted as general reference and were not tested against the lecture’s claims.
