
Key takeaways
In ICT Mentorship Core Content – Month 12 – Intermediate Term Top Down Analysis, a forty-nine-minute lesson published on 28 October 2022, ICT walks through his personal weekly procedure and then works an Australian dollar example.
Read the full summary
In ICT Mentorship Core Content – Month 12 – Intermediate Term Top Down Analysis, a forty-nine-minute lesson published on 28 October 2022, ICT walks through his personal weekly procedure and then works an Australian dollar example. He sets out the week’s work in order: relative strength first, then the Commitment of Traders report, then market sentiment, market profile, intermarket and correlated-pair analysis, market structure, a PD array matrix, and finally a weekly bias carried to the daily chart (2:23 and 2:43). He says he looks for commercial hedgers to be at a twelve-month or six-month extreme in net holdings and also sorts markets sitting at two-year and four-year extremes (10:54 and 10:59), that he fades a big consensus story in the headlines (12:17), and that he reads Williams percent R on the weekly chart (13:39). His own convention for the positioning data is to take the highest and lowest commercial reading over twelve months, split that range in half, and treat the midpoint as the dividing line instead of the net-position zero line (19:22). The lesson is a description of a framework, not a test of it: the Australian dollar walkthrough is retrospective, and no entries, fills, risk, position size or results are given.
How we researched this article
BestProps used document-based research from primary firm sources, checked September 24, 2026. The complete source list, scope, limitations, and commercial-state record appear near the end of this article.
The lesson is delivered as the twenty-fourth teaching and the final delivery month of the mentorship, and it picks up directly where a monthly-to-weekly presentation left off (0:17 and 0:22). He is explicit that this is his personal approach rather than a general prescription (0:41). The captions are automatic YouTube captions, so his terminology is damaged in places; those points are flagged below where they matter.
What the weekly pass is meant to produce
He states the goals of the presentation up front: judge the impact of the weekly perspective on a market, identify the directional bias of the higher time frame, classify the PD arrays accurately to support key levels, and complete an institutional analysis on a weekly basis (2:16). The organising idea is that work done on the monthly chart is transposed to the weekly, where the extra detail can reveal levels the higher time frame did not show, and the weekly result is then transposed to the daily (0:51 and 0:56). He also says he does not take shortcuts, tells viewers not to make a half-hearted attempt at the analysis, and adds that a half-hearted attempt should not be expected to produce anything but lacklustre results (1:45, 1:54 and 2:00).
Relative strength first, and why it comes before positioning
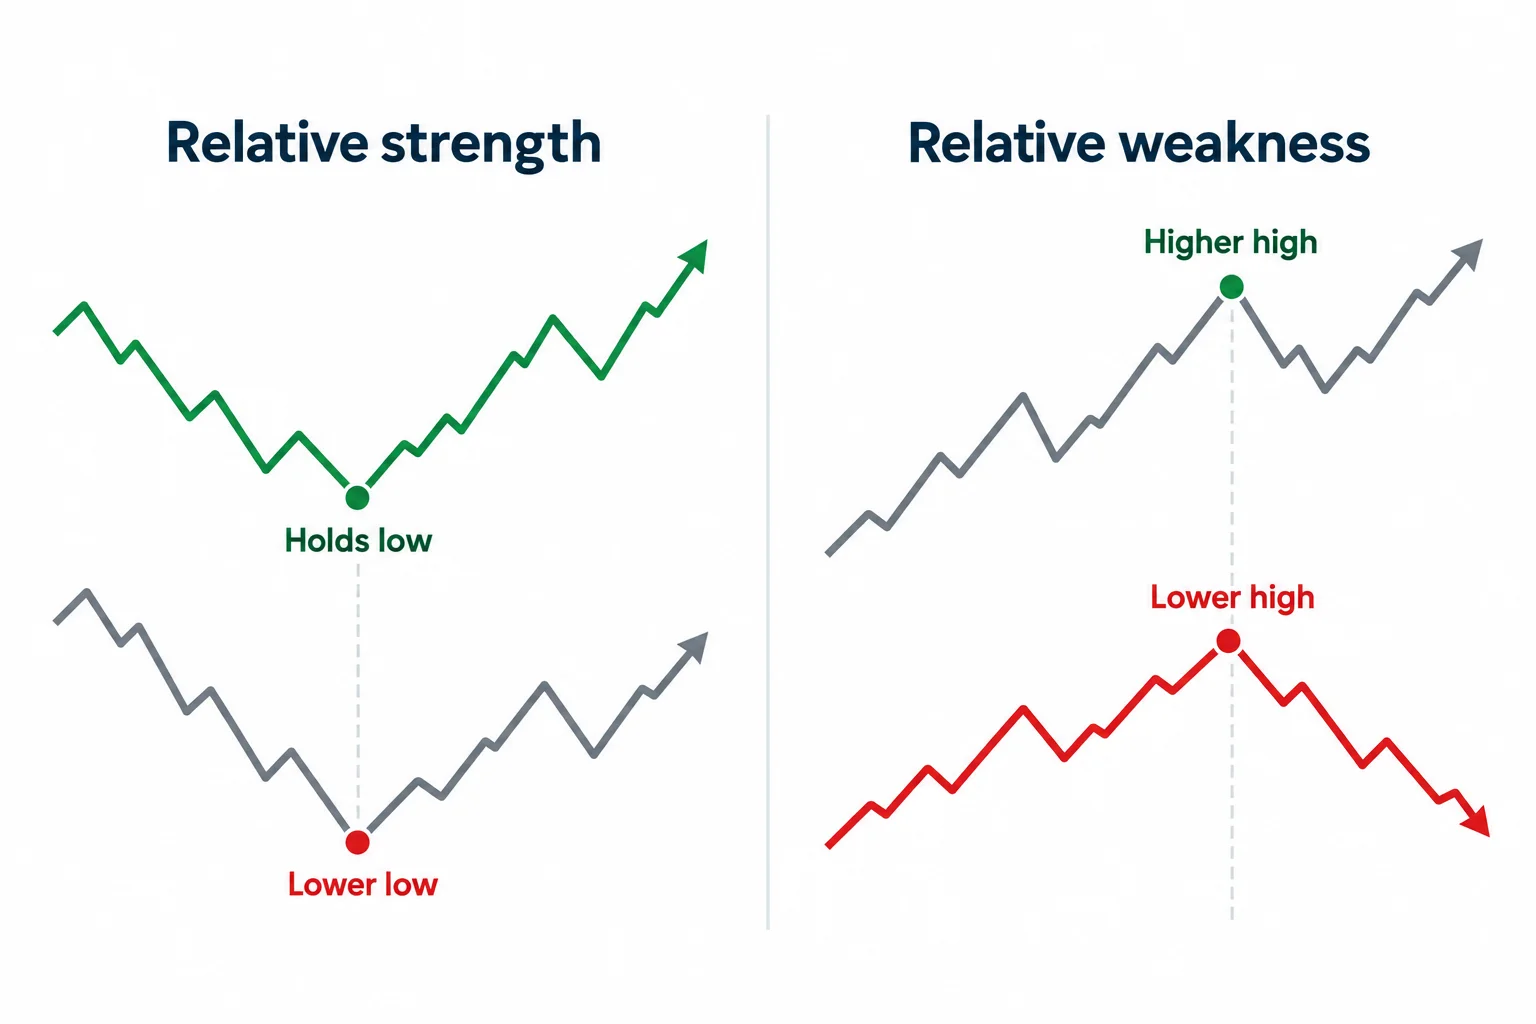
He says he begins every new week with relative strength, and gives the reason plainly: the monthly chart may not speak clearly to him, and starting here avoids needless frustration (2:47). He applies it across commodities, currencies and stocks, and describes the test as finding markets that lead in strength by failing to make lower lows and markets that lead in weakness by failing to make higher highs (8:29 and 8:44). For stocks he says he looks within the top industry groups ranked by Investors Business Daily (8:51).
The point of the step is selection, not entry. He uses it to narrow a wide universe down to the handful of markets worth analysing further, which is why he runs it before the positioning and sentiment work rather than after (3:13).
The Commitment of Traders step and his own midpoint convention
He moves next to the Commitment of Traders report and says he wants to know what the commercial hedgers are doing, on the reasoning that because they hedge in such large size they themselves create the highs and lows of the marketplace (9:42 and 9:48). He says he looks for commercials at a twelve-month or six-month extreme in net holdings, and separately sorts markets that sit at two-year and four-year extremes (10:54 and 10:59).
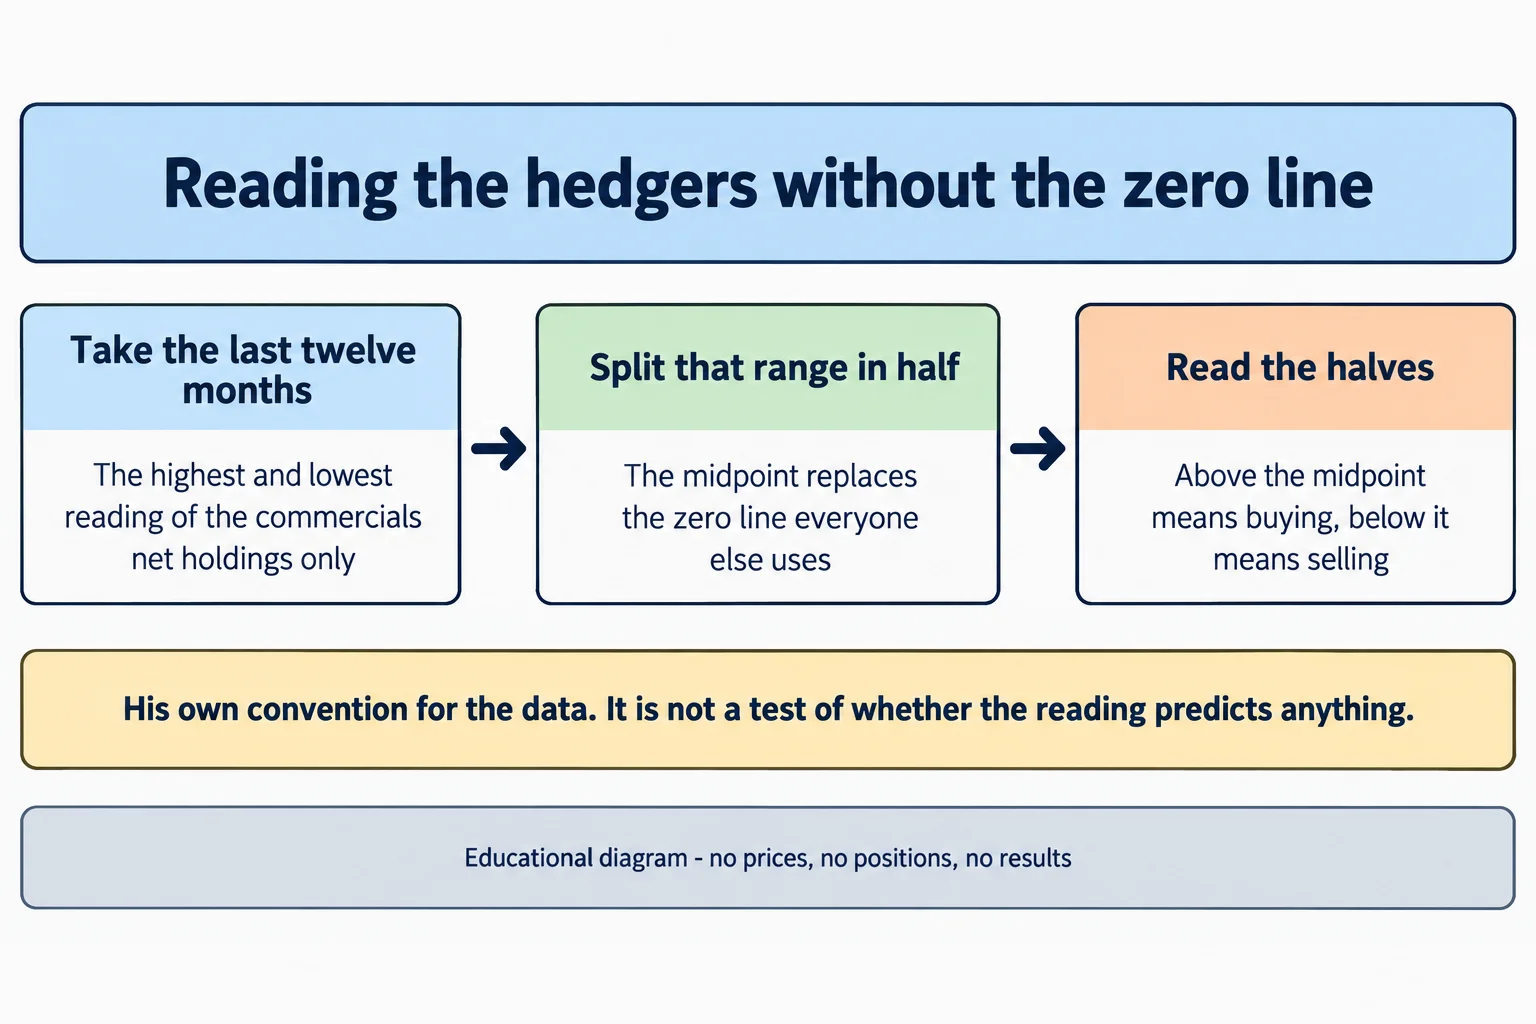
He then describes the adjustment he makes to the standard chart. Rather than reading the zero line on a net-trader position chart, he takes the highest and lowest reading of the commercials’ net holdings over the last twelve months, splits that range in half, and treats everything above the midpoint as buying and everything below it as selling (19:22, 19:30 and 42:42). He says this is a concept of his own, refers viewers back to an earlier teaching for the detail rather than repeating it, and adds that he also sorts commodities whose net holding is unusually large relative to the futures group they belong to (11:06 and 11:47).
Sentiment, market profile and intermarket checks
For sentiment he says he reads headlines from financial publications and that he likes to fade the big story, waiting for descriptive, emotionally loaded language to build a consensus before leaning the other way (12:17 and 12:27). He pairs that with Williams percent R on the weekly chart, and in the worked example compares a twenty-period setting against a fourteen-period one, then mentions ten periods as a still faster option (13:39, 39:50 and 41:27). Choosing a setting because it fits past highs and lows visually is the kind of comparison that can bake in hindsight, so that part is best read as an illustration of his process rather than a validated indicator.
Market profile comes next, framed as a question about what the market is doing: whether it is in consolidation and therefore likely to show evidence before a breakout, or trending and therefore possibly reaching an extreme, in which case he says he looks for a retracement first rather than a reversal (14:20, 15:00 and 15:29). He then confirms the reading with correlation, referring to USDX smart-money divergence or a correlated pair such as euro to cable (17:07 and 17:13).
The PD array matrix and the weekly bias
After arriving at a portion of price action he wants to analyse, he breaks the selected range into premium and discount, noting only the arrays that are obvious on the weekly chart and saying that not every range will contain every possible array (17:57 and 18:04). He rounds each array to the nearest ten or five level, with premium arrays sitting above the market price and discount arrays below it (18:43 and 18:50). The step ends with a weekly bias, which is then carried to the daily chart (19:02 and 20:26).
The Australian dollar walkthrough
He then works the example, opening an Australian dollar monthly chart and carrying its levels into the weekly (20:40). He points out a rejection block and an old high as premium arrays, defines the range by its low and high, and notes where the discount array sat relative to price (20:52 and 20:57). The monthly levels are then transposed to the weekly, where the additional detail makes a discount area visible that the monthly chart alone did not show (23:25 and 26:14).
On the positioning side of the example he applies his midpoint reading to the Australian dollar, saying he split the twelve-month range in half to create the line he uses in place of the zero line (29:37 and 29:49). He describes the headline environment as saying the currency was directionless or bearish, calls that sentiment bearish and diametrically opposed to the commercials he reads as buying, and points to a seasonal tendency for June (43:00, 43:08 and 43:13). He also names what he calls a resistance liquidity run resting above equal highs as evidence of institutional order flow supporting higher prices (28:13 and 28:24).
This walkthrough is retrospective. He is talking through a chart after the fact, and he says as much when he describes the seasonal fit as looking form-fitting (40:30). Nothing in it establishes an entry, a fill or a result.
How he says the time frames should be used
He closes by pushing a modular idea: take the process from beginning to end, apply each tool to the time frame it belongs to, and do not try to force every concept onto one chart because that produces confusion rather than clarity. Each time frame, he says, has its own characteristics and its own set of tools (46:12 and 46:28). That is the genuinely transferable part of the lesson: the organisation of a review rather than a claim about what price will do.
What the lesson does not establish
- The positioning method is his own convention. He asserts that the standard net-position chart can be misread and that his midpoint reading is clearer, but the lesson offers no measurement of how often it identifies turning points or how it performs against the data it replaces.
- His claim that commercial hedgers create the highs and lows of the marketplace is stated as a premise for the method, not demonstrated. The lesson supplies no study that establishes it.
- The Australian dollar example is retrospective and narrated. No entry, fill, stop, position size or profit figure is given, and the seasonal and oscillator readings were selected with the benefit of the chart that followed.
- No account, statement or order record appears anywhere in the lesson, and no result is reported for any market.
- The sentiment technique depends on the speaker’s judgement about when a headline narrative is crowded enough to fade. That threshold is not defined, so the step cannot be reproduced mechanically from this source.
- Terms such as institutional order flow, smart money and premium or discount arrays are the speaker’s labels for price action. The captions cannot establish which institutions, if any, were trading at a given level.
- Automatic captions misrecognise some terms in this lesson, including the software name rendered as net Trader “physician” where a position chart is meant. Those renderings are flagged rather than silently corrected.
Watch the original recording
ICT Mentorship Core Content – Month 12 – Intermediate Term Top Down Analysis
The Inner Circle Trader · published 28 October 2022 · about 48 minutes 47 seconds. This is the primary source for this article; every timestamp link above points into it.
The video is not embedded here because the owner has disabled playback on other websites. That was checked directly on 15 September 2026 from a BestProps page origin: the embedded player loads and returns “Playback on other websites has been disabled by the video owner” instead of playing, so no empty player is left on this page.
The watch page was read on 15 September 2026 and rendered as a public, listed video: ICT Mentorship Core Content – Month 12 – Intermediate Term Top Down Analysis by The Inner Circle Trader, published 28 October 2022, listed duration 2,927 seconds, about 158,300 views, playback on other sites disabled by the owner. The scheduling inventory lists the same upload under 28 October 2022, so the two agree. The caption file covers 2,928.74 seconds, which matches the listed duration within a second.
Resources
These are the sources checked for this article. The regulator and investor-education pages are general material about futures, positioning reports and trading systems sold to the public; neither assesses the speaker, verifies any level or reading above, nor endorses anything said in the recording. The Commitments of Traders material is included because the lesson is built around that report; the official page is a description of the data, not a validation of the speaker’s method for reading it. Any ICT, smart-money or third-party indicator, script, note set, transcript pack, chart annotation or re-upload circulating outside the publishing channel’s own page is unofficial and untested here.
- [1] ICT Mentorship Core Content – Month 12 – Intermediate Term Top Down Analysis — The Inner Circle Trader (primary source; watch page read 15 September 2026, 2,927 seconds).
- [2] The Inner Circle Trader — official YouTube channel (read 15 September 2026).
- [3] CFTC — Commitments of Traders (read 15 September 2026) — the official report the lesson is built around, and a description of what its categories do and do not measure.
- [4] CFTC — Fraud Advisory: Commodity Trading Systems Sold on the Internet (read 15 September 2026) — how hypothetical or simulated results are presented to the public.
Source: ICT, ICT Mentorship Core Content – Month 12 – Intermediate Term Top Down Analysis, The Inner Circle Trader, 28 October 2022. Automatic YouTube captions were the transcript used for this article. This commentary is educational and is not investment advice.
