
Key takeaways
ICT Mentorship Core Content Month 10 presents a top-down sell-watchlist framework that begins with a bearish broad-market thesis, focuses on January and especially early May through late July, requires bearish weekly structure, compares stock rallies with major indices, accepts only obvious SMT divergence, rejects candidates lacking a suitable failed rally, and narrows the universe to…
Read the full summary
ICT Mentorship Core Content Month 10 presents a top-down sell-watchlist framework that begins with a bearish broad-market thesis, focuses on January and especially early May through late July, requires bearish weekly structure, compares stock rallies with major indices, accepts only obvious SMT divergence, rejects candidates lacking a suitable failed rally, and narrows the universe to roughly 2 to 4 stocks. In the 2015 examples, a Nasdaq higher high unmatched by the Dow and S&P is treated as possible distribution, while Dow components failing to match Dow higher highs are classified as relatively weak. American Express, Caterpillar, Chevron, Exxon Mobil, and Walmart are reviewed, but Walmart is removed because it drifted lower without the preferred rally to sell, while Verizon, GE, and Coca-Cola are avoided as comparatively defensive stocks under the lesson’s terminology. Homework applies the same buy- and sell-watchlist parameters to Nasdaq-100 constituents. The examples are retrospective and provide no underlying chart data, objective institutional order flow formula, complete failure sample, entries, fills, stops, position sizing, transaction costs, options strategy, or independently verified performance, so the method is a screening framework rather than evidence of predictive reliability or investment advice.
How we researched this article
BestProps used document-based research from primary firm sources, checked September 24, 2026. The complete source list, scope, limitations, and commercial-state record appear near the end of this article.
ICT Mentorship Core Content – Month 10 – Stock Trading – Building Sell Watchlists runs about 13 minutes 49 seconds. ICT introduces it as lesson three of the June 2017 stock trading content, while the watch page gives an upload time of 21 October 2022 — the recording is a re-release of older mentorship material. This article is built from the recording’s full 343-segment auto-generated English caption track rather than from its title or description, and the timestamp links below let you compare each point with what was actually said.
In the lesson, ICT presents a top-down method for finding stocks that appear weak when the broader market is expected to decline. He uses historical Dow Jones Industrial Average component charts and concentrates primarily on the May-through-July period. The auto-generated captions misrecognize several terms — the speaker says “ICT” where the text reads “SCT,” and “sell” where it reads “cell” — and the transcript carries no underlying chart data.
This is a summary of ICT’s interpretation of those historical examples, not evidence that the method predicts declines reliably. The captions do not provide the underlying chart data, entries, fills, risk controls, or independently verified results.
ICT Sell Watchlist Filters
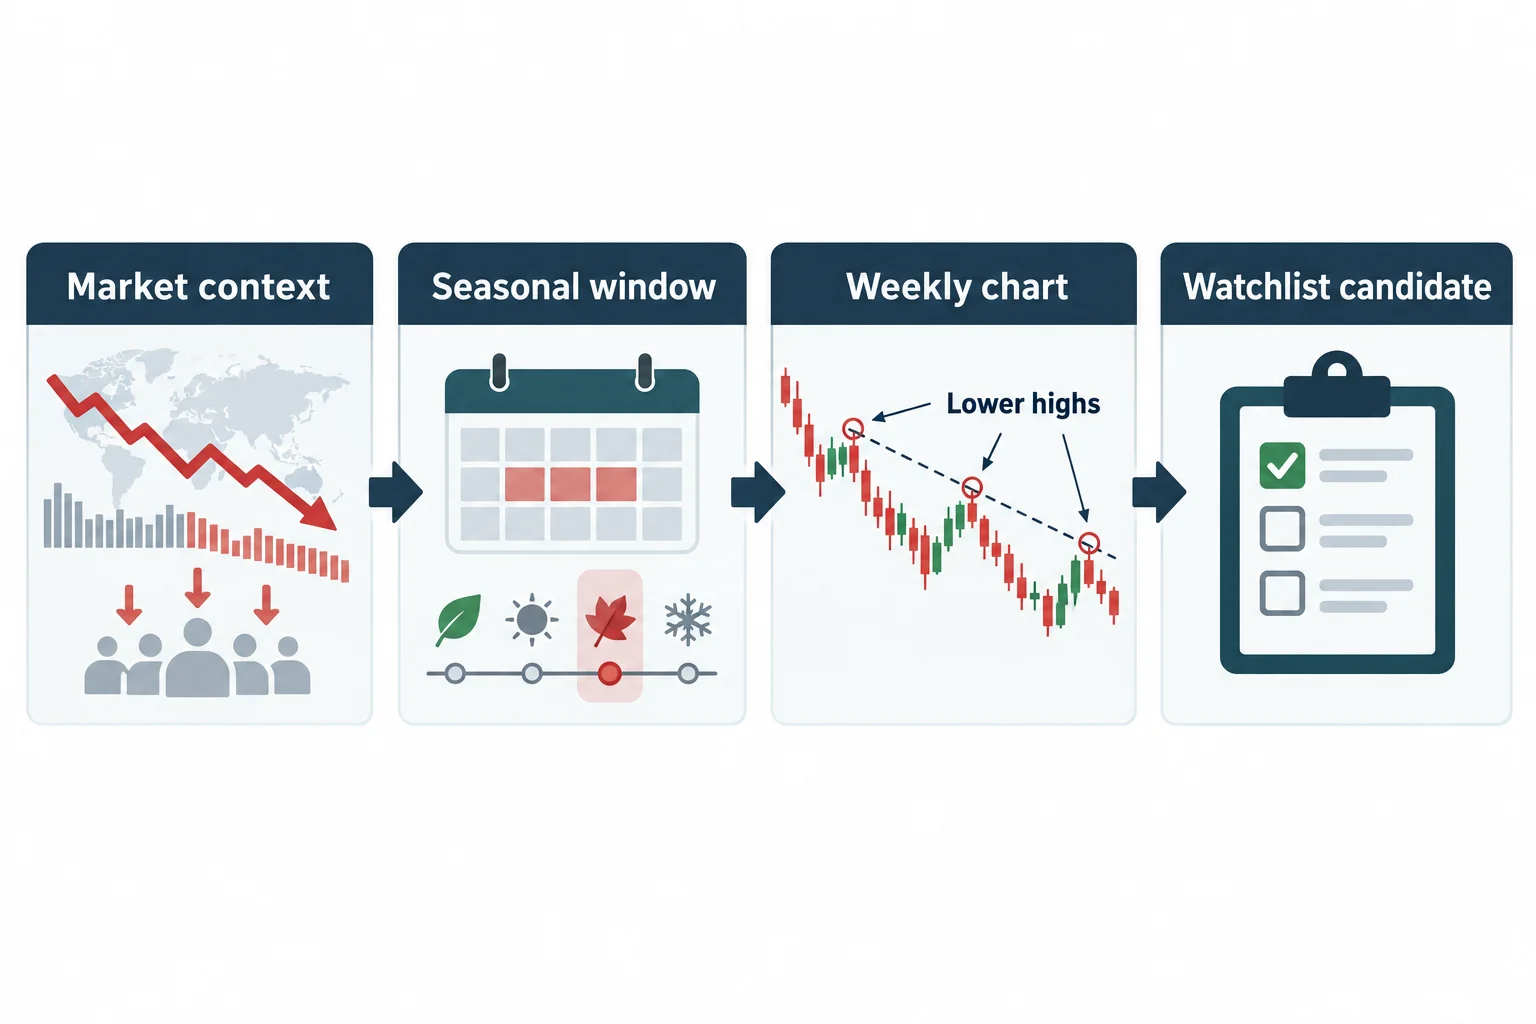
ICT introduces the framework at 1:40. His first filter is that the overall stock market must be poised to decline. His second is to look during what he considers seasonally bearish months for stocks forming lower highs. He adds that the stocks he wants are ones already trending lower on a weekly chart before the setup appears.
The lesson emphasizes January and, more extensively, the interval from the beginning of May through the first of August. At 1:54 he calls the months of January and May through July ideal short swing setups. ICT treats seasonality as context rather than a sufficient signal by itself. In his model, a candidate should also exhibit bearish weekly structure before it is added to a short list.
- Begin with a bearish assessment of the broader stock market.
- Focus on a predefined seasonal window.
- Review weekly charts for an existing downward trend or bearish structure.
- Compare each stock’s rallies with those of the major indices.
- Narrow the initial universe to roughly two to four candidates.
ICT also says he would not include comparatively defensive or “safe” stocks in this particular selection process, naming Verizon, GE, and Coca-Cola as examples. He states his target selection size at 2:34, where he says the process aims to narrow the list to two to four companies. That “safe stock” label reflects the speaker’s terminology in the lesson, not a current assessment of those securities.
ICT Stock Weakness and SMT Divergence
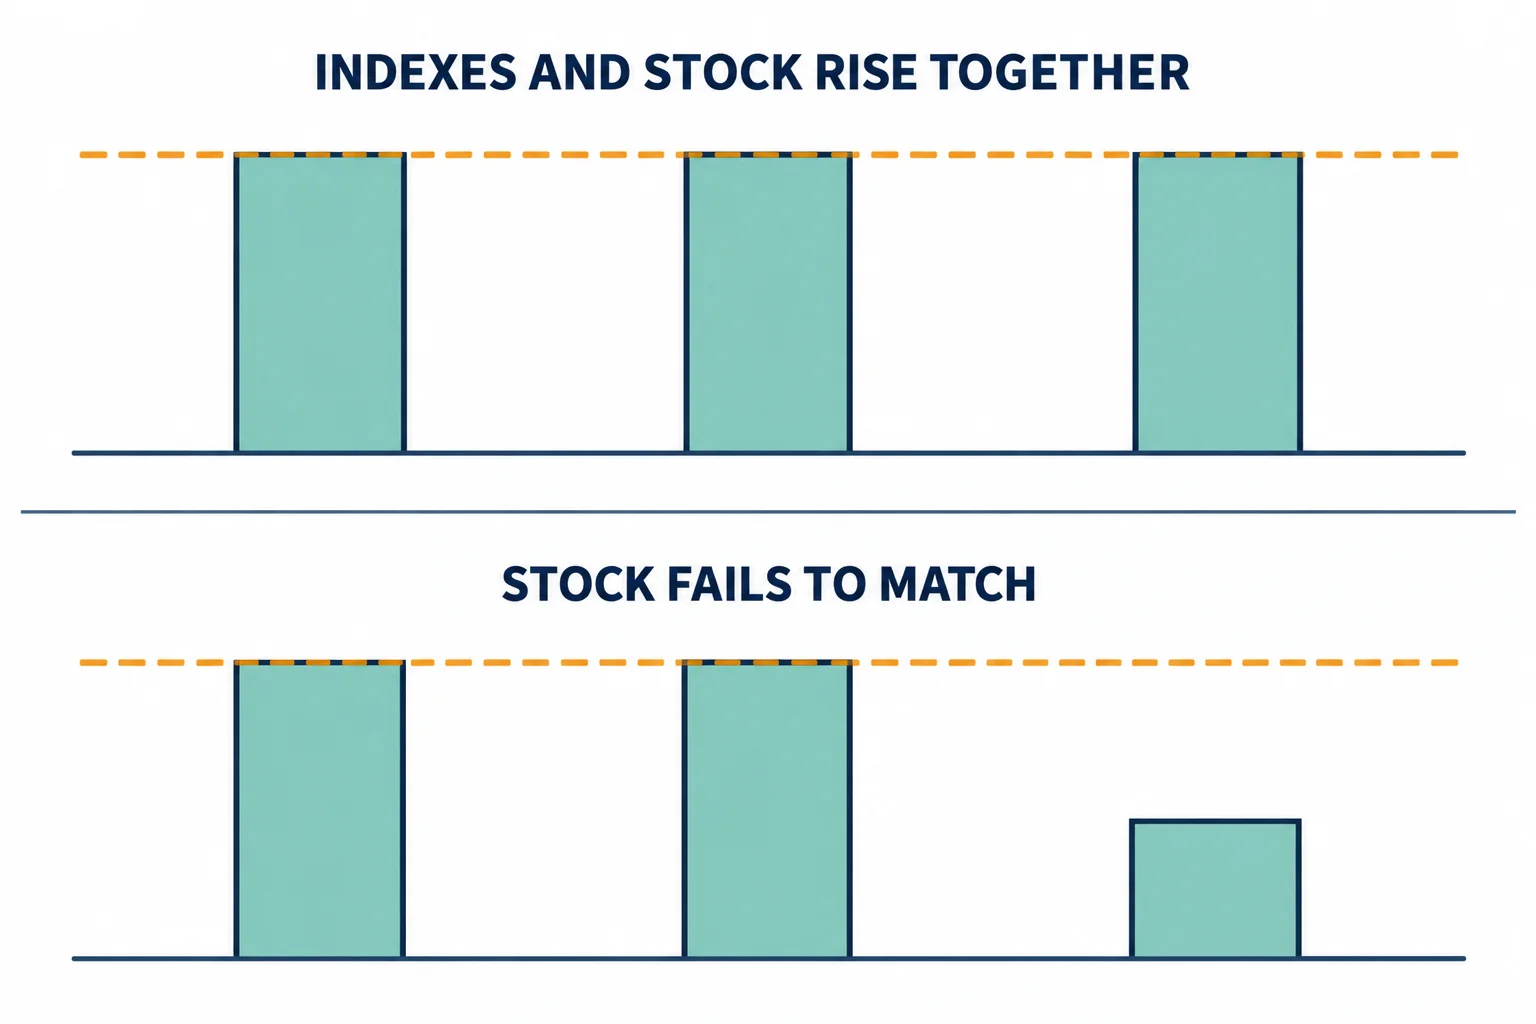
At 3:21, ICT turns to what he calls index SMT divergence. In the 2015 May-to-July example he notes that the Nasdaq made a higher high while the Dow and S&P did not make comparable highs. He interprets that disagreement among the indices as what he calls a classic fingerprint for distribution in the stock market.
He then applies a similar comparison to individual stocks. If the Dow advances to higher highs but a component cannot produce a comparable higher high, ICT classifies the stock as relatively weak. In his framework, that failure becomes more relevant when the stock already has bearish weekly “institutional order flow” and the calendar is within the selected seasonal window.
A practical constraint appears at 4:54: ICT says the divergence must be obvious. If the comparison is debatable, he treats it as no divergence. This rule is intended to prevent a watchlist from being built around marginal visual differences, although “obvious” remains subjective and is not quantified in the transcript.
ICT Sell Watchlist Stock Examples
ICT reviews weekly charts for American Express, Caterpillar, Chevron, Exxon Mobil, and Walmart. In each principal 2015 example, he compares the stock with the Dow during the May-to-August interval.
ICT Stock Examples From American Express and Caterpillar
The American Express discussion starts at 3:54. ICT says the Dow was making higher highs into May while American Express shares failed to rally comparably, which he interprets as heavy distribution. He uses an earlier bullish period as a contrast, explaining that it did not show a sufficiently clear divergence, and reports a decline on his charts from around 80 dollars a share to almost 50, a move of roughly thirty dollars.
At 5:52, Caterpillar is evaluated with the same test. ICT rejects the bullish-period comparison because, at 6:08, it did not give what he calls a failure swing to go with a lower high, so in his words there was nothing to do with it even though he expected bearish prices overall. He then identifies relative weakness in the 2015 chart while describing the weekly trend as bearish, and reports a move from almost 90 dollars a share down to about 55.
ICT Stock Examples From Chevron Exxon Mobil and Walmart
Chevron appears at 7:04, followed by Exxon Mobil at 7:52. For both, ICT points to the Dow making higher highs in May to August of 2015 while the individual shares made lower highs, and he describes the selling accelerating during the seasonal decline. He reports Chevron falling from around 110 dollars a share to 70, and Exxon Mobil from about 90 down to almost 66.
The final example is Walmart at 8:36. Although ICT reports the shares failing to make higher highs while the Dow did, he says at 9:16 that Walmart is the one he would probably have thrown aside. His reason is that it consolidated through late 2013 and 2014 and then drifted steadily lower without attempting to rally, and he wanted a market protractionary state where a rally could be sold. This illustrates that weakness alone did not qualify a stock under his preferred setup; he wanted a clearer retracement or failed rally. He adds at 9:58 that the earlier selections, rather than Walmart, would have been the ones to choose from when looking for put options — a remark about the next step rather than a demonstrated options trade.
Build an ICT Sell Watchlist Checklist
As a homework exercise, ICT asks viewers at 12:10 to work through the Nasdaq-100 constituents with the same buy- and sell-watchlist parameters, noting that this is a little more than three times the number of Dow Jones stocks reviewed in the lesson. Based strictly on this lesson, the sell-side research process can be summarized as follows:
- Define the stock universe before examining individual setups.
- Form a broad-market directional thesis.
- Check whether the period aligns with ICT’s seasonal model.
- Use weekly charts to identify candidates already displaying bearish structure.
- Compare each candidate’s highs with the major indices.
- Discard unclear divergences and stocks lacking a suitable failed rally.
- Reduce the list to a small group for further evaluation rather than treating inclusion as an automatic trade.
ICT Stock Watchlist Limits
The broader educational value is the organization of screening criteria: market context, time window, trend, relative strength, and final candidate selection. These categories can make chart review more consistent. However, the transcript does not define an objective formula for “institutional order flow,” establish that seasonal tendencies persist, or test the method against a complete sample that includes failures.
ICT makes strong claims near the end about recurring institutional behavior. At 10:16 he argues that institutions are largely doing the same thing all the time because they need consistency, that these recurring traits can be tracked, and that the approach is a method he says you can pass on for building retirement or secondary income. Those are the speaker’s market interpretations, not verified conclusions supplied by the transcript. The examples are retrospective, the reported price declines are read off his own charts rather than independently sourced, and no entry rules, stop placement, position sizing, transaction costs, or complete options strategy are demonstrated. He closes at 13:25 by pointing to stock selection and options material still to come in the month.
This material is therefore best treated as commentary on ICT’s screening framework, not investment advice or a promise of performance. Short selling in particular carries risks beyond those of a long position: losses are not capped at the amount invested, borrowed shares must be returned, and borrowing fees, margin requirements and dividend obligations can apply.
Watch the original recording
Watch the original lesson on YouTube
This recording cannot be played inside another website. Its embedded player was loaded from a BestProps origin and clicked on 15 September 2026 at both desktop and mobile widths: it reported “Video unavailable” and “Playback on other websites has been disabled by the video owner”, the video element never advanced past readyState 0, and no duration or playback progress was available. The recording’s own watch-page data agrees, reporting the video as not playable in an embed, so no iframe is placed here. The video itself is public and available directly on YouTube.
Watch ICT Mentorship – Stock Trading – Building Sell Watchlists on YouTube ↗
Source and further reading
- ICT Mentorship Core Content – Month 10 – Stock Trading – Building Sell Watchlists — the primary source for this article. Every described step, preference and reported price move above comes from this recording’s caption track; use the timestamp links to compare each point with what was actually said.
- The Inner Circle Trader YouTube channel — the publisher’s own channel, where this mentorship month and the lessons it refers back to are posted. Unofficial reuploads and third-party summaries are not the source used here.
- Investor.gov (SEC) — Stock Purchases and Sales: Long and Short — the US regulator’s plain-language explanation of what a short position actually is, including that short sales are normally settled by delivering borrowed stock and that borrowing fees, margin rules and dividend obligations can apply. Independent context for the short-selling side of this lesson, which the recording does not discuss in operational detail.
- Investor.gov (SEC) — Stocks FAQs — neutral reference material on what stocks are, the categories they fall into and the general benefits and risks of owning them. Useful for keeping the lesson’s relative-strength terminology separate from a definition of the asset class. Regulator education material; it does not assess this presenter’s method.
BestProps is not affiliated with the Inner Circle Trader, and no source listed here endorses this article. “Institutional order flow”, SMT divergence, distribution and smart money are used as descriptive terms for what the recording teaches, not as established market mechanics. The reported dollar moves in the American Express, Caterpillar, Chevron, Exxon Mobil and Walmart examples are the speaker’s own readings of his charts, and the caption track contains no fills, position sizes, account data or independently verified results. Index membership and the seasonal behaviour of any market can change, and past price behaviour does not indicate future results. This is independent educational commentary, not official ICT material, not a tested trading system and not investment advice.