
Key takeaways
In “ICT Mentorship Core Content – Month 10 – Index Futures – Index Trade Setups” — lesson five of the June 2017 mentorship content, published on YouTube in October 2022 — ICT maps six conditional intraday profiles for the S&P, Nasdaq and Dow futures.
Read the full summary
In “ICT Mentorship Core Content – Month 10 – Index Futures – Index Trade Setups” — lesson five of the June 2017 mentorship content, published on YouTube in October 2022 — ICT maps six conditional intraday profiles for the S&P, Nasdaq and Dow futures. Each profile pairs a time window with an index comparison: two sessions up close (1:06), two sessions down close (5:14), a morning rally with an afternoon reversal (8:39), the inverse (11:23), and two consolidation variants (13:29, 16:08). The recurring mechanics are a comparison of highs or lows across the three averages — he calls one failing to confirm the others index SMT divergence (1:16) — a hold for time of day around 10:30 to 11:00 a.m. New York, and 15-minute or 60-minute premium and discount PD arrays as the objectives, nested inside four-hour or daily areas when the day is meant to reverse. His worked example is the session recorded on Friday 23 June 2017, where the Dow held above its morning low while the Nasdaq and S&P made lower lows, and later the Nasdaq exceeded its lunch high while the Dow and S&P did not (18:58). He presents all of it as paper-trade material, states he is not a licensed commodity trading adviser (0:16), and the recording contains no executions, fills or results of any kind.
How we researched this article
BestProps used document-based research from primary firm sources, checked September 24, 2026. The complete source list, scope, limitations, and commercial-state record appear near the end of this article.
This is lesson five of the June 2017 content and it builds on the previous lesson’s range projections and objectives, which he says he is amplifying into setups (0:41). He describes the material himself as rather simplistic, and says that is deliberate: complicate it, and you will have a million questions and never reach an understanding (0:51).
The three recurring components
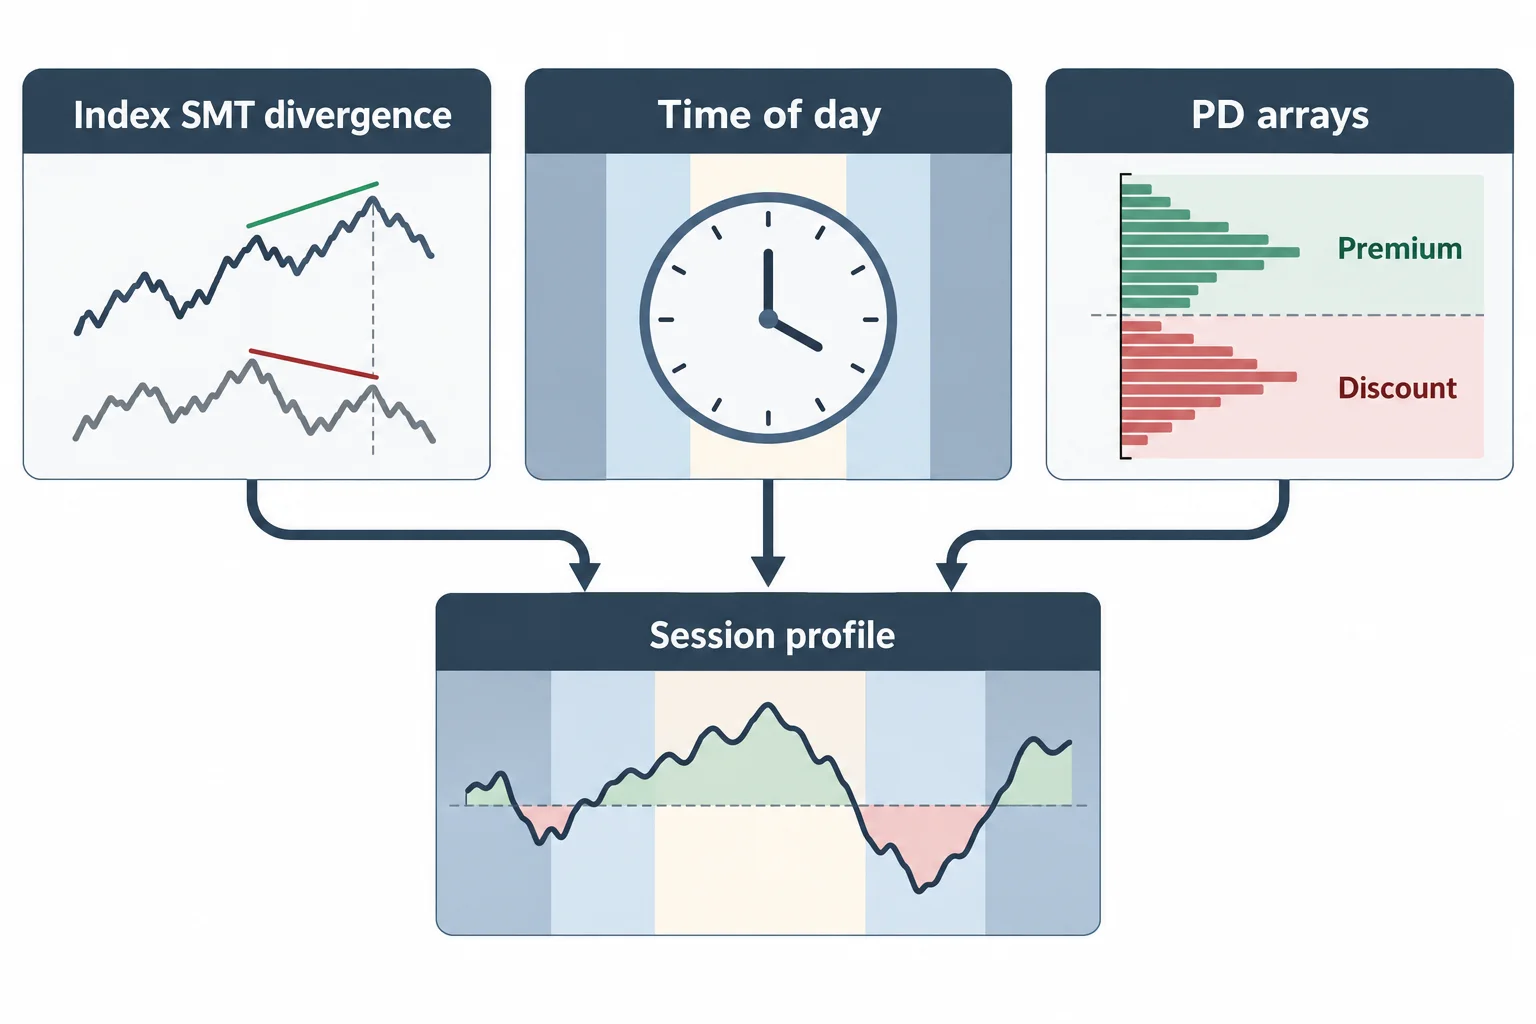
Every profile in the lesson is assembled from the same three pieces. The first is relative behaviour across the three averages: he compares the highs or the lows of the S&P, the Nasdaq and the Dow, and treats one of them failing to confirm the others as index SMT divergence (1:16). The second is time of day: the profiles are divided into the New York morning, the lunch hour and the afternoon session. The third is price location, expressed as 15-minute or 60-minute premium and discount PD arrays, which can be nested inside a four-hour or daily area (4:24).
“PD array” is his own shorthand for a price-delivery reference area; in this recording he names fair value gaps, order blocks and liquidity voids as possible forms of one (6:12). Premium and discount refer to the upper and lower portions of a range. None of these terms is a standard published indicator, and nothing in the recording tests whether the areas predict anything.
Two sessions up close and two sessions down close
The bullish profile, which he calls two session up close, begins with the morning trend returning to a discount array (1:06). The confirmation he wants is index SMT divergence on the lows, comparing the London session low into the 9:30 a.m. equities open. He adds that it does not have to be the E-mini S&P that diverges — if the Nasdaq fails to make the lower low, he treats that alone as support for the S&P rallying (2:51). His stated hold runs to time of day: roughly 10:30 to 11:00 a.m. New York, which he associates with the London close (1:45).
One instruction in this profile matters more than the geometry: do not take small profits early. He argues that allowing time of day to deliver more range increases the chance of a larger move, so profit-taking after a couple of handles works against the profile (3:54). That is a description of how he says he manages a paper position, not a demonstrated result.
He then expects the morning and afternoon highs to align with a 15-minute or 60-minute premium array (4:19), and allows for a two-stage afternoon: price may fall short of the projected array, retrace, and then make an additional ramp in the final hour until it reaches it (5:01).
The bearish counterpart, two sessions down close, starts from the same framework inverted (5:14). In the morning, as price returns to a premium array, he compares the Nasdaq and the Dow against the S&P and looks for the highs to diverge from London into the open (5:18). Again he holds to roughly 10:30 to 11:00 a.m., expecting consolidation or a pause into the lunch hour (5:41). The lunch-hour high is compared across the same three markets, and the rally can either return to a fair value gap, a bearish order block or a liquidity void, or run the lunch high for buy stops and then reject (6:10). Weakness, in his framing, is hunted immediately after the lunch hour closes, from one o’clock New York (6:47).
His exit framing is the same in both directions and is stated as a preference rather than a rule: hold towards the close, at least to the three o’clock bond close and ideally into four o’clock, and expect the intraday lows to line up with a 15-minute or 60-minute discount array on a down-close day (7:33). He also notes the afternoon can develop as a two-stage move, where a short-term bounce takes early profit and then price breaks another leg lower into the close (8:09).
Morning move, afternoon reversal
The third profile is an AM rally followed by a PM reversal (8:39). He compares the three averages on the lows, waits for one to fail to make the lower low, and reads that as the signal to be a buyer of the E-mini S&P for the New York session, holding again to just before or just past eleven o’clock (8:50). Ahead of noon he expects a little profit-taking retracement, then an afternoon rally to sell into. What happens next depends on where the morning turning point formed: if the morning discount array is also a higher-time-frame discount, he expects a short-term bounce or a resumption higher to take out the daily high; if it is not, he expects continuation lower and the intraday low taken out in the afternoon (9:55).
He is explicit that 15 and 60 minutes are not, on their own, higher time frames. The catalyst for this reversal, in his words, is a nested overlap — the 15- or 60-minute premium array coinciding with a daily or four-hour premium array (10:56).
The inverse profile — morning decline, afternoon reversal (11:23) — looks for the bearish divergence on the highs from London into the 9:30 open, holds to 10:30 or nearer eleven o’clock, expects consolidation into lunch, and then anticipates a run on the daily low or the lunch-hour low in the afternoon (11:25, 11:56). The same nested-versus-not question decides whether he expects a resumption lower from the morning premium array or a further push up that takes out the intraday high.
Consolidation first, then a directional afternoon
Two profiles begin with a consolidation. In the first, an AM decline and a PM rally (13:29), he wants the indices diverging bearishly at the highs, holds to around 10:30 to 11:00, and then after eleven expects consolidation or a retracement higher into lunch. After lunch he compares the lows across the Nasdaq, the Dow and the E-mini futures and looks for time of day to support upside expansion (14:08). If it turns out to be consolidation rather than expansion, he does not expect the move to run into the close: it would instead be an early short-term high that later declines into the close, with the comparable PM high often forming around two o’clock in the afternoon (14:33).
In the second, an AM rally and a PM decline (16:08), the morning work is the same bullish divergence at the lows, held to 10:30 to 11:00, with consolidation or retracement into lunch; after one o’clock New York he compares divergences at the highs and holds for around two o’clock as a minimum while looking for a run into the short-term lows (16:11). Whether the afternoon merely runs the lunch-hour high or instead runs the intraday high into a four-hour or daily premium array turns on where the morning high formed (17:11). He summarises the rule as a simple measure: if the morning high fell short of the four-hour or daily premium array, the odds are it will rally harder to reach that level and then reverse (17:41). The afternoon low, around two o’clock, is usually a 15- to 60-minute discount array (18:00).
The worked example: Friday 23 June 2017
He closes with a session he says happened on the day of recording, Friday 23 June 2017, as an illustration of the consolidation, AM rally, PM decline profile (18:17). Going into the morning session, on the bottom chart, the Dow’s low failed to go lower while the Nasdaq and the S&P both made lower lows. He reads the Dow as bucking the trend, infers strong buyers stepping in, and notes the S&P rallied as a result (18:41).
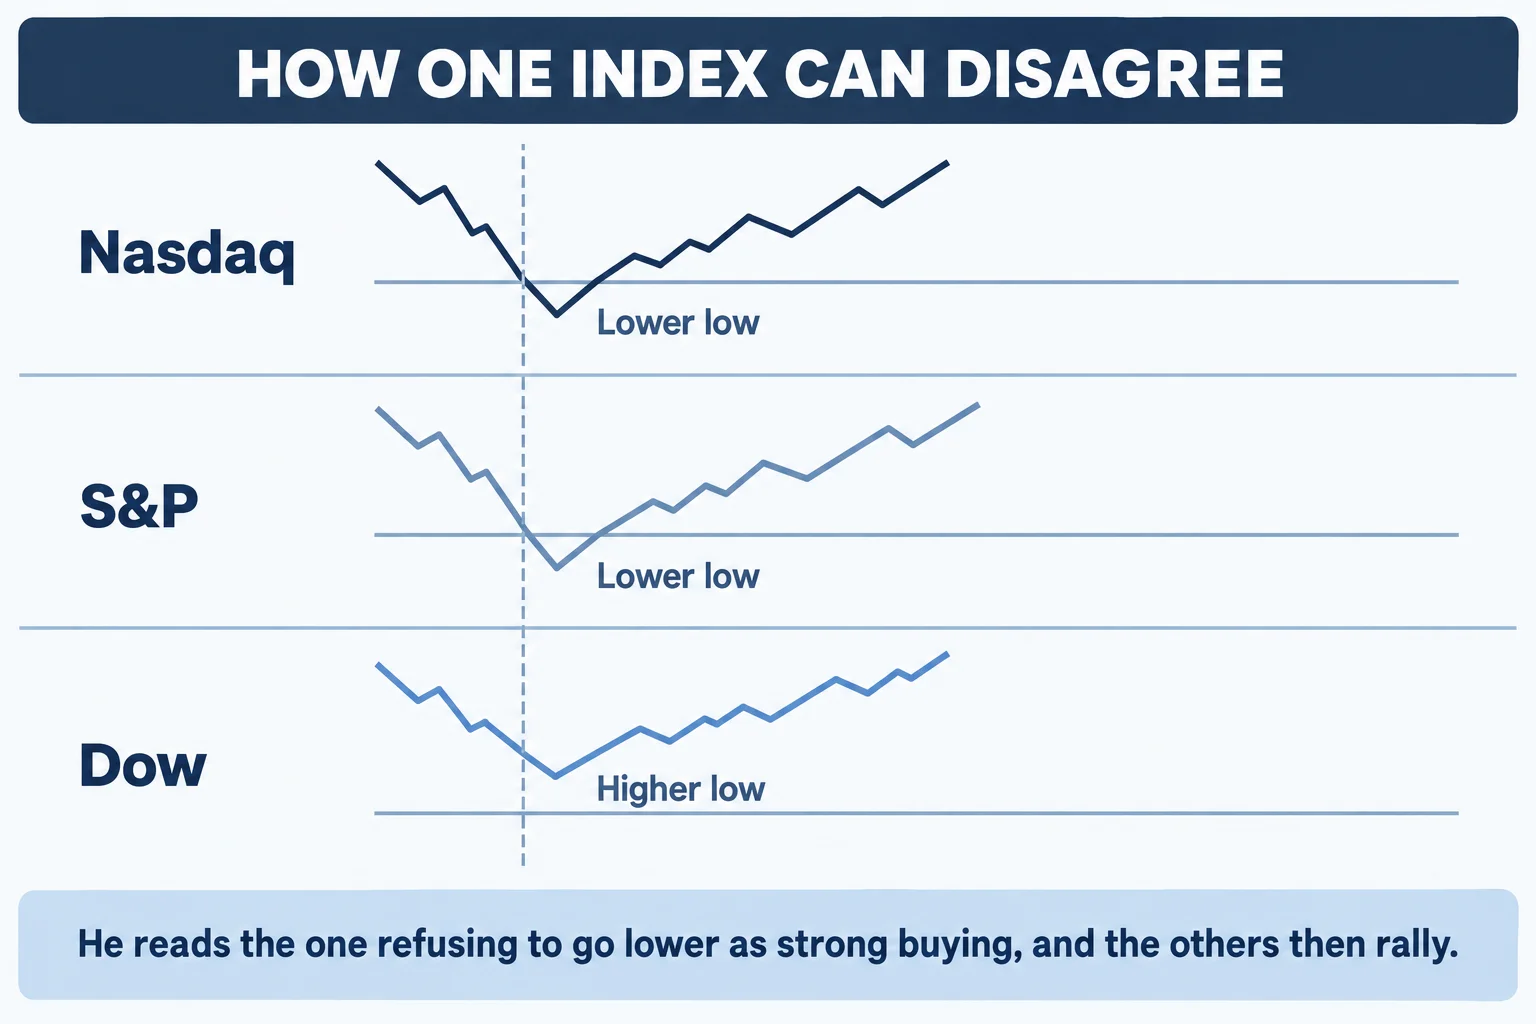
The second half of the example is the mirror image. After the lunch hour, from twelve to one o’clock New York, the Dow made a lower high than its lunch high and went lower, the Nasdaq made a higher high than the lunch high, and the S&P failed to make a higher high before price traded back down to the middle of the range (19:20). He adds one further detail: during the morning, the S&P rally had traded up into an older premium array, which he points to on an old high (20:02).
Two things should be kept apart in that example. The observable part is the disagreement between the averages in the morning and again after lunch — that is what he is describing, and it is a description of a chart. The interpretive part is everything attached to it: that the Dow holding its low showed strong buyers, that the non-confirmation after lunch was bearish, and that price returned to equilibrium as a consequence. The recording shows him narrating these conclusions over charts; it supplies no prices, no orders, no fills and no evidence about who was buying or selling.
What the lesson gives a student, and what it leaves open
The transferable element is the structure of the exercise: pick a projected day profile, compare the three index futures at a specific session high or low, ask whether price is at one of the reference areas, and then check whether the time window supports holding the position. That is a way of organising a session into a hypothesis with a stated invalidation point, which is more disciplined than watching a chart without a plan.
The open items are considerable. Nothing in the recording defines objectively how much divergence counts, or over what lookback the lows and highs are compared — “highly specific” is his description of the price points, not a specification a reader can code (2:40). The 15- and 60-minute arrays, the nesting rule and the choice between the two are described by eye on a chart. The single worked example is one session, selected with the advantage of knowing the outcome, and he says in the earlier lessons of the same month that this material is hindsight study. There is no prospective test, no win rate, no risk framework and no performance record anywhere in the source, and no third-party indicator, replay tool or template built on these concepts is tested here. Anyone who wants to use the framework needs their own objective definitions, out-of-sample evaluation and risk limits, and should treat every price reference above as the speaker’s own chart reading rather than verified market data.
He also flags the material’s limits himself: he says he will walk through a flowchart perspective on these scenarios and how to trade them in a plan format only in the August top-down analysis PDF, so what this lesson provides is the shape of the profiles rather than a completed trading plan (20:28).
Watch the original lesson
This article draws on the timestamped English captions of “ICT Mentorship Core Content – Month 10 – Index Futures – Index Trade Setups”, a recording made for the June 2017 release and published on YouTube on 20 October 2022, listed at about 21 minutes. Captions are a source for the speaker’s words; they cannot verify chart prices, fills or outcomes, and the reviewer read captions rather than watching the charts.
Watch the original lesson on YouTube
This lesson cannot be played inside another website. When its embedded player was loaded from a BestProps origin and clicked on 15 September 2026, the player itself reported “Video unavailable” and “Playback on other websites has been disabled by the video owner.” at both desktop and mobile widths, with no duration reported and no playback progress. That is why no embed is used here. The video is public on YouTube and plays normally on its own watch page.
Watch “ICT Mentorship Core Content – Month 10 – Index Futures – Index Trade Setups” on YouTube ↗
Resources
These are the sources checked for this article. The publisher’s own pages are the first-party record of what ICT releases; the CFTC pages are neutral U.S. regulatory references for futures markets and for how marketed trading systems and hypothetical results are presented to the public. None of them assesses the speaker, verifies a chart level or a reported session in the recording, or tests the framework. Any ICT, smart-money or third-party indicator, replay tool, note set, script or re-upload circulating outside the publisher’s own pages, and any tool built on these concepts, is unofficial and untested here.
- [1] ICT Mentorship Core Content – Month 10 – Index Futures – Index Trade Setups — The Inner Circle Trader (primary source; watch page read 15 September 2026, listed at about 21 minutes)
- [2] The Inner Circle Trader — official YouTube channel (read 15 September 2026)
- [3] CFTC — Fraud Advisory: Commodity Trading Systems Sold on the Internet (read 15 September 2026) — background on how marketed systems and hypothetical results reach the public.
- [4] CFTC — Learning Resources: Fraud Advisories and Articles (read 15 September 2026) — the regulator’s index of advisories covering trading systems, performance claims and market risk.
This is independent educational commentary on one speaker’s own session framework. It is not official ICT material, it is not a tested trading system and it is not investment advice. Nothing here is a recommendation to trade index futures. Leveraged futures trading carries substantial risk of loss.