
Key takeaways
ICT Mentorship Core Content Month 10 presents a time-of-day framework for index futures trading that defines the PM trend as roughly 1 p.m.
Read the full summary
ICT Mentorship Core Content Month 10 presents a time-of-day framework for index futures trading that defines the PM trend as roughly 1 p.m. to 4 p.m. New York time, with the move often beginning around 2 p.m. and special focus on the final hour from 3 p.m. to 4 p.m. The lesson opens with an explicit disclaimer that the speaker is not a licensed CTA, is not giving commodity trade advice, and that everything discussed is informational and to be viewed as paper trading only. The model classifies afternoon action as either continuation of the morning direction or an intraday reversal, treats New York lunch as a flexible transition that may span noon to 1 p.m. or extend from about 11 a.m. to 2 p.m., and uses morning highs, lows, order blocks and rejection blocks to frame possible afternoon moves. For the PM version of index SMT divergence, the comparison uses the relative highs and lows formed between noon and 3 p.m. New York time; in the featured bullish example the Nasdaq makes a lower low while the E-mini S&P and Dow form higher lows, which he reads as relative strength in the latter two. Charts in the recording are on Central time, so a displayed 2 p.m. bar corresponds to 3 p.m. New York time. The lesson proposes that the final hour may form the opposite end of the daily range from the morning, but provides no controlled performance testing, verified fills, or evidence that these tendencies reliably predict outcomes.
How we researched this article
BestProps used document-based research from primary firm sources, checked September 24, 2026. The complete source list, scope, limitations, and commercial-state record appear near the end of this article.
ICT Mentorship Core Content – Month 10 – Index Futures – PM Trend runs about 13 minutes 9 seconds. He introduces it as lesson three of the June 2017 ICT index trading content, while the watch page gives an upload time of 19 October 2022 — the recording is a re-release of older mentorship material. This article is built from the recording’s full 309-segment auto-generated English caption track rather than from its title or description, and the timestamp links below let you compare each point with what was actually said.
In the lesson, ICT presents a framework for studying index-futures behavior after the New York lunch period. He separates the afternoon from the morning session, describes continuation and reversal scenarios, and introduces a comparison among E-mini S&P 500, Dow and Nasdaq futures. The auto-generated captions misrecognize a few terms — “order flow” appears as “overflow” and “turtle soup” as “turtle suit” — and some spoken time references are garbled, so the window is confirmed from the passages where he states it plainly.
He also opens with a disclaimer worth stating plainly. At 0:01 he says the material is a commodity issue, that he is not a licensed CTA, that he is not giving commodity trade advice, and that everything discussed is for informational purposes only and should be viewed in light of paper trading only. That framing is his, and is repeated here rather than dropped, because the examples that follow depend on charts shown in the video, so the transcript alone cannot verify their exact prices, entries, fills, or later results.
How ICT Defines the PM Trend
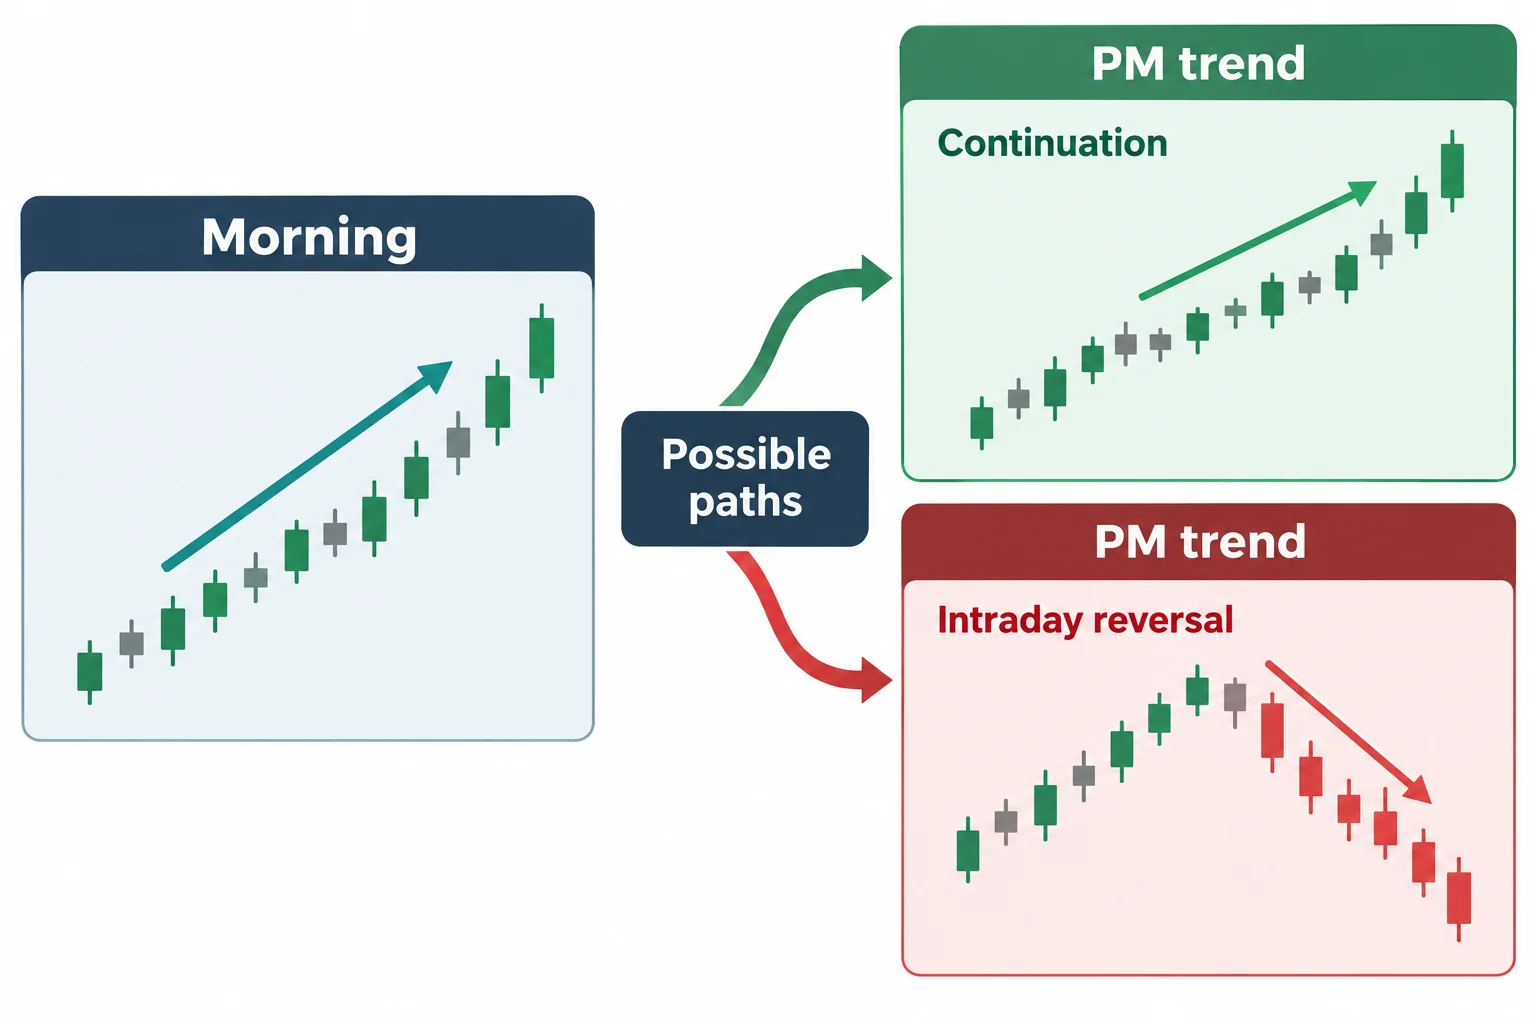
ICT introduces the afternoon session at 0:34 as the North American afternoon, typically after the noon New York lunch hour. He defines the main PM trend window at 1:28 as approximately 1:00 p.m. to 4:00 p.m. New York time, and describes a trend or price swing that he says occurs daily inside it. He also states at 1:15 that the true day high or low tends to form between 3:00 p.m. and 4:00 p.m. New York time — typically the last hour.
Within this framework, the afternoon can take one of two broad forms, which he sets out at 1:43: continuation of the morning direction, or an intraday reversal going into the close. He adds that measured moves in the afternoon tend to be faster than those seen in the morning session.
On timing, ICT says activity can begin as early as 1:00 p.m. New York time but that around 2:00 p.m. it generally starts to heat up and the session begins moving toward the close. He places particular emphasis on the final hour, from 3:00 p.m. to 4:00 p.m., as a period in which the opposite end of the day’s range may form. These are ICT’s stated tendencies rather than guaranteed timing rules, and the transcript does not quantify how often they hold.
How Lunch Shapes the ICT Afternoon Session
At 2:39, ICT explains that “New York lunch hour” is shorthand rather than a rigid block. Noon to 1:00 p.m. is the general reference, but he says lunch can start as early as 11:00 a.m. and run as late as 2:00 p.m. depending on the current market environment.
His reasoning is that a fast morning tends to see traders work through lunch, so only short periods of consolidation or retracement appear. When the morning session was lethargic, what he calls the full lunch hour — 11:00 a.m. to 1:00 p.m., or even to 2:00 p.m. — can show up, though he notes that does not happen often. The practical point is to expect some measure of consolidation or retracement around noon to 1:00 p.m. New York time, and to treat lunch as a contextual transition rather than proof that price must stay range-bound at exact clock times.
How Morning Structure Guides the ICT PM Trend
At 3:34 he begins working through chart examples, describing them as the same slides from the morning session presented in greater detail. In the first E-mini S&P example the afternoon drops into an order block formed during the morning session, then trades off that bullish order block and up to the day’s high, which he places in the last trading hour going into the close.
Another example shows price trading down into a bullish order block from the morning session and rallying into a rejection block. He notes that indices often do not move much — mostly small consolidation and expansion — with occasional large-range days, and reports that in that instance price moved almost 400 points in the afternoon session. A further E-mini S&P example at 5:46 has a large raid candle violating the previous session’s rejection block, followed by an accumulation phase he describes as a rally of about 18 handles.
He then repeats the exercise for Dow E-mini futures at 6:09, describing the afternoon creating a reversal through rejection of a previous high, and for Nasdaq E-mini futures at 6:39, where price trades into an order block formed during the lunch hour and then up into a rejection block from the morning session, in that case about nine handles into the close.
Terms such as “order block” and “rejection block” belong to ICT’s methodology. In this lesson they function as labeled areas of prior price action that he treats as possible support, resistance or reaction zones; the transcript provides no objective testing of those concepts, and the handle and point figures are his own readings of his charts rather than independently sourced data.
Comparing Index Futures in the ICT PM Trend
At 7:26, ICT applies what he calls index SMT divergence to the PM session, saying the same approach shown for the morning also applies in the afternoon. One detail matters here: for the PM version he says he is looking at the relative highs and lows between noon and 3:00 p.m. New York time, which is a different window from the 1:00 p.m. to 4:00 p.m. PM trend itself.
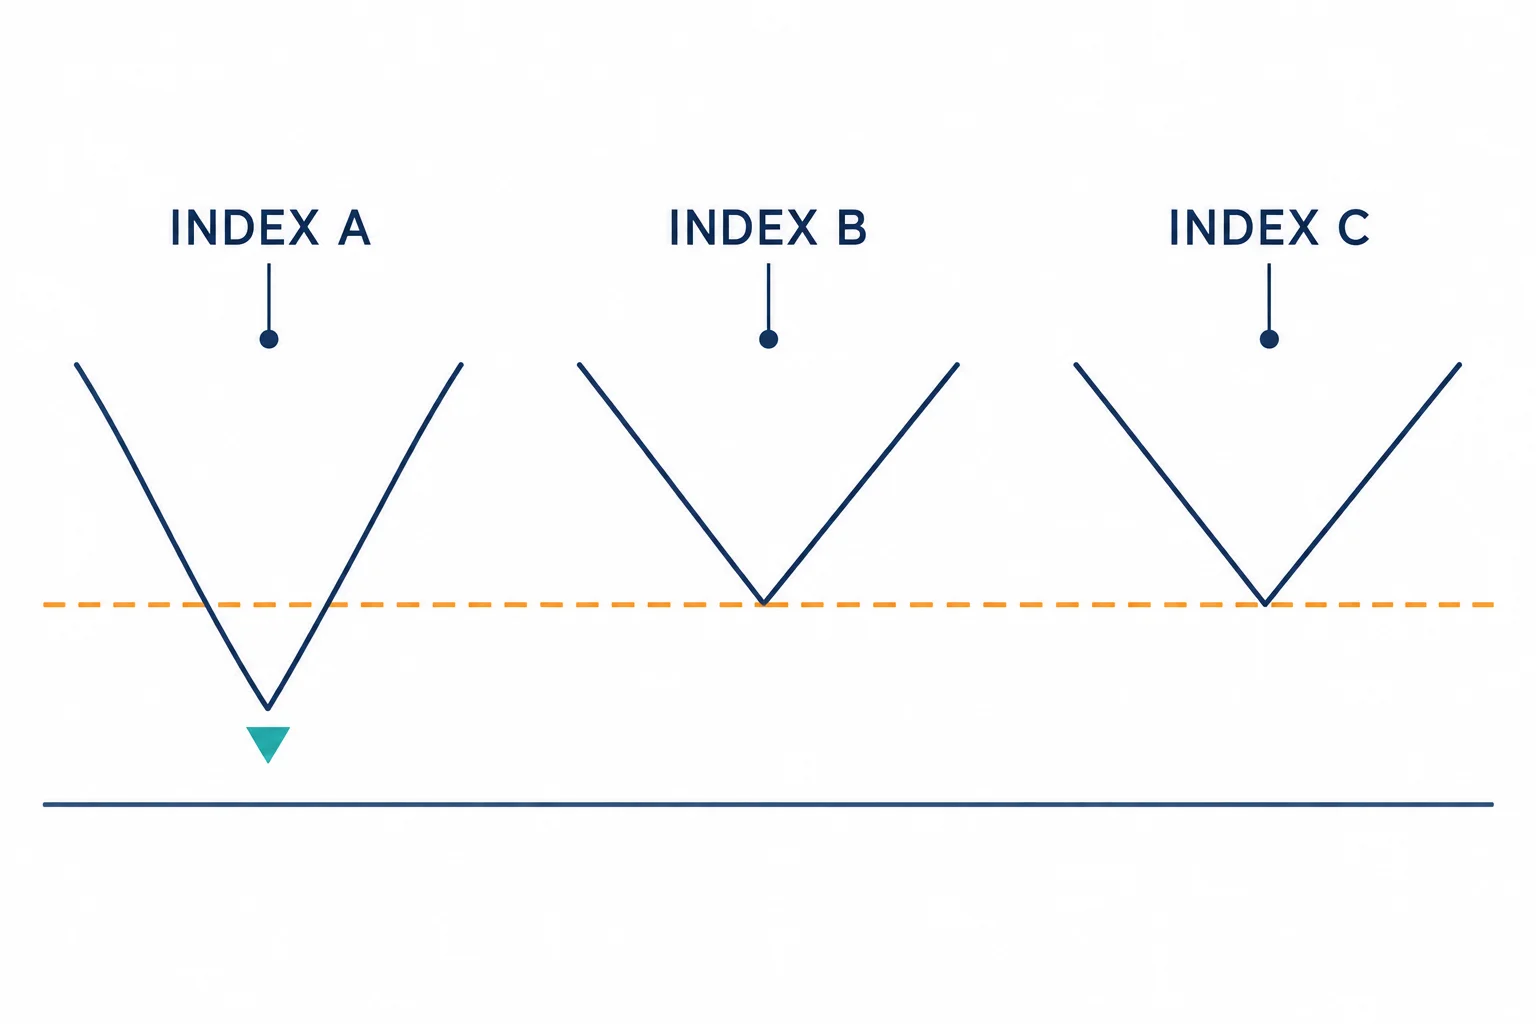
He compares three markets — E-mini S&P 500, Dow futures and Nasdaq futures. When institutional order flow is bullish he looks at the lows, and if one index fails to confirm a lower low while the other two do not, he treats that as bullish. When flow is bearish he compares relative highs: if all three would be moving higher and one fails to post a higher high, he deems that bearish.
In the featured example he says the E-mini S&P formed a higher low during the afternoon and the Dow futures also showed a higher low, but the Nasdaq futures contract made a lower low. Normally he would expect the Nasdaq to create a higher low as well for a symmetrical market, which would be confirmation. Instead he reads the outcome at 9:27 as accumulation in the Dow and the S&P that is not seen in the Nasdaq, describing the Nasdaq as the lethargic sister of the three while the Dow and E-mini S&P showed relative strength by failing to make a lower low.
Two practical notes follow. At 9:54 he points out that a 2:00 p.m. bar on the displayed chart is equivalent to 3:00 p.m. New York time because the chart uses Central, or Chicago, time — anyone reviewing the lesson should verify a chart’s time zone before marking session windows. And at 10:11 he says he uses these divergences to signal trades in the E-mini S&P rather than trying to trade the Dow or the Nasdaq futures, focusing on the disagreement among the three to tell him whether upside or downside movement is likely in the S&P.
The Final Hour of the ICT Afternoon Session
ICT recaps the framework at 11:07: the morning characteristics, the quiet lunch period, and then the restart of activity with the PM session trend, which he says begins around 1:00 p.m. New York time and extends to the 4:00 p.m. close.
He connects the final hour to the morning at 11:34. The idea is that the opening range or first hour of trading typically creates one end of the day’s range, so the last hour — 3:00 p.m. to 4:00 p.m. New York time — will generally create the opposite end. If a low formed in the morning, the day was strong, and lunch showed no retracement, he treats a PM trend pointing higher as reason for confidence that trades taken in the morning’s direction will continue into the last hour. He ties the timing to the bond market closing at 3:00 p.m. New York time, saying that is usually when the market makes its high or low relative to what was seen in the morning: a morning low implies a last-hour high, and a morning high implies continued downside into a last-hour low that runs to the 4:00 p.m. close.
He closes at 12:51 by saying these pieces will be blended into a cohesive trading plan, with the next lesson covering how to pick targets once you know which session you are trading.
Key ICT Index Futures Trend Takeaways
The lesson is best understood as a time-of-day organization method. It asks students to separate the morning, lunch transition and afternoon; determine whether the PM move is continuing or reversing the AM move; compare related index futures for non-confirmation; confirm that all chart times are aligned with New York time; and treat the final hour as a possible location for the opposite end of the range.
None of those observations removes market uncertainty. The transcript cannot establish how consistently the patterns occur, the handle and point figures are read off the speaker’s own charts, and the video supplies no controlled performance test, entries, stops, position sizing or account results. The material should therefore be treated as commentary on ICT’s framework rather than investment advice or a promise of trading performance. Futures and commodities trading carries substantial risk, and the recording’s own disclaimer frames the content as informational and suitable only for paper-trade study.
Watch the original recording
Watch the original lesson on YouTube
This recording cannot be played inside another website. Its embedded player was loaded from a BestProps origin and clicked on 15 September 2026 at both desktop and mobile widths: it reported “Video unavailable” and “Playback on other websites has been disabled by the video owner”, the video element never advanced past readyState 0, and no duration or playback progress was available. The recording’s own watch-page data agrees, reporting the video as not playable in an embed, so no iframe is placed here. The video itself is public and available directly on YouTube.
Watch ICT Mentorship – Index Futures – PM Trend on YouTube ↗
Source and further reading
- ICT Mentorship Core Content – Month 10 – Index Futures – PM Trend — the primary source for this article. Every described window, preference and reported move above comes from this recording’s caption track; use the timestamp links to compare each point with what was actually said, and note the caption errors flagged in the text.
- The Inner Circle Trader YouTube channel — the publisher’s own channel, where this mentorship month and the lessons it refers back to are posted. Unofficial reuploads and third-party summaries are not the source used here.
- CFTC — Learning Resources and fraud advisories — the US derivatives regulator’s consumer protection material for futures and options, including how to check whether a firm or individual is registered. Directly relevant to the recording’s own opening statement that the speaker is not a licensed CTA. Regulator education material; it does not assess this presenter’s method.
- CFTC — Fraud Advisory: Commodity Trading Systems Sold on the Internet — the regulator’s warning about systems and advisory services that promote signals based on technical analysis without disclosing the limits of their testing. Useful independent context for reading any futures methodology, including this one, with appropriate scepticism.
BestProps is not affiliated with the Inner Circle Trader or the CFTC, and no source listed here endorses this article. “Order block”, “rejection block”, “institutional order flow”, SMT divergence and smart money are used as descriptive terms for what the recording teaches, not as established market mechanics. The point, handle and “400 points” figures are the speaker’s own readings of his charts, and the caption track contains no fills, position sizes, account data or independently verified results. Session timing, index behaviour and the relationship between markets can change, and past price behaviour does not indicate future results. Futures trading involves substantial risk of loss. This is independent educational commentary, not official ICT material, not a tested trading system and not investment advice.