
Key takeaways
ICT Mentorship Core Content Month 05 Trade Conditions & Setup Progressions is a roughly 28 minutes 18 seconds YouTube lesson from The Inner Circle Trader that uses USD/JPY and the Japanese yen cash market to explain a top-down setup hierarchy rather than a complete trading system.
Read the full summary
ICT Mentorship Core Content Month 05 Trade Conditions & Setup Progressions is a roughly 28 minutes 18 seconds YouTube lesson from The Inner Circle Trader that uses USD/JPY and the Japanese yen cash market to explain a top-down setup hierarchy rather than a complete trading system. Monthly structure establishes direction and the dealing range, weekly charts refine support and objectives, and daily charts study setup formation. A bullish idea starts from a bullish PD array in discount and targets premium arrays overhead, while the bearish case reverses the logic. PD arrays include mitigation blocks, breakers, liquidity voids, fair value gaps, order blocks, rejection blocks, and old highs or lows. Equilibrium, the midpoint of the recent range, is an initial rebalancing reference but not an automatic trade because direction must come from monthly market structure. Yen cash weakness should correspond to USD/JPY strength, all else equal, due to inverse quotation. The core escalation rule is that failure of a daily bullish array sends analysis to the next relevant weekly array, and failure there sends it to the monthly chart rather than automatically invalidating the higher-timeframe thesis. Published 16 September 2022 as a January 2017 mentorship recording, the lesson provides conditions, objectives, and timeframe progression but no entries, stops, position sizes, fills, risk parameters, or trade results, and its framework is not independently validated.
How we researched this article
BestProps used document-based research from primary firm sources, checked September 24, 2026. The complete source list, scope, limitations, and commercial-state record appear near the end of this article.
In ICT Mentorship Core Content – Month 05 – Trade Conditions & Setup Progressions, ICT explains how he organizes a trade idea from monthly context down through weekly and daily charts. The lesson uses USD/JPY and the Japanese yen cash market as a historical example, but its central subject is the progression of a setup: identify whether price is in premium or discount, map potential objectives, and know where to look if a lower-timeframe level fails.
This is a summary of ICT’s market interpretation and terminology, not independent proof that the framework predicts prices or produces profitable trades.
ICT Trade Setup Conditions for Premium and Discount
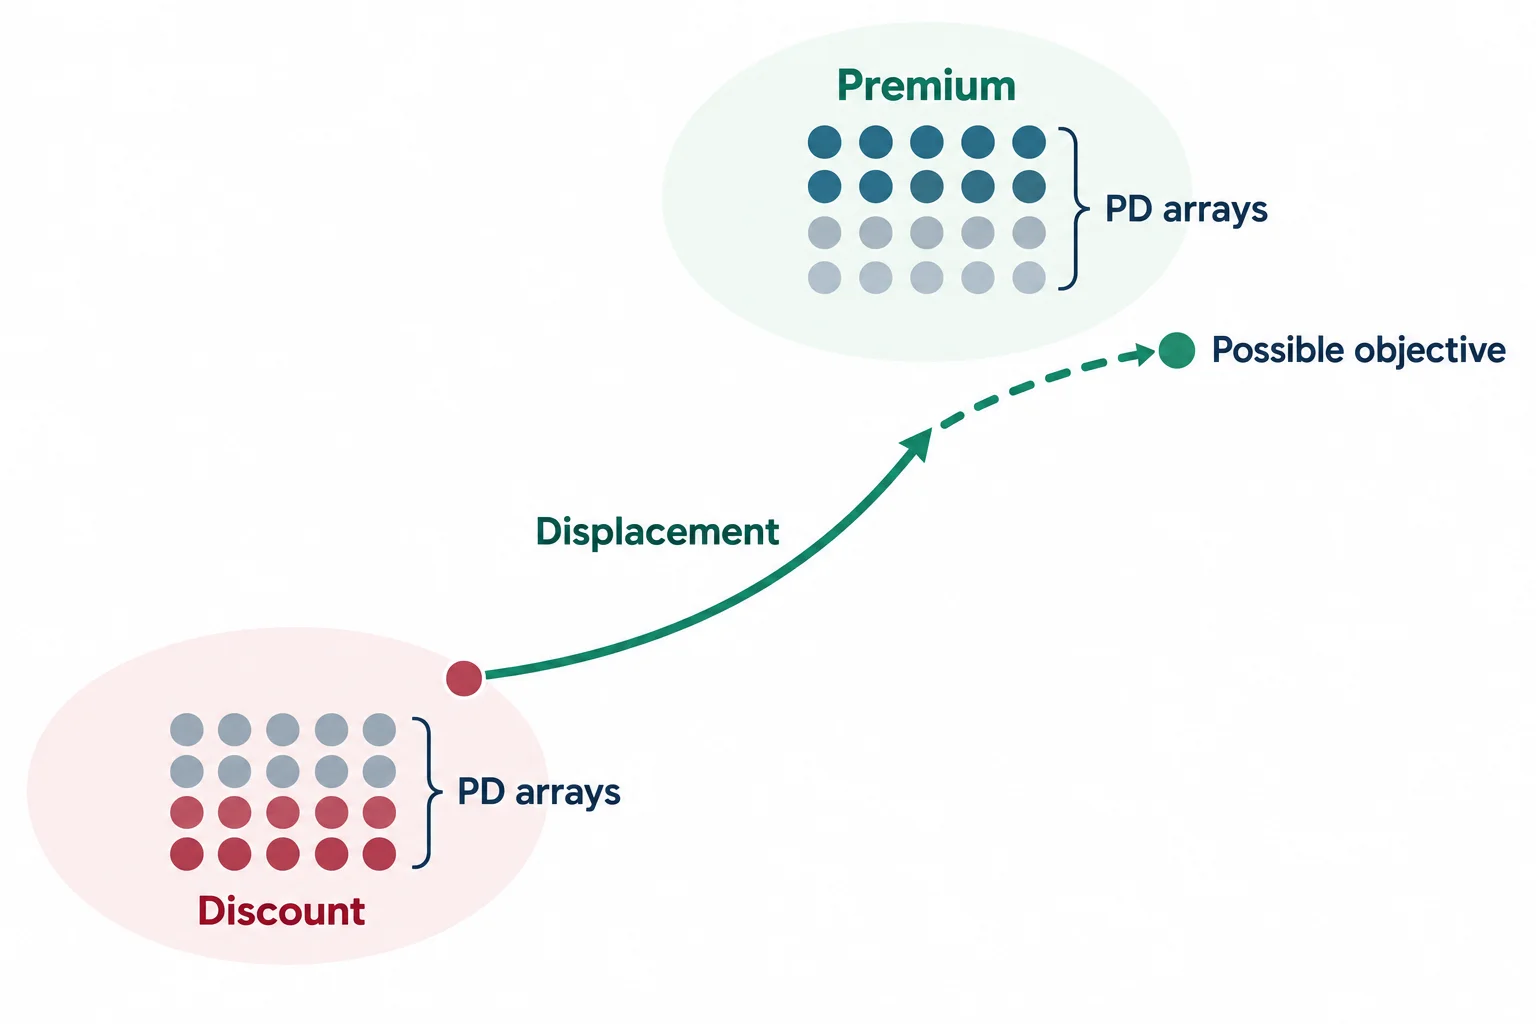
ICT opens by framing the example as a potential move from a deep discount toward a future premium. At 0:53, he says the process begins with a directional expectation derived from monthly, weekly, and daily context. In the bullish example, the analyst looks for a displacement away from discount and toward one or more premium objectives.
He lists several concepts that he calls PD arrays, including mitigation blocks, breakers, liquidity voids, fair value gaps, order blocks, rejection blocks, and old highs or lows. Under his framework, a bullish array in discount may supply a candidate entry area, while an opposing array in premium may act as an objective. The bearish progression reverses that logic: look for a bearish array in premium and a bullish array in discount as a possible covering objective.
ICT Trade Conditions Around Equilibrium
At 3:52, ICT introduces equilibrium (the midpoint of the relevant recent range) as an initial rebalancing reference. He argues that a market at an extreme premium or discount may first return toward that midpoint even if it never reaches the opposite extreme.
He also cautions against treating equilibrium as an automatic entry signal. Around 4:59, he says price near the middle of a range could expand in either direction. His proposed directional filter is the surrounding monthly market structure rather than an indiscriminate trade from the midpoint.
How Currency Quotations Affect an ICT Trade Setup
The chart walkthrough begins with the Japanese yen cash price and then switches to USD/JPY. At 6:41, ICT explains that the two should move in opposite directions for this comparison: weakness in the yen corresponds to strength in USD/JPY, all else equal. This prevents a directional reading from being carried from one chart to the other without accounting for how the currency pair is quoted.
Map the Monthly Timeframe Before Refining the ICT Setup
On the monthly USD/JPY chart, ICT identifies a range with a premium side and a discount side. He interprets equal lows as an area where sell stops may be resting and consecutive down candles before an advance as a bullish order block. He then describes a monthly rejection block and a breaker while building a hierarchy of possible support and objective areas.
The important educational point is the sequence rather than any unseen chart coordinate:
- Define the long-term dealing range.
- Classify the current area as premium, discount, or equilibrium.
- Mark relevant monthly PD arrays.
- Identify opposing arrays that could serve as progressive objectives.
- Move to the weekly chart for greater detail without abandoning the monthly context.
Use the Weekly Timeframe to Refine the ICT Setup
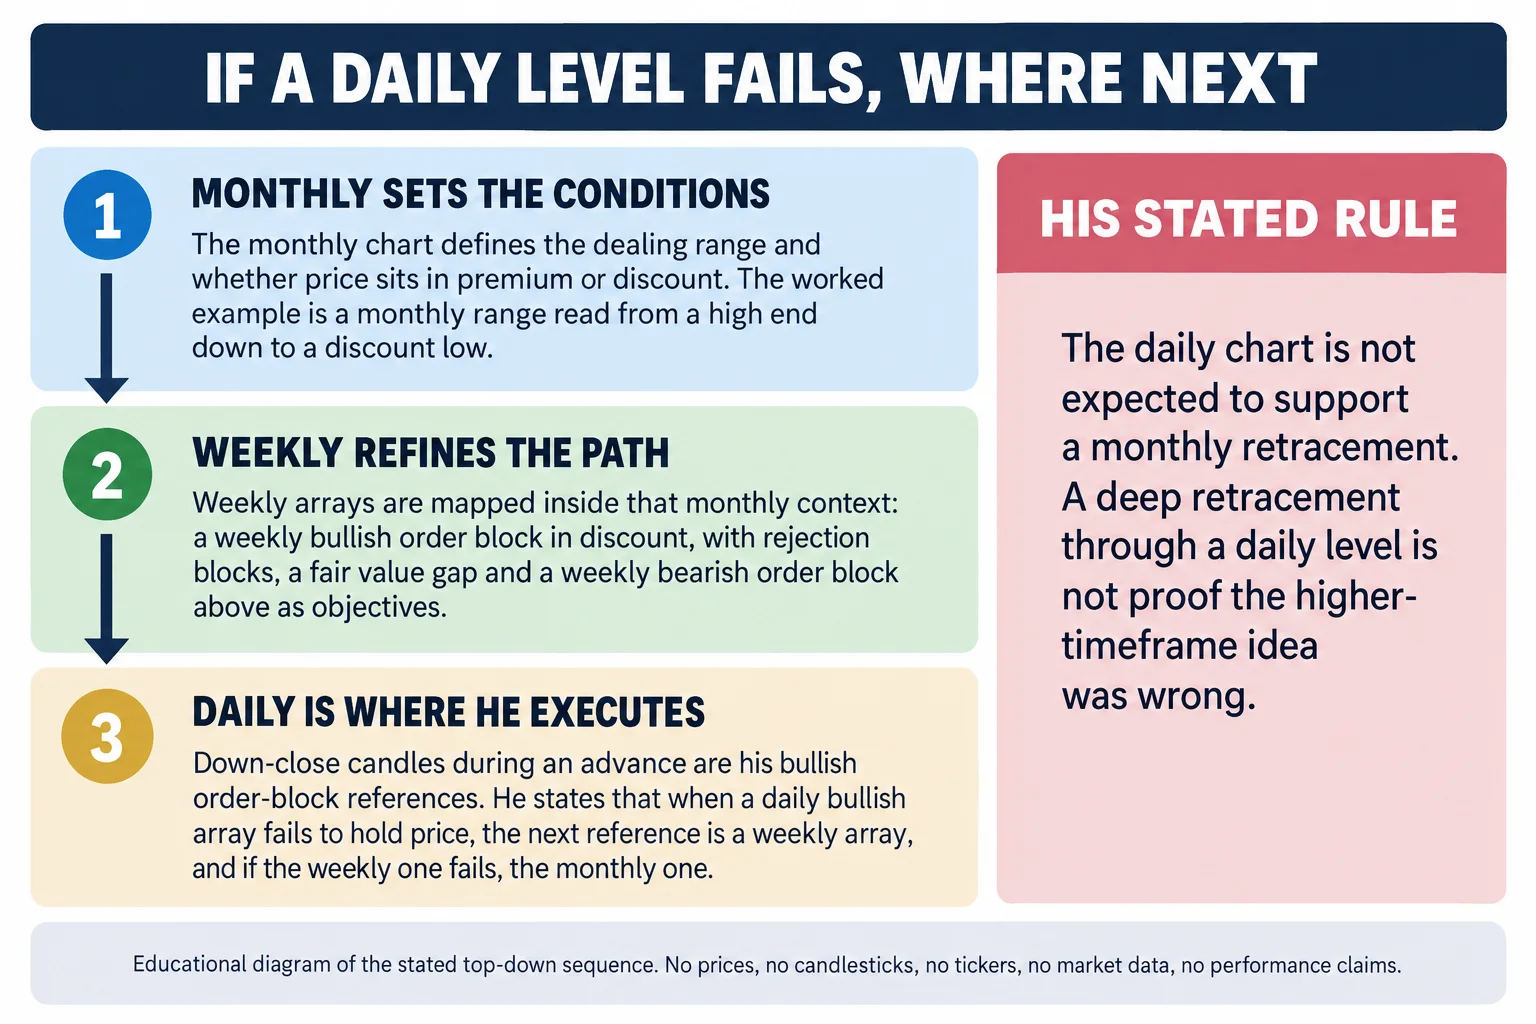
At 11:17, the lesson shifts to the weekly chart. ICT describes price revisiting what he classifies as a weekly bullish order block while the broader range remains in discount. Above price, he maps a series of candidate objectives, including rejection-block areas, a fair value gap, and a weekly bearish order block.
This produces a setup progression rather than one all-or-nothing target. Under ICT’s interpretation, a trader could evaluate intermediate premium areas within smaller ranges while still tracking a larger higher-timeframe objective. The transcript does not establish actual entries, fills, risk parameters, or the result of any hypothetical trade.
Keep Daily Trade Setups Aligned With Higher Timeframes
ICT carries the weekly levels onto a daily chart at 14:54. He focuses on down-close candles during an advance as potential bullish order-block references. In his framework, these daily areas can help refine an entry or continuation idea, but they do not override monthly and weekly structure.
The lesson’s main rule appears around 18:46: if a daily bullish PD array fails to support price, inspect the next relevant weekly array. If weekly structure does not explain the move, expand to the monthly chart. ICT’s point is that a deep retracement through a daily level may still be consistent with a higher-timeframe idea.
Build an ICT Trade Setup Study Workflow
A neutral way to turn the lesson into a chart-review exercise is:
- Mark the monthly range and directional structure.
- Record monthly premium, discount, and equilibrium.
- Add only the weekly arrays relevant to the proposed direction.
- List objectives in the order price might encounter them.
- Use the daily chart to study reactions and setup formation.
- If a daily level breaks, reassess the weekly context instead of assuming the original thesis remains valid.
- Define invalidation and risk separately; those subjects are not fully specified in this transcript.
Near 25:05, ICT emphasizes that merely copying higher-timeframe horizontal levels onto a daily chart is not the complete lesson. The intended progression is to understand which timeframe may contain the next relevant reference when a nearer level is no longer holding.
Key ICT Trade Setup Takeaways
The video presents a top-down hierarchy: monthly charts establish broad conditions, weekly charts refine structural reference points, and daily charts help study execution. ICT interprets failed daily levels as a reason to consult weekly and then monthly arrays. That hierarchy is the defining feature of the setup progression described here, not any single order block, gap, or price level.
Watch the ICT Trade Setup Lesson
ICT Mentorship Core Content – Month 05 – Trade Conditions & Setup Progressions
The Inner Circle Trader · published 16 September 2022 · about 28 minutes 18 seconds. This recording is the primary source for every timestamp link above.
The recording is not embedded here because the video owner has disabled playback on other websites. That was tested directly on 15 September 2026 from a BestProps page origin at both desktop and mobile widths: the embedded player frame loads, then reports “Playback on other websites has been disabled by the video owner” with no duration and no playback progress, while the recording itself plays normally on YouTube. No empty or half-working player is left on this page.
The watch page was read on 15 September 2026 and is publicly listed as ICT Mentorship Core Content – Month 05 – Trade Conditions & Setup Progressions by The Inner Circle Trader: upload date 16 September 2022, not private and not unlisted, with the player reporting a length of 1,698 seconds, about 28 minutes 18 seconds. The audio used for this article runs to 1,698.3 seconds, so the transcription and the listed length agree. Inside the recording he identifies the session as lesson 6.2 of the January 2017 mentorship and opens by recapping a “1,200 pip move” he had referenced in an earlier money-management lesson (0:17, 0:35). Note the two different dates in play: the recording belongs to the January 2017 mentorship run, while the YouTube upload is dated 16 September 2022 and the channel title labels it Month 05 of the core content series. The title, the upload date and the date spoken in the lesson are three separate things here, and this article does not treat them as one.
ICT Trade Setup Framework Resources
These are the sources checked for this article. The regulator and investor-education pages are general material about leveraged foreign-exchange trading and about how trading systems and advisory services sold to the public should be assessed; none of them evaluates this speaker, and none verifies any premium or discount reading, PD array mapping, order block, gap or level described above. Every ICT term, PD array label and chart reading in this article is the speaker’s own framework as stated in the recording, not an independently measured fact. Any ICT, smart-money or third-party indicator, script, note set, chart annotation, transcript pack or re-upload circulating outside the publishing channel’s own page is unofficial and has not been tested here.
- [1] ICT Mentorship Core Content – Month 05 – Trade Conditions & Setup Progressions The Inner Circle Trader (primary source; watch page read 15 September 2026, listed length 1,698 seconds, about 189,600 views at the time of reading).
- [2] The Inner Circle Trader (official YouTube channel) (read 15 September 2026), the publishing channel for the mentorship series used here.
- [3] CFTC (Fraud Advisory: Foreign Currency (Forex) Fraud) (read 15 September 2026), the regulator’s warning that the forex market is volatile and carries substantial risks, and its list of persuasion tactics used in forex sales pitches.
- [4] Investor.gov (SEC) (Day Trading) (read 15 September 2026), investor education stating that day trading is extremely risky and can result in substantial financial losses in a very short period, relevant background to reading a higher-timeframe framework as study material rather than trade instruction.
Source: ICT, ICT Mentorship Core Content – Month 05 – Trade Conditions & Setup Progressions, The Inner Circle Trader, uploaded 16 September 2022. The transcript used was automatic local speech-to-text of the recording’s full audio (Whisper large-v3-turbo), not human-verified captions; the integrity checks passed with no low-confidence segments flagged. Because it is machine transcription, the specific price figures spoken during the chart walkthrough are not reproduced above: the audio renders several of them ambiguously, and no level, fill, order, position size or result has been invented to fill that gap. The article describes the sequence and the terminology he states, and attributes the interpretation to him throughout. This commentary is educational and is not investment advice or a recommendation to copy any trade.