
Key takeaways
ICT’s propulsion block extends the order block framework by treating a newer candle that revisits an established order block as a sensitive reference for a later, rapid reaction.
Read the full summary
ICT’s propulsion block extends the order block framework by treating a newer candle that revisits an established order block as a sensitive reference for a later, rapid reaction. In bullish conditions, a down-closing candle trades into a prior bullish order block and should act as support on a retest, often near its high, while the bearish version uses an up-closing candle interacting with a prior bearish order block and may react near its low. The mean threshold is the midpoint of the candle body and serves as ICT’s invalidation reference, with decisive penetration weakening the setup, although price need not reach the midpoint before reacting. The model requires directional alignment, interaction with an older order block, and fast responsiveness with limited body penetration, but the lesson provides no objective market selection, test results, position sizing, verified edge, or complete mechanical strategy, so its chart outcomes and continuation claims should be treated as ICT’s interpretation rather than guaranteed performance.
How we researched this article
BestProps used document-based research from primary firm sources, checked September 24, 2026. The complete source list, scope, limitations, and commercial-state record appear near the end of this article.
In ICT Mentorship Core Content – Month 04 – ICT Propulsion Block, ICT extends his order-block framework with what he calls a propulsion block. The lesson presents it as a candle formed when price revisits an existing order block and subsequently becomes a sensitive reference area itself.
This article summarizes ICT’s interpretation of the pattern. It does not establish that propulsion blocks provide a tested trading edge, and the transcript alone cannot verify the chart markings, entries, fills, or later outcomes shown on screen.
What Is an ICT Propulsion Block?
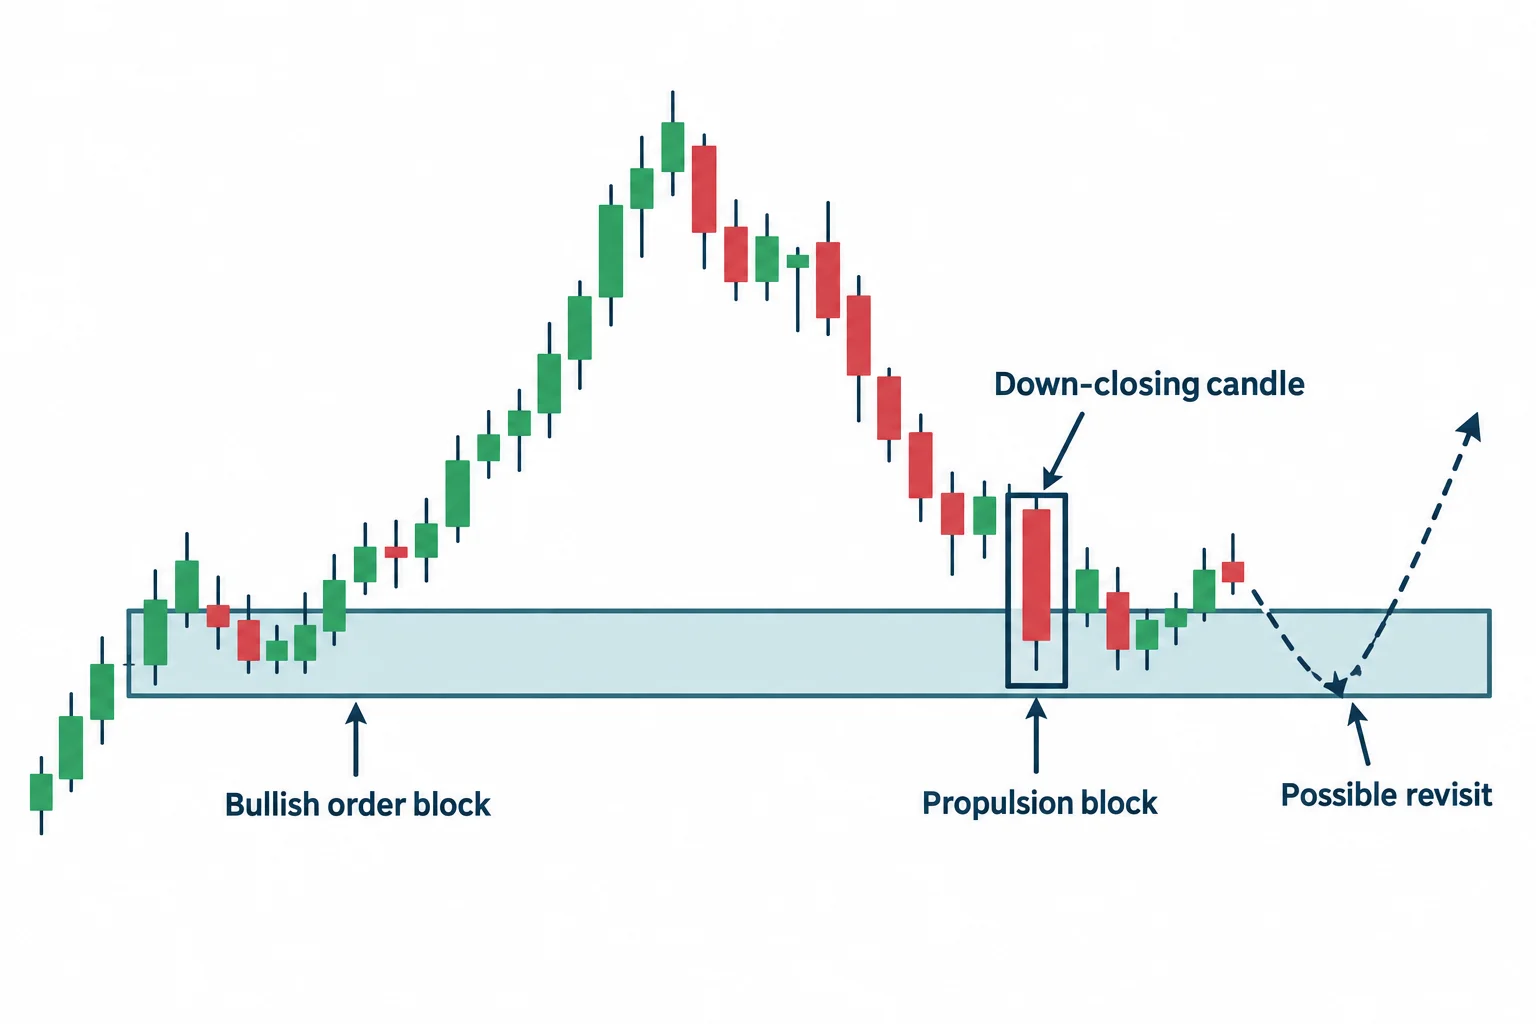
ICT introduces the concept at 0:25. In the bullish version, he describes a down-closing candle that trades into an earlier bullish order block. That newer candle then assumes a support-like role within the bullish narrative.
The important feature is therefore not simply the candle’s direction. The proposed sequence is:
- An earlier order block has already been identified.
- Price trades back into that area.
- A new candle forms while interacting with the earlier block.
- That newer candle becomes the propulsion block.
- A later revisit is expected, in ICT’s framework, to produce a quick reaction.
ICT’s explanation depends heavily on directional context. A down-closing candle is treated as potentially bullish only when it interacts with a bullish order block inside what he considers bullish price conditions. The bearish construction reverses those relationships. He also names the pattern for its behaviour rather than its shape: at 7:22 he says the candle is called propulsion because it propels price quickly and suddenly and gives immediate feedback.
ICT Propulsion Block Mean Threshold
At 1:18, ICT calls the new block “highly sensitive” and introduces its mean threshold. He defines it at 1:28 as half of the body’s height, or the middle of the range of that candle’s body. In this lesson, that term refers to the midpoint of the candle’s body, and he argues that a valid propulsion block generally should not allow price to move decisively through that midpoint.
ICT also says price may react from the near edge of the candle rather than reaching its midpoint. For a bullish block, he focuses on a revisit around the candle’s high; for a bearish block, he later discusses responsiveness around the candle’s low. These are ICT’s chart-reading expectations, not guaranteed behavior.
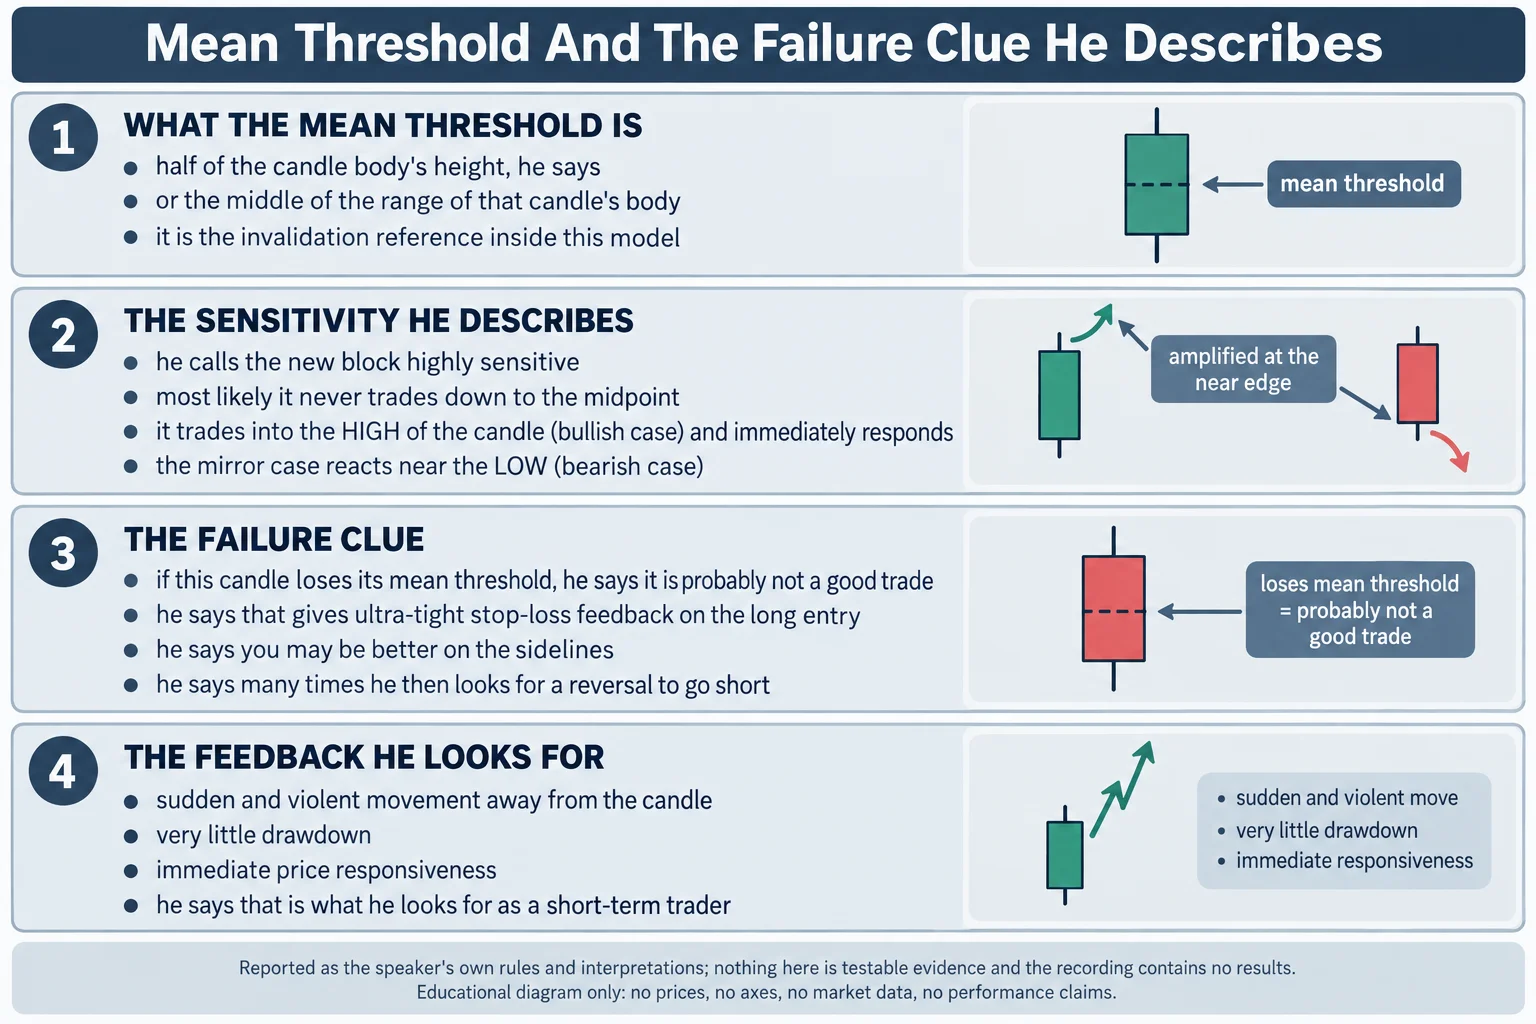
A practical educational takeaway is that the midpoint functions as an invalidation reference within the model. If price crosses it, ICT interprets that as immediate evidence that the anticipated reaction may be failing. Whether that rule is useful in live markets would require definitions, testing, and risk controls beyond this video.
Bullish ICT Propulsion Block Example
The bullish chart walkthrough begins at 2:19. ICT groups several consecutive down candles into one broader bullish order block. He then identifies another down-closing candle that trades into those earlier down candles while the surrounding move is interpreted as bullish.
At 3:54, he labels the newly closed candle as the propulsion candle. His reasoning is that it has revisited a previous bullish order block and is therefore expected to become a sensitive support reference on another return.
ICT then discusses a later candle trading back into that area and presents the reaction as a possible bullish entry within his model, narrating that candle’s open and low at the same figure, 133.45, as the audio renders it. That price is a single chart read he states on screen, transcribed here as spoken and not independently verified. He reiterates at 4:58 that the desired behavior is an immediate bullish response if the propulsion candle is revisited.
When a Bullish Block Fails
At 5:14, ICT gives what he calls the key clue: if a bullish propulsion candle loses its mean threshold, he considers the prospective long idea less attractive. He discusses using that feedback to abandon the setup or reassess directional bias.
This should be understood as ICT’s invalidation logic. A midpoint breach does not, by itself, prove that a reversal will occur or that a short position is appropriate.
Bearish ICT Propulsion Block Example
The bearish example starts at 5:40. ICT first frames a higher bearish order block. After price moves lower and then returns to that area, he identifies an up-closing candle as the bearish propulsion block.
He divides the candle at its body midpoint and describes price touching that mean threshold before moving lower. He also highlights a later revisit near the propulsion candle’s low. In both cases, the lesson emphasizes the speed of the response rather than prolonged movement inside the block.
At 7:05, ICT says the revisit does not necessarily need to reach the candle body’s midpoint; in his interpretation, contact with the candle’s low can be enough because the area should be unusually sensitive.
How to Interpret an ICT Propulsion Block
The central idea is that a propulsion block is a nested order-block concept: a newer candle interacts with an older order block and then becomes a reference for a possible future reaction. ICT looks for three characteristics:
- Alignment with an already established bullish or bearish context.
- Interaction between the new candle and a prior order block.
- Fast responsiveness on a later revisit, with limited penetration of the candle body.
The lesson does not provide a complete mechanical strategy. It does not define an objective market-selection process, test results, position sizing, or comprehensive rules for distinguishing valid examples from failed ones, and it states no completed trades. Because the source is a narrated chart lesson, viewers should consult the original video to see the visual relationships ICT is describing.
For study purposes, the most useful distinction is between the pattern’s structure and its claimed implication. The structure can be documented (prior order block, revisit, new candle, and subsequent retest), while the expectation of rapid continuation remains ICT’s market interpretation and should not be treated as a certainty or performance promise.
Watch The Original Recording
ICT Mentorship Core Content – Month 04 – ICT Propulsion Block
The Inner Circle Trader · watch page lists upload 8 September 2022 · 470 seconds, about 7 minutes 50 seconds; the lesson opens as part of the mentorship content for Month 04. This recording is the primary source for every timestamp link on this page.
The recording is not embedded here. An embedded player was tested directly on 15 September 2026 from a BestProps page origin at desktop and mobile widths: the frame loads and then reports “Playback on other websites has been disabled by the video owner”, with no duration and no playback progress, while the video itself plays normally on YouTube. No half-working player is left on this page.
The watch page was read on 15 September 2026 and is publicly listed as ICT Mentorship Core Content – Month 04 – ICT Propulsion Block by The Inner Circle Trader, with an upload timestamp of 8 September 2022, not private and not unlisted, and a listed duration of 470 seconds — about 7 minutes 50 seconds, against a transcribed audio duration of 469.3 seconds. The upload date and the Month 04 session the lesson belongs to are different dates; they are kept distinct here rather than presented as a contradiction.
Resources
These are the sources checked for this article. The regulator and investor-education pages are general material on assessing trading systems sold to the public and on short-term trading risk. None of them evaluates this speaker, and none of them verifies the propulsion-block construction, the mean threshold, the response behaviour or the chart read described above. Any ICT, smart-money or third-party indicator, script, note set, chart annotation, transcript pack or re-upload circulating outside the publishing channel’s own page is unofficial and has not been tested here.
- ICT Mentorship Core Content – Month 04 – ICT Propulsion Block — The Inner Circle Trader (primary source and the recording transcribed for this article; watch page read 15 September 2026, listed duration 470 seconds).
- The Inner Circle Trader — official YouTube channel (read 15 September 2026) — the publishing channel for the mentorship series this lesson belongs to.
- CFTC — Commodity Trading Systems Sold on the Internet (read 15 September 2026) — the regulator’s guidance on assessing trading systems sold to the public, including its warning that hypothetical results are typically simulations calculated over prices that occurred in the past.
- Investor.gov (U.S. SEC) — Day Trading (read 15 September 2026) — the regulator’s definition, which states that day trading is extremely risky and can result in substantial financial losses in a very short period of time. Relevant to a lesson built entirely on short-term responsiveness.
A Note On The Transcription
There was no usable caption track for this recording, so the transcript behind this article is an automatic speech-recognition pass over the full original audio, not human-verified captions and not YouTube’s own captions. The pass covered the complete audio, reported no low-confidence characters and a maximum level of -8.4 dB, and returned a duration of 469.3 seconds against the watch page’s listed 470 seconds. Because the text is machine-recognised, terms were checked against context rather than trusted as printed: where the audio renders “owner block” the surrounding lesson is about order blocks throughout, and the price figure “133.45” is quoted as the transcription produced it for both the open and the low of the same candle, which is left visible rather than silently corrected. The charts themselves were not available to this review; only the spoken description was.
Source: ICT, ICT Mentorship Core Content – Month 04 – ICT Propulsion Block, The Inner Circle Trader, 8 September 2022. Educational commentary, not investment advice. The construction, the mean threshold, the response behaviour and the failure rule are the speaker’s stated framework and interpretations, reported with no fills, no order sizes, no costs and no account results, and the chart levels he narrates were not independently verified.
