
Key takeaways
ICT Mentorship Core Content Month 03 Macro Economic To Micro Technical is the eighth November 2016 curriculum lesson from The Inner Circle Trader, presenting a daily-chart framework for a three-to-six-month currency outlook that moves from 30-year Treasury bond and 10-year Treasury note futures to interest-rate direction, the U.S.
Read the full summary
ICT Mentorship Core Content Month 03 Macro Economic To Micro Technical is the eighth November 2016 curriculum lesson from The Inner Circle Trader, presenting a daily-chart framework for a three-to-six-month currency outlook that moves from 30-year Treasury bond and 10-year Treasury note futures to interest-rate direction, the U.S. Dollar Index, and individual currency pairs. ICT interprets rising Treasury prices as falling rates and falling Treasury prices as rising rates, with higher U.S. rates potentially supporting USD, then looks for a quarterly shift every three to four months and SMT divergence between the 10-year and 30-year contracts or between Treasuries and the Dollar Index. A bullish dollar bias leads him to seek strength in dollar Swiss and dollar CAD and weakness in the euro, pound, Aussie, and New Zealand dollar, while dollar yen is also reviewed, with order blocks, old highs and lows, and stop areas used for micro technical context rather than complete entry, exit, sizing, or risk rules. His 2016 election example cites Dow Jones futures falling roughly 750 points before reversing and argues that unmatched moves across the dollar and debt markets left the longer-term rate thesis intact. The YouTube recording was uploaded on 3 September 2022, runs 1140 seconds, and is not embeddable because external playback is disabled. The article stresses that this is ICT’s interpretation, not a validated trading system, because it provides no dataset, tested signal, performance results, independently verified charts, or complete risk-management framework.
How we researched this article
BestProps used document-based research from primary firm sources, checked September 24, 2026. The complete source list, scope, limitations, and commercial-state record appear near the end of this article.
In ICT Mentorship Core Content – Month 03 – Macro Economic To Micro Technical, ICT presents a top-down framework for forming a three-to-six-month currency outlook. Rather than beginning with intraday charts or a large collection of economic reports, he starts with daily charts of U.S. Treasury futures and the Dollar Index. He then applies his technical concepts to individual currency pairs.
This lesson is best understood as ICT’s interpretation of intermarket relationships, not proof that the framework predicts markets reliably. The transcript documents the reasoning he described, but it cannot independently verify the charts, prices, prior forecasts, executions, or later outcomes discussed in the recording.
Macro Economic Starting Point
ICT introduces the lesson as a macro perspective rather than a day-trading method (0:47). He says the analysis does not require 15-minute, hourly, or four-hour charts, and that his focus here is the daily timeframe (1:01). His stated objective is to estimate the broad direction currencies may take over approximately three to six months (1:52).
The principal inputs in his framework are the 30-year U.S. Treasury bond futures market, the 10-year Treasury note futures market, and the U.S. Dollar Index. He explains that he reads Treasury price action as a visual representation of interest-rate expectations, which lets him avoid attempting to interpret every individual economic release or bank report (2:05, 3:56). He also says he does not trust bank reports to reveal their own intentions (1:32).
Bond Price and Interest Rate Relationship
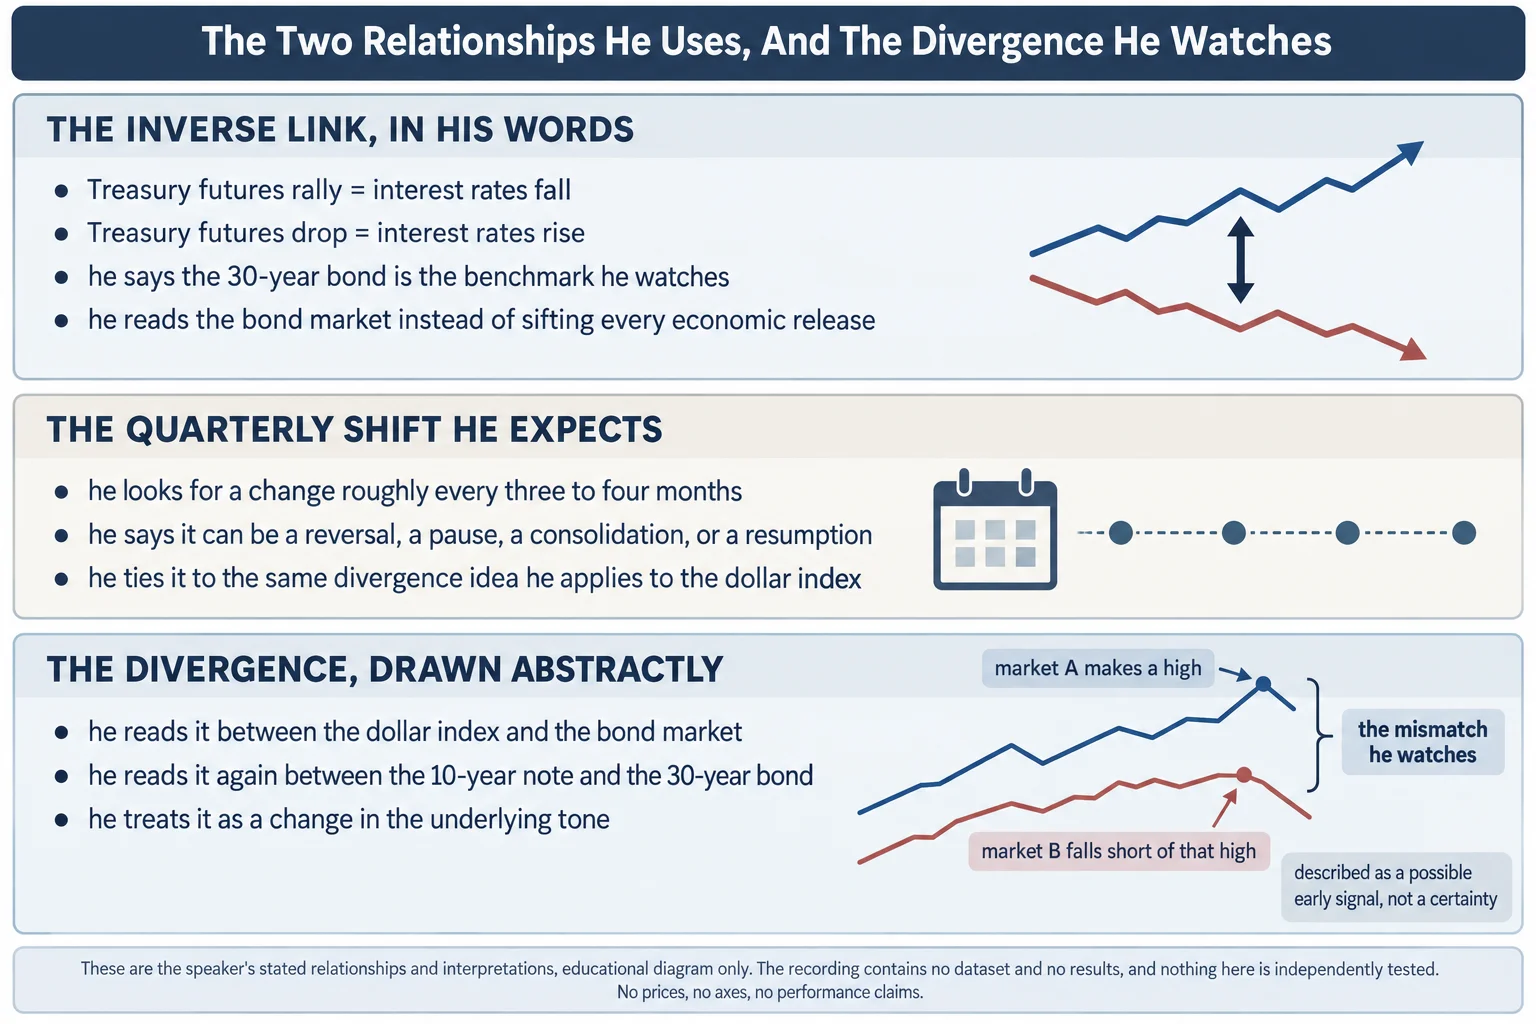
A necessary foundation for following the lesson is the inverse relationship ICT describes between Treasury futures prices and interest rates:
- When Treasury futures rise, ICT interprets that as falling interest rates.
- When Treasury futures fall, he interprets that as rising interest rates.
- In the examples taught here, he associates rising U.S. rates with potential demand for the dollar.
- He therefore looks for dollar strength when Treasury futures are weakening, subject to confirmation from his other chart concepts.
ICT lays out this chain of reasoning at 5:28, and restates the inverse link at 5:42. He also describes the 30-year Treasury bond as the benchmark behind U.S. mortgage rates (5:49). It is a simplified analytical model. Actual currency and Treasury markets can respond to many simultaneous influences, so the relationship should not be treated as mechanically predictive under all market conditions.
Macro Economic Shifts and Bond Dollar Divergence
ICT says he watches for a possible change in market condition every three to four months, which he calls a “quarterly shift” (2:33). In his description the shift might be a reversal, a consolidation, or a pause followed by continuation, not necessarily a clean change of trend on an exact calendar date (3:05).
He then combines that expectation with what he calls SMT divergence, an idea he says he applied to the dollar index and foreign currencies earlier in the month and now applies to an interest-rate divergence (7:00). The lesson first compares the Dollar Index with 30-year Treasury futures. He points to a week in late June in which the dollar index made a low and failed to make a lower low while the bond market made a higher high (6:38). He treats that mismatch as evidence of a potential underlying change.
Later, ICT compares the 10-year note with the 30-year bond (10:35). He directs attention to occasions when one Treasury maturity reportedly formed a higher high while the other did not (11:31). In his framework, this relative divergence can precede a decline in both Treasury contracts, implying higher rates and a potentially stronger dollar (11:47).
From Macro Economic Bias to Micro Technical Charts
After developing a broad dollar view, ICT checks whether individual currency pairs align with it. In the historical September examples beginning near 12:04, he reviews the Dollar Index and then works through the dollar pairs he names: dollar Swiss (12:37), dollar CAD (12:56), the euro (13:09), the pound (13:37), dollar yen (14:18), and then the Aussie and New Zealand dollar (14:59, 15:12).
He also explains the direction of the filter using the position of the dollar in the pair name: for pairs whose name starts with the dollar, he says he is looking for buyers (14:55), while the pair he calls New Zealand dollar is read for a sell-off and the Aussie is read the same way (14:59). The translation from macro to micro is straightforward in directional terms:
- If the dollar outlook is bullish, pairs with USD as the base currency (such as the dollar Swiss or dollar CAD he names) would generally be examined for bullish setups.
- Pairs with USD as the quote currency (such as the euro, the pound, the Aussie or the New Zealand dollar) would generally be examined for bearish setups.
- The macro view supplies a directional filter; it does not itself define an entry, stop, position size, or exit.
ICT explicitly characterizes the process as using macroeconomic principles (especially interest rates) and narrowing them into a “micro technical” perspective (14:40). Elsewhere in the lesson he overlays ICT-specific ideas such as order blocks, old highs and lows, and stop areas (7:49). Those terms belong to his chart methodology and are presented as his interpretations rather than independently established signals.
Macro Economic Bond and Dollar Election Example
ICT also discusses market movement surrounding the 2016 U.S. presidential election. He says he expected Trump to win, and describes an overnight bout of volatility in which the dollar index sank and Dow Jones futures were down roughly 750 points before the market reversed (9:38, 9:50). Near 15:53, he points to a rally higher in the 10-year that was not seen in the 30-year, and argues that the overnight sell-off was “fluff” and “manipulation” because the lower low in the dollar was not matched by higher highs in the debt instruments (16:23, 16:28).
ICT labels part of that move “manipulation” and says interest rates were still calling the shots (16:35). The transcript supplies no independent evidence establishing causation, and the reviewer did not see the charts. A more cautious educational reading is that his longer-horizon intermarket bias remained unchanged even while short-term markets moved sharply against it.
ICT Macro Technical Study Sequence
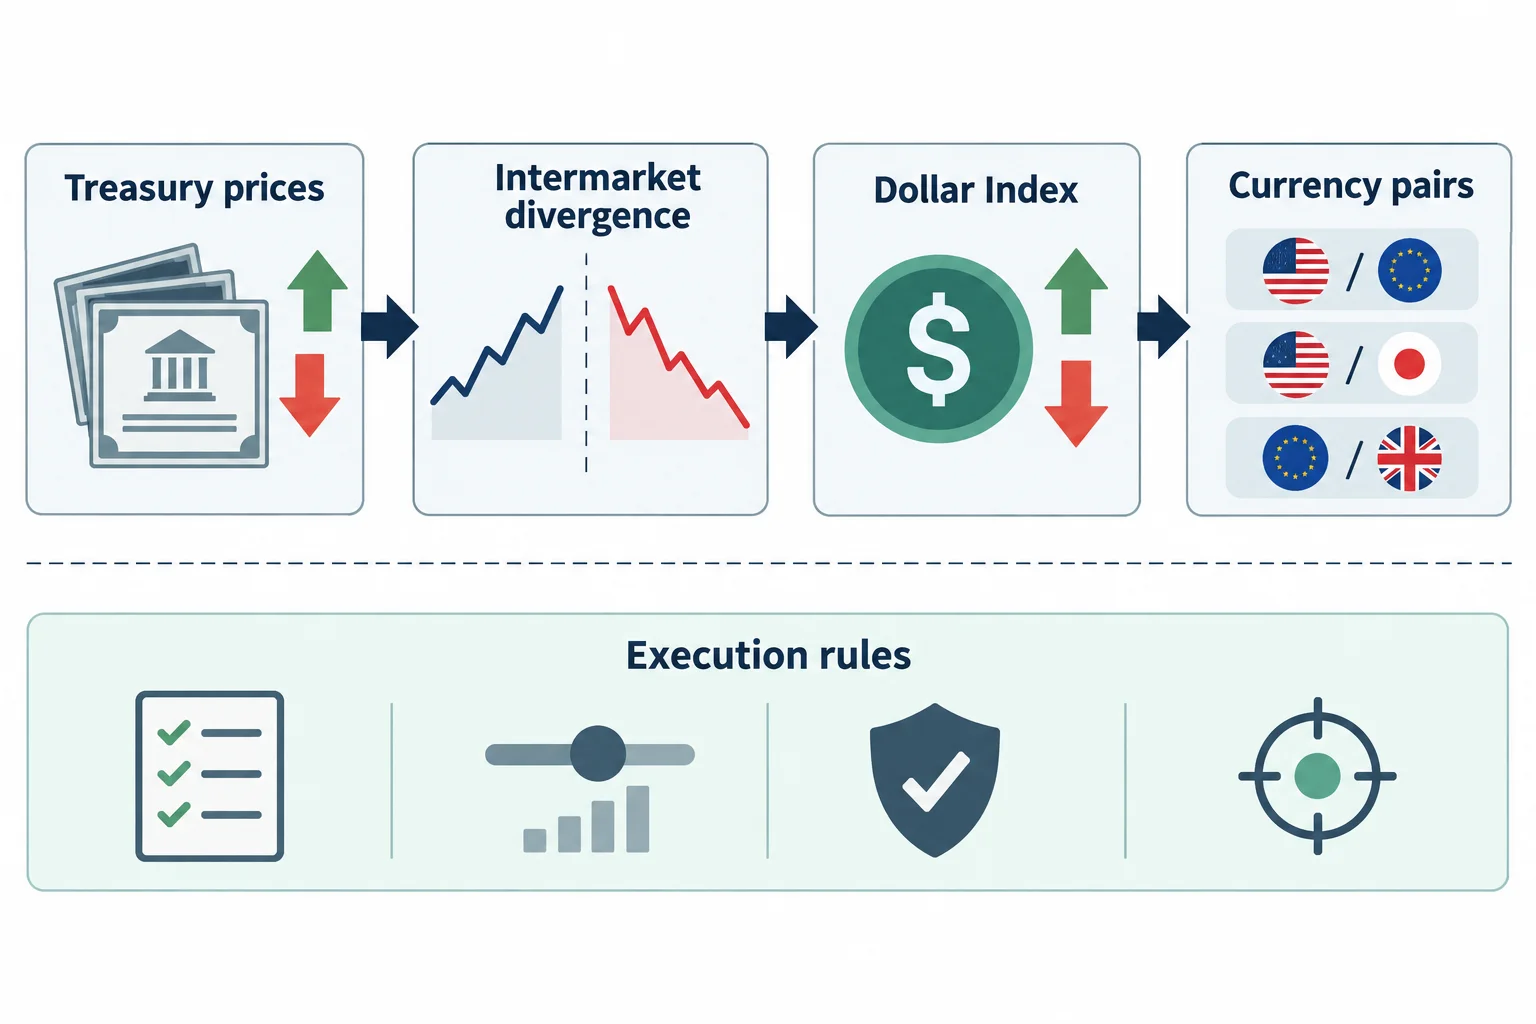
For students reviewing this specific lesson, its workflow can be summarized without turning it into a trading recommendation:
- Study daily 10-year note and 30-year bond futures charts.
- Translate rising or falling Treasury prices into ICT’s expected rate direction.
- Compare the two maturities for relative highs, lows, and divergences.
- Compare Treasury behavior with the Dollar Index.
- Form a broad, multi-month dollar hypothesis.
- Check whether the currency pairs he names behave consistently with that hypothesis.
- Keep the macro thesis separate from any lower-timeframe execution rules.
The key lesson is methodological: ICT starts with interest-rate markets, uses intermarket divergence to construct a dollar bias, and only then moves to individual currency charts. The video does not provide a complete risk-management system or establish that this sequence will produce profitable trades. It is educational material describing ICT’s own market interpretation.
Watch the ICT Macro Technical Recording
ICT Mentorship Core Content – Month 03 – Macro Economic To Micro Technical
The Inner Circle Trader · watch page lists upload 3 September 2022 · 1140 seconds, about 19 minutes. This recording is the primary source for every timestamp link on this page.
The recording is not embedded here. An embedded player was tested directly on 15 September 2026 from a BestProps page origin at desktop and mobile widths: the frame loads and then reports “Playback on other websites has been disabled by the video owner,” with no duration and no playback progress, while the video itself plays normally on YouTube. No half-working player is left on this page.
The watch page was read on 15 September 2026 and is publicly listed as ICT Mentorship Core Content – Month 03 – Macro Economic To Micro Technical by The Inner Circle Trader, with an upload timestamp of 3 September 2022, not private and not unlisted, and a listed duration of 1140 seconds (about 19 minutes), against a transcribed audio duration of 1140.0 seconds.
ICT Macro Technical Resources
These are the sources checked for this article. The regulator and investor-education pages are general material on assessing trading systems sold to the public and on short-term trading risk. None of them evaluates this speaker, and none of them verifies the Treasury-to-dollar reasoning, the quarterly-shift idea, the divergence readings or the pair examples described above. Any ICT, smart-money or third-party indicator, script, note set, chart annotation, transcript pack or re-upload circulating outside the publishing channel’s own page is unofficial and has not been tested here.
- ICT Mentorship Core Content – Month 03 – Macro Economic To Micro Technical The Inner Circle Trader (primary source and the recording transcribed for this article; watch page read 15 September 2026, listed duration 1140 seconds).
- The Inner Circle Trader (official YouTube channel) (read 15 September 2026), the publishing channel for the mentorship curriculum this lesson belongs to.
- CFTC (Commodity Trading Systems Sold on the Internet) (read 15 September 2026), the regulator’s guidance on assessing trading systems sold to the public, including its warning that hypothetical results typically simulate trades using prices that occurred in the past.
- Investor.gov (U.S. SEC), Day Trading (read 15 September 2026), the regulator’s definition, which states that day trading is extremely risky and can result in substantial financial losses in a very short period of time.
ICT Macro Technical Transcription Note
There was no usable caption track for this recording, so the transcript behind this article is an automatic speech-recognition pass over the full original audio, not human-verified captions and not YouTube’s own captions. The pass covered the complete audio, reported no low-confidence characters and a maximum level of -6.7 dB, and returned a duration of 1140.0 seconds against the watch page’s listed 1140 seconds. Because the text is machine-recognised, terminology was checked against context rather than trusted as printed: the audio renders “Pinsley” where the surrounding passage is about the dollar index and index levels, “moats” where he is naming the 10-year note, “dollar cat” where he is naming the dollar CAD pair, and “dollar Swissy” for the dollar Swiss pair. The charts themselves were not available to this review; only the spoken description was, so the highs, lows, divergence markings and any displayed levels were not independently verified.
Source: ICT, ICT Mentorship Core Content – Month 03 – Macro Economic To Micro Technical, The Inner Circle Trader, 3 September 2022. Educational commentary, not investment advice. The Treasury-to-rate reasoning, the quarterly-shift expectation, the divergence readings and the currency-pair examples are the speaker’s own stated framework and interpretation, presented with no dataset, no independently verified chart markings and no results of any kind.