
Key takeaways
ICT Mentorship Core Content Month 02 Market Maker Trap False Breakouts is a 1251-second YouTube lesson from The Inner Circle Trader explaining a liquidity-based interpretation of false breakouts.
Read the full summary
ICT Mentorship Core Content Month 02 Market Maker Trap False Breakouts is a 1251-second YouTube lesson from The Inner Circle Trader explaining a liquidity-based interpretation of false breakouts. Under a bullish premise, price moves below consolidation to reach sell stops, rejects the break, returns through the range and expands toward buy stops above prior highs, while the bearish model reverses this sequence. ICT says not to fade every breakout because directional premise comes first, with the key signal being which side of successive consolidations price repeatedly reaches and where it moves afterward. He prioritizes clean highs and lows, candle bodies over wicks, the liquidity pool reachable with least resistance and measured impulse ranges as confluence, but provides no universal entry, risk limit, invalidation rule, verified fills, results or performance test. The chart levels, order-flow mechanism and claims about larger participants are ICT’s interpretations rather than independently verified evidence, and the recording uploaded 30 August 2022 runs about 20 minutes 51 seconds.
How we researched this article
BestProps used document-based research from primary firm sources, checked September 25, 2026. The complete source list, scope, limitations, and commercial-state record appear near the end of this article.
In ICT Mentorship Core Content – Month 02 – Market Maker Trap False Breakouts, ICT presents a liquidity-based interpretation of false breakouts around trading ranges. The central lesson is that the direction price takes immediately outside a consolidation may be less informative than what happens next.
ICT teaches the bullish version in detail and says the bearish version can be understood by reversing the logic. This is an interpretation of market behavior taught by ICT, not proof that every range break is engineered or that the model provides a reliable trading edge.
ICT Market Maker Trap Basics
At 0:57, ICT introduces both sides of the framework:
- In assumed bearish market conditions, a move above a consolidation may be treated as a potential false upside breakout.
- In assumed bullish market conditions, a move below a consolidation may be treated as a potential false downside breakout.
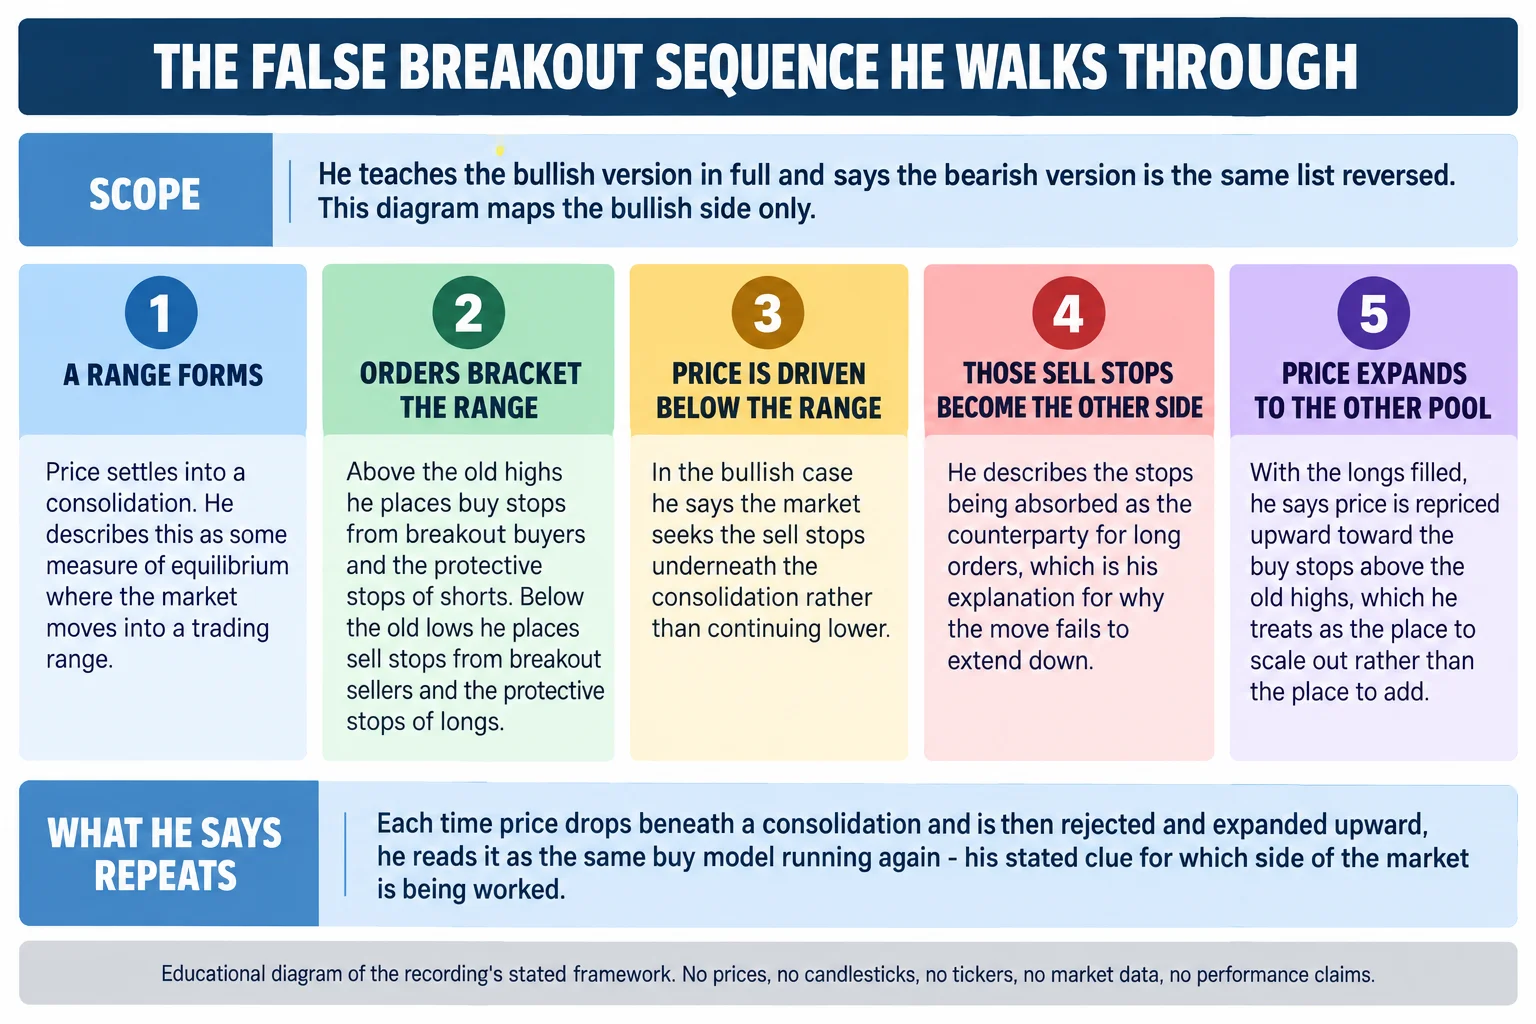
The range matters because different orders may collect around its boundaries. Breakout buyers can place entry orders above prior highs, while breakout sellers can place orders below prior lows. Protective stops from existing positions may also be found in those areas. ICT groups these orders into pools of potential liquidity.
His argument is not simply that traders should oppose every breakout. The prior directional premise comes first. A downside break is interpreted as a possible trap only when the analyst already has a supported bullish expectation; the logic is reversed when the premise is bearish.
ICT Market Maker Trap Bullish Example
Beginning around 4:12, ICT concentrates on a bullish model. Price first trades below a consolidation, where sell stops are presumed to rest. In ICT’s explanation, those sell orders provide counterparties for larger participants seeking long exposure. Price then expands toward old highs, where buy stops and breakout demand may provide liquidity for reducing those long positions.
The conceptual sequence is:
- Price forms a recognizable consolidation.
- Orders accumulate above its highs and below its lows.
- In a bullish market premise, price trades beneath the range and reaches the sell-side orders.
- The market rejects the lower area and moves back through the range.
- Old highs become possible objectives because buy-side liquidity is presumed to rest above them.
At 8:47, the lesson applies this process to the chart shown in the recording. ICT discusses price moving beneath another short-term consolidation before advancing toward prior highs. The transcript includes several quoted price levels, but the source available here does not independently verify the chart, instrument, candle structure, or executions. Those numbers are therefore best understood as references within his illustrated example rather than reusable signals.
ICT Trap Signals Around Consolidation
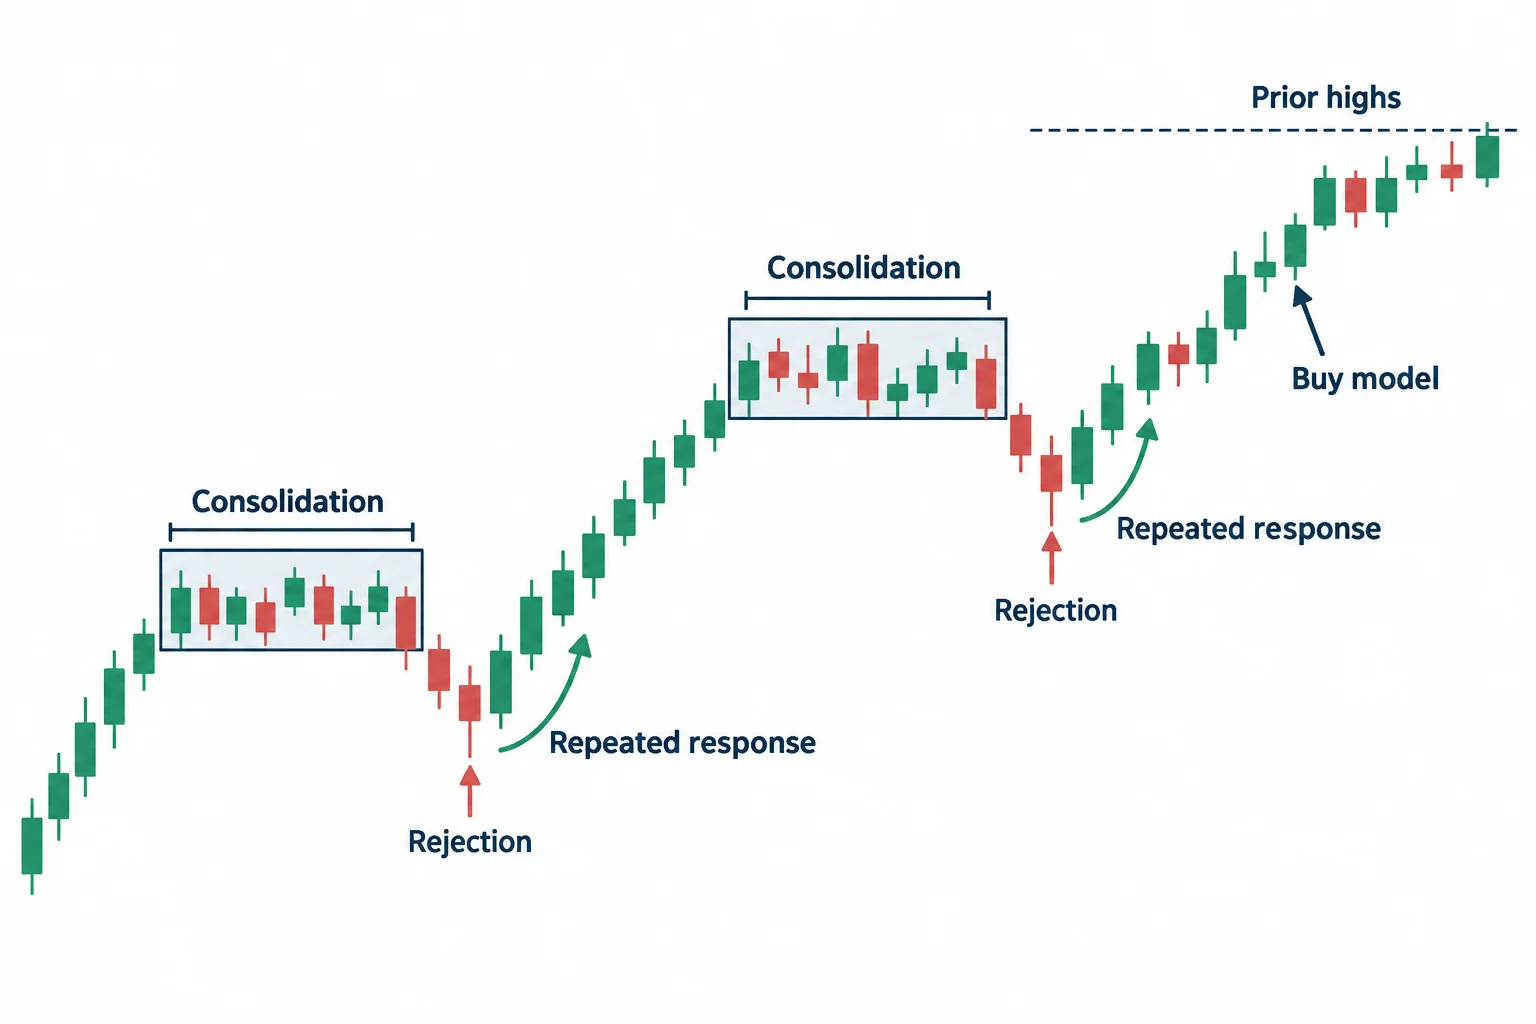
The most useful distinction in the lesson appears near 14:13. ICT asks which side of a consolidation price repeatedly reaches and where it goes afterward. In his bullish example, price repeatedly moves below short-term ranges, rejects those moves, and then expands upward. He treats that recurring behavior as evidence of a bullish “buy model.”
This makes the post-break response essential. A brief move below a low is not enough by itself. Under ICT’s framework, the stronger clue is repeated failure to remain below consolidations followed by expansion toward prior highs. For a bearish model, the proposed pattern is the mirror image: moves above consolidations reach buy-side orders, fail to continue higher, and are followed by downward expansion.
He states the same test again later in the recording, at 14:27, in terms of which side of the market is being reached for each time price enters a consolidation. In his words, the market will always seek liquidity, and the question he says to ask is which of the two pools the market has shown a willingness to reach for with the least resistance on the way to it (13:08).
Market Liquidity Behind False Breakouts
At 7:36, ICT refers to “clean highs and clean lows.” In context, this appears to mean conspicuous prior extremes (especially equal or otherwise obvious highs and lows) where traders may cluster stops or breakout orders.
ICT suggests asking two practical questions:
- Where are buyers likely to be waiting above old highs?
- Where are sellers likely to be waiting below old lows?
He then frames directional analysis as deciding which pool price is more likely to approach with the least resistance. This remains ICT’s market interpretation; a transcript cannot establish the actual composition of the order book or identify who traded at a particular level.
One detail he attaches to that is where the volume sits. At 9:08 he says he works primarily from the bodies of the candles rather than the wicks, on the argument that the bodies carry most of the volume and that liquidity is therefore going to rest above them. He treats the wicks as not fully reliable in that particular reading.
Measured Moves After False Breakouts
Later, at 16:41, ICT adds measured price swings to the example. He identifies later upward legs that approximately correspond to earlier impulse ranges and connects one projected area with a higher-time-frame bearish order block.
This is presented as confluence rather than the initial definition of a market maker trap. The core teaching remains the interaction among consolidation, presumed stop locations, the existing directional premise, and price’s response after reaching one side of the range.
Understanding the ICT Market Maker Trap
A restrained way to study the lesson is to separate observation from explanation. Observable features include a trading range, a break beyond one boundary, a return into the range, and subsequent movement toward the opposite boundary. Claims about “smart money,” market makers, or an algorithm describe ICT’s proposed mechanism and cannot be confirmed from candles alone.
The video also does not provide a universal entry rule, risk limit, invalidation point, or performance test. Treating every breakout as false would contradict ICT’s own emphasis on first establishing a directional premise and then examining repeated reactions. Note also that the speaker’s framing is not morally neutral in places: he describes the market makers as doing their job by providing liquidity, and attributes most trader losses to a lack of understanding rather than to misconduct (12:28). That is his position, not an independently established account of how order flow behaves. The material is educational and should not be taken as investment advice or a promise of results.
ICT Market Maker Trap Source
This article is written from the recording’s own audio. The source used here is an automatic speech-to-text transcript of the full original audio, not human-corrected captions, and the speaker’s identity, words and reported levels are attributed to that recording rather than verified independently. The upload date on the watch page is 30 August 2022, which the transcript’s own opening does not contradict: the speaker introduces the session as the eighth and final teaching of the second month of his mentorship, which he names as October, and refers back to September as the first month of that mentorship (0:32, 7:39). Those month names are how the speaker refers to the material, not claims about the calendar date of publication. The transcript is not reproduced here and remains private.
Watch the ICT Market Maker Recording
ICT Mentorship Core Content – Month 02 – Market Maker Trap False Breakouts
The Inner Circle Trader · watch page lists upload 30 August 2022 · 1251 seconds, about 20 minutes 51 seconds · public, not unlisted. This recording is the primary source for every timestamp link on this page.
The recording is not embedded here. An embedded player was tested directly on 15 September 2026 from a BestProps page origin: the frame loads and then reports “Playback on other websites has been disabled by the video owner”, with no playable stream and no duration reported. The link above opens the recording on YouTube itself.
ICT Market Maker Trap Resources
These are the sources checked while preparing this article. The CFTC pages are the regulator’s advisories on forex fraud and on commodity trading systems sold on the internet; the CME Group pages are the exchange’s own FX education material. None of them evaluates this speaker, tests whether a liquidity run or a false breakout provides an edge, verifies any level named in the recording, or endorses anything said in it. Any ICT, smart-money or third-party indicator, script, note set, chart annotation or re-upload circulating outside the publishing channel’s own page is unofficial and untested here.
- [1] ICT Mentorship Core Content – Month 02 – Market Maker Trap False Breakouts The Inner Circle Trader (primary source; watch page read 15 September 2026, published 30 August 2022, listed at 1251 seconds).
- [2] The Inner Circle Trader (official YouTube channel) (read 15 September 2026), the publishing channel for the Core Content mentorship series this module belongs to.
- [3] U.S. Commodity Futures Trading Commission: Fraud Advisory: Foreign Currency (Forex) Fraud (read 15 September 2026), the regulator’s advisory on retail forex fraud, warning that the market is volatile and carries substantial risk and that promises of profit from already-public news are a common sign of a fraudulent pitch.
- [4] U.S. Commodity Futures Trading Commission: Fraud Advisory: Commodity Trading Systems Sold on the Internet (read 15 September 2026), notes that technical analysis attempts to predict future price movements from historical prices, price relationships and price trends, and that hypothetical trading results are typically simulations over historical data rather than real fills.
- [5] CME Group: Introduction to FX (course page read 15 September 2026), the exchange’s own introductory course on how listed FX futures work, quoted here only as contract-market background. It contains none of the lesson’s rules and says nothing about false breakouts or stop running.