
Key takeaways
ICT’s roughly 38-minute YouTube lesson ICT Price Action Chronicles Market On Close Macro reviews the Monday 3 August 2026 New York afternoon session and defines the market on close macro as a ten-minute window from three fifty to four p.m.
Read the full summary
ICT’s roughly 38-minute YouTube lesson ICT Price Action Chronicles Market On Close Macro reviews the Monday 3 August 2026 New York afternoon session and defines the market on close macro as a ten-minute window from three fifty to four p.m. Eastern that may reprice toward nearby liquidity or an inefficiency. Set charts to New York time, treat one thirty p.m. as the PM pre-session start, define the final-hour dealing range from three to four p.m., and rank a left-hand upper wick above an adjacent fair value gap, with candle bodies ideally remaining below the wick midpoint while probes above it are tolerated. ICT reads relatively equal highs as buy-side liquidity and qualified relatively equal lows as sell-side liquidity, expected price to run higher first and then break the lows, and projected the downside objective using the negative 0.5 extension of the final-hour range. His stop was anchored roughly 1 or 2 ticks above the three p.m. candle’s wick high rather than above the conventional swing high, with drawdown accepted up to that invalidation area and possible additions if price tapped it. He says price collapsed through several lows and cleared the projected level at three fifty-six p.m., but the automatic transcript cannot verify chart geometry, orders, fills, account performance, or whether the claimed recording was live rather than replay. The transferable process is to mark time-based ranges before three fifty p.m., specify the expected liquidity sequence, target, and invalidation in advance, then backtest and walk forward because this single successful session does not establish an edge.
How we researched this article
BestProps used document-based research from primary firm sources, checked September 24, 2026. The complete source list, scope, limitations, and commercial-state record appear near the end of this article.
The mapped source for this article is ICT’s ICT Price Action Chronicles – Market On Close Macro, published on 4 August 2026 and running about 38 minutes. Inside the recording he dates the material himself: at 1:51 he says the entry is for the New York PM session of Monday, 3 August 2026. The upload day and the session day are therefore not the same calendar date, and that difference is normal rather than contradictory: the session he narrates was recorded the previous afternoon and published the next day.
One more boundary belongs up front. This lesson is a walk-through of one session, with the chart visible only to the viewer. The transcript captures ICT’s narration, not the candles, so every chart reference below is reported as his interpretation rather than verified geometry. The parts that can be checked against a transcript are the order of his steps, the times he states, and the reasoning he gives for them.
How ICT Defines the Market Close Macro
ICT frames the window early and with a warning attached. At 0:28 he calls it a small 10-minute window in which the market produces, in his words, some of the cleanest and most predictable runs for an intraday scalper. At 0:38 he says some students have made it their entire model, working, in his words, a ten-to-thirty-minute day as an intraday trader (0:43). He immediately qualifies that at 0:54: not every day is as good as the one being shown, sometimes you get burned, and missed trades and stops are part of the process.
The definition itself arrives later. He states at 13:45 that the macro begins at 3:50 p.m. Eastern, and at 14:03 that it completes by 4:00 p.m. He describes it at 3:30 as a script that causes the market to reprice into an obvious pool of liquidity or an inefficiency, and says the move can continue beyond 4:00 at 14:13. His session clock, as transcribed, runs the regular hours to about 4:14 p.m. (3:28), the electronic close to 4:59 p.m. (14:20), then one hour without trading before electronic trading restarts at 6:00 p.m. (14:30). Those clock values come from an automated transcript and should be checked against the recording and the exchange schedule rather than copied.
He also insists on one housekeeping rule at 2:54: set the chart to New York local time regardless of where the trader lives. Without that, the window and the ranges that define it cannot be located consistently. And he gives the concept a nickname at 6:36, calling a market like this one a “no-brainer” market on close, or as he puts it, murder on close.
ICT Market Close Timing and the Daily Price Range
The lesson treats 1:30 p.m. as the beginning of the afternoon framework. At 2:41 he calls 1:30 p.m. Eastern the start of the New York PM pre-session and a 30-minute window of interest. He then describes the day he is reviewing: a morning advance, a consolidation through the two-hour lunch at 2:02, another rally, and a small consolidation that inexperienced traders try to trade as the next leg.
At 4:37 he marks the 1:30 p.m. high as the high of the day during regular trading hours, then makes a distinction that shapes everything after it: while the session is still open, that high is only a developing high. At 5:10 and again at 16:46 he says the completed daily high and low are not settled until the regular session closes, and that until then the reference is the intraday range. He measures that range from the low up to the highest high formed after 1:30 p.m. (5:41) and marks its first octant at 5:27. The price he attaches to that octant is a chart value that cannot be checked from narration, so it is not reproduced here.
The final-hour range is the next layer. At 6:53 he identifies the 3:00 p.m. candle as the start of the last full hour of regular trading, shaded through to 4:00 p.m., and at 16:14 he names the final-hour dealing-range high and low. His argument for why that range is knowable in advance is a time argument rather than a hindsight argument: at 18:01 he answers the objection “how would you know that was the low?” by pointing out that the boundaries are fixed by the clock, since almost an hour separates one boundary from the next.
How ICT Price Action Ranks the Wick Over the Gap
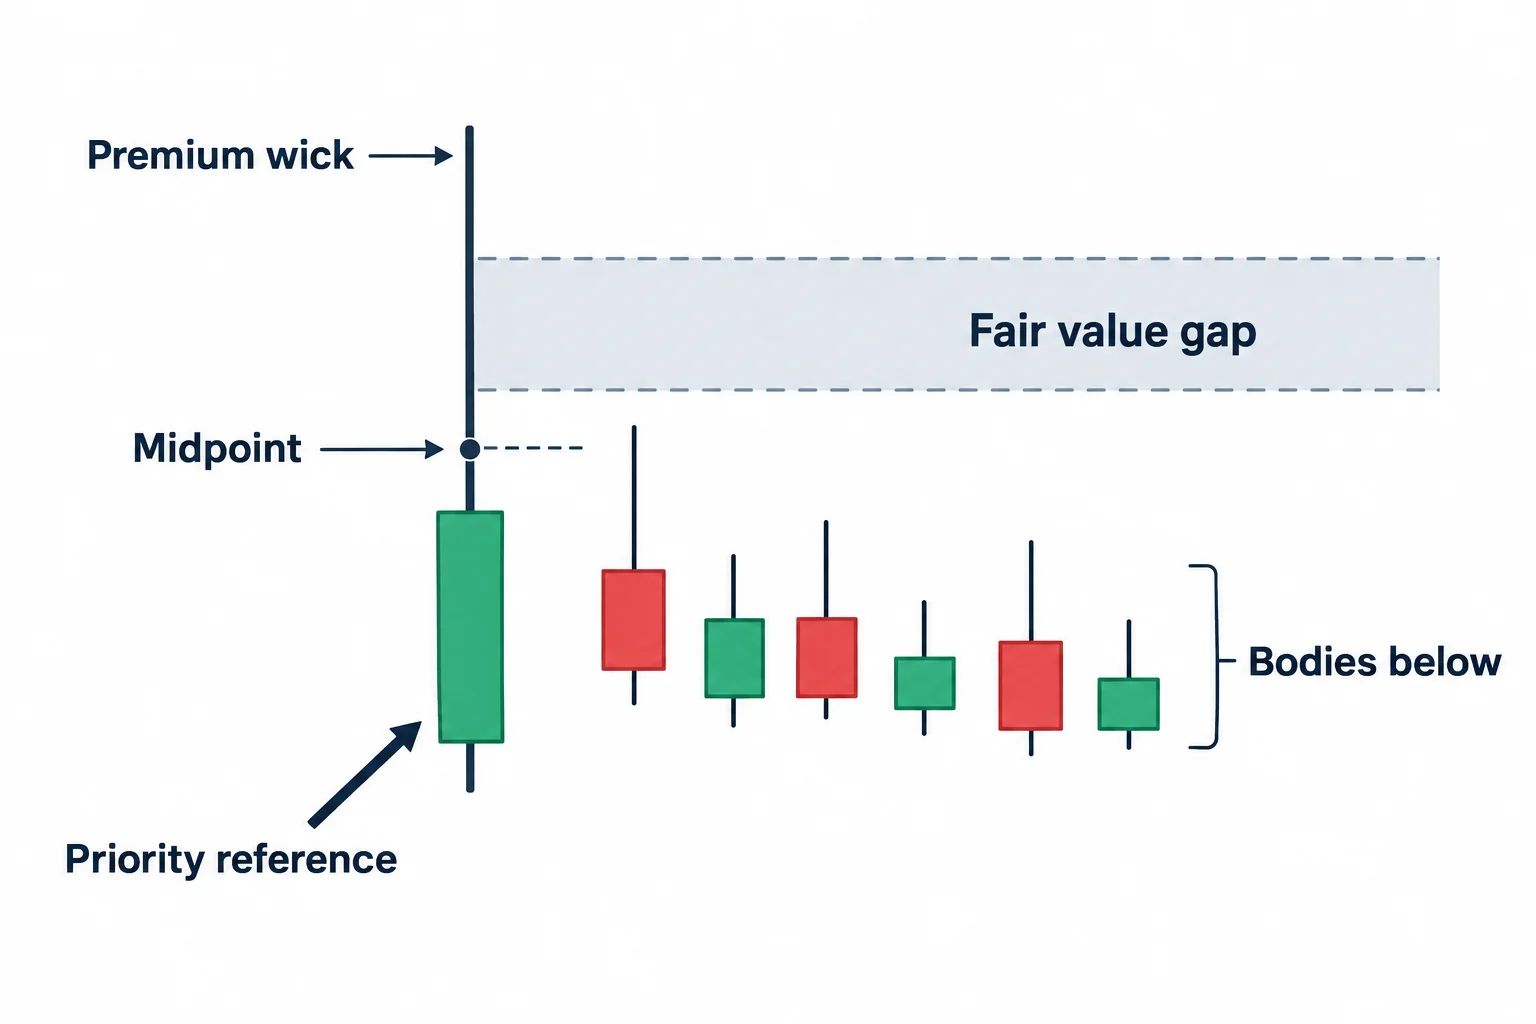
The most specific teaching point in this session is a ranking rule between two overlapping reference areas. At 10:33 he notes that the range low and range high he is working with form what he calls a premium PD array in the form of a premium wick above where the 3:00 p.m. candle opens. Near 10:55 he states the rule: when a wick sits next to a fair value gap and the wick is to the left, the wick takes precedence over the gap, and at 11:13 he says he would have used the gap instead if the wick were not there.
He then grades the wick by where candle bodies close relative to its midpoint. At 11:45 he says that if the wick is to act as a premium area holding price down, bodies should not be buried above its halfway point, and that wicks probing above that area are tolerable. At 13:04 he describes the lower half of that wick as extremely sensitive, which he calls premium sensitivity, and at 13:09 he explicitly distinguishes this from classic support and resistance.
That is ICT’s terminology and his ranking, not an independently demonstrated market mechanism. A body closing in the lower half of a wick does not by itself prove that algorithms are defending the upper half. What the passage does establish is how he organized the setup and, as the next section shows, where he put his invalidation as a result.
Market Close Liquidity Around the Final Hour Range
His directional case is assembled from liquidity rather than from an indicator. At 9:27 he marks two lows as minor sell-side liquidity pools, and explains at 8:49 the criterion he uses for relatively equal lows: the low closest to current price must be higher than the low to its left for the pair to qualify (9:02), while a second low that is lower instead becomes a candidate draw on liquidity (9:13). He notes that those lows do not look equal when the chart is zoomed in, which is why he applies the rule explicitly instead of by eye.
Higher up, he reads the contrary evidence. At 14:51 he points to relatively equal highs and describes the 3:00 p.m. area as smooth, contrasting that with lows he calls more jagged at 15:48. His conclusion is stated as an expectation to be anticipated rather than a reaction at 23:32: the market should trade higher first, into buy-side liquidity, and then trade lower through the sell-side lows. The whole sequence, in his framing, is decided before 3:50 p.m. rather than after it.
ICT Market Close Targets Stops and Exit Rules
The objective is a measured move applied to the final-hour range. At 18:34 he anchors a Fibonacci tool from that range’s high down to its low, and at 18:53 highlights the 0.5 level as a bellwether for expansion outside a range, adding that he uses the same tool on opening-range gaps and dealing ranges. At 23:41 he identifies the orange projection line as the negative 0.5 level of that dealing range. He quotes a specific projected price for it at 19:32; the digits as transcribed are not treated here as verified, and he immediately calls the figure a ballpark that price may reach exactly or overshoot rather than a guaranteed stopping point.
His exit philosophy in this session is deliberately unexacting. At 24:04 he says he does not need the lowest low, only the highest-probability area from which to get out, and at 24:13 he describes the progression from placing a limit exit right at the level to allowing a couple of handles above it (24:30). He adds at 20:38 that if a trade is expected to run a full distance, taking profit just beyond half of it is, in his view, a form of precision, and that demanding perfect exits is more harmful than demanding perfect entries (20:08).
The stop is the part he ties directly to the wick analysis. At 25:51 he extends that premium wick forward and says it marks where price can trade but should not close into (26:01). At 26:08 he says his stop loss is anchored to the 3:00 p.m. candle’s wick, and at 26:28 he places that line in the upper portion of the wick, adding at 26:34 that it also coincides with the upper quadrant of the dealing range, which he treats as making it a stronger reference. He places it roughly a tick or two above that candle’s high at 29:29, says at 26:16 and 26:18 that he would try to add if price tapped that area, and at 27:38 explains the intent as defining the drawdown he is willing to allow rather than the drawdown he can prevent. He also acknowledges at 30:34 that conventional teaching would put the stop above the swing high, and says he is not following that convention.
Two framing remarks accompany the explanation. At 27:17 he tells viewers to backtest and walk forward with the rules rather than accept them, and at 2:24 he says the lecture is about the importance of knowing the time and the characteristics of that time of day. Both are consistent with how the session is built: the level work is presented as a consequence of the clock and the range, not of a pattern that appears at random.
ICT Market Close Price Action in the Recording
At the end of the explanatory portion, ICT narrates the outcome of the example. From 31:15 he says the market collapsed, ran quickly below the nearer short-term low, below the next low, and then below the following one, and at 31:31 that at 3:56 p.m. the move ran just below his target and cleared the algorithmic range projection measured from that final-hour dealing range.
He also addresses the obvious scepticism. At 3:56 he says he posted a short clip of himself entering and managing the trade on his X account, and at 4:07 he states that the recording shown at the end is not market replay. Whether that claim holds is not something a transcript can settle: the audio does not show the tape, the order tickets, the fill prices or the account the position was held in, and it cannot establish that any part of the move was captured as profit.
Limits of This ICT Market Close Session
Three limits are worth keeping beside the lesson. First, the transcript is automatic speech recognition of the audio, so specialised terms and numbers can be misheard, and the session-clock and price figures above are reported as transcribed rather than verified. Second, the chart is not visible to a reader, so candle positions, wick proportions and range boundaries are ICT’s narrated interpretation of his own screen. Third, one session where a projection was reached is an illustration, not evidence of an edge: it cannot show how often the window produces nothing, how often the stop is taken first, or whether the same reading would have been available in real time without the benefit of the finished chart.
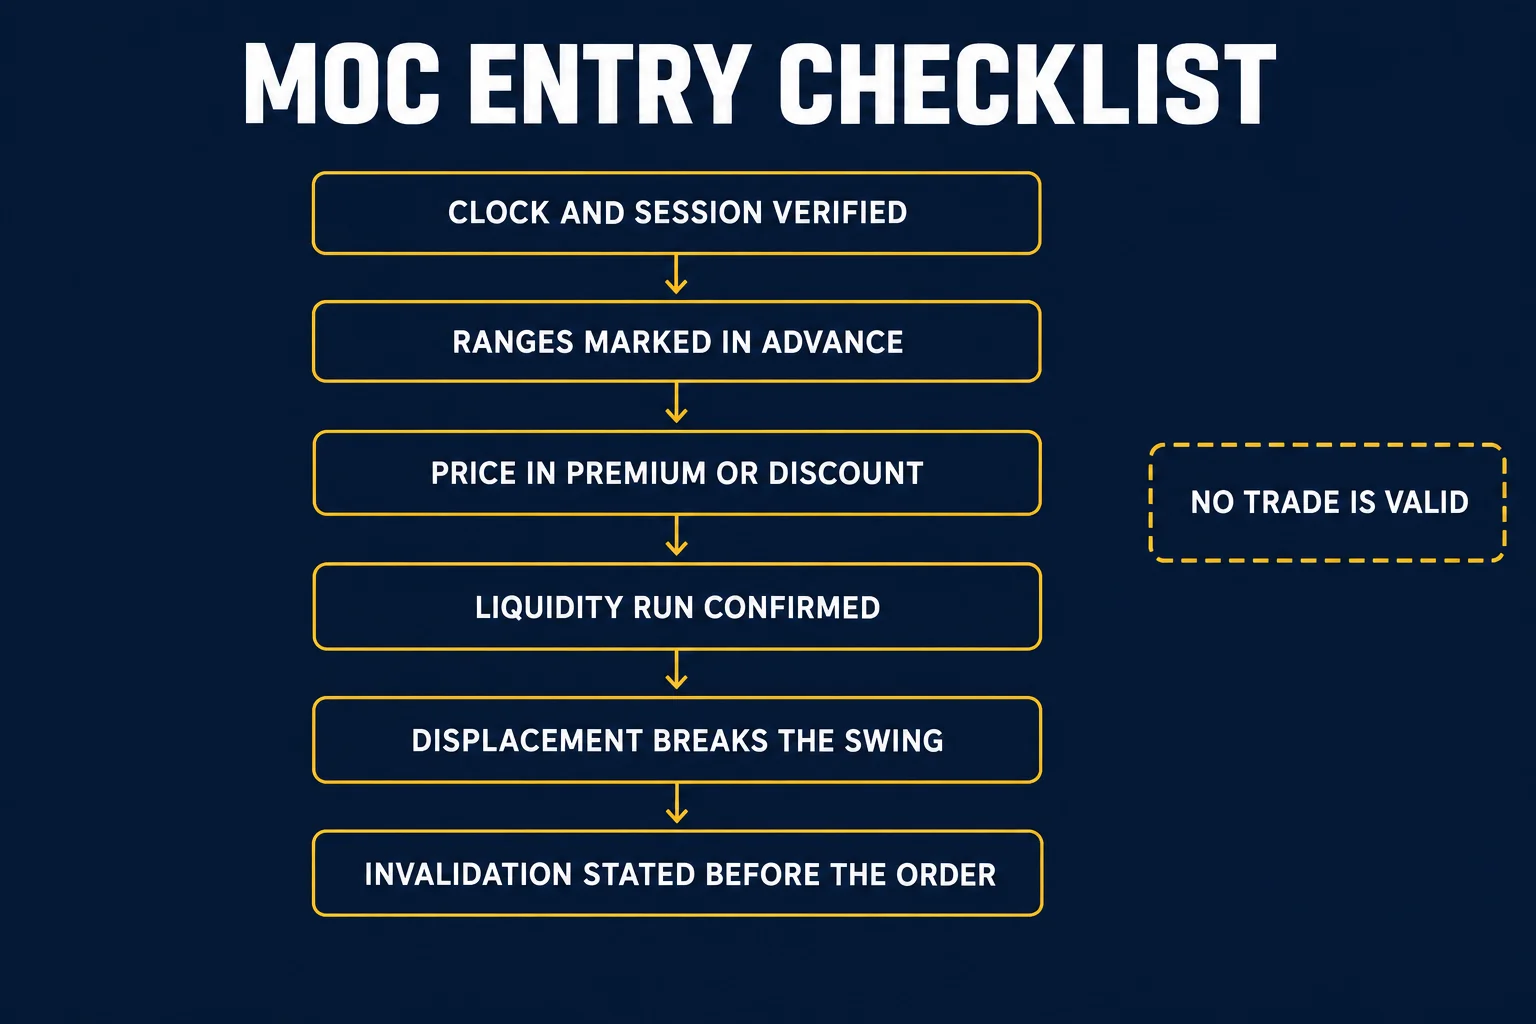
For anyone studying the framework, the transferable part is the routine rather than the result. Fix the clock to New York local time, define the final-hour range from data available before 3:50 p.m., write down which liquidity you expect to be taken and in what order, name the projection you are using, and state the invalidation before any order is placed. Then test it forward and keep both outcomes, because the recording itself only supplies the successful example.
ICT Price Action Chronicles Market Close Macro Video
The mapped source is ICT Price Action Chronicles – Market On Close Macro on the channel The Inner Circle Trader, published 4 August 2026 and about 38 minutes long. This BestProps page is independent educational commentary on the recording: it is not an ICT lesson, not a transcript publication, and not evidence that the session, the entries or the outcome occurred as described.
Watch the original lesson on YouTube
This recording cannot be played inside another website. A test run from a BestProps page on 13 September 2026 loaded the YouTube player for this video and the player itself returned “Playback on other websites has been disabled by the video owner,” with no playback position and no media data, so no player is embedded here and no owner restriction beyond that message is asserted. The full lesson is available directly on YouTube.
Watch ICT Price Action Chronicles – Market On Close Macro on YouTube ↗
ICT Market Close Macro Reference Material
Three references support the practical side of this article: the exchange product page for the futures contract such a study would be run on, the exchange page that defines its session hours and holiday calendar, and this site’s own page on drawdown calculation, which matters before any of the sizing questions above are answered.
Confirm the ICT Contract and Size
CME Group’s product page states that E-mini Nasdaq-100 futures are quoted in U.S. dollars and cents per index point and that the contract unit is $20 multiplied by the Nasdaq-100 Index.[2] That is the reference for converting anything read off a chart into a position you can size, and it has to be the specification rather than memory, because the multiplier, tick minimum and margin requirements are set by the exchange and can change. It also matters here for a naming reason: the transcript read for this article does not clearly identify the instrument on screen, so nothing in the recording is presented above as a verified price for a named contract.
Confirm Market Close Timing at the Exchange
CME Group publishes holiday and trading-hour schedules for CME Globex and its other venues, states that the schedule is subject to change, and lists opening and closing times in the time zone each venue uses.[3] The whole exercise depends on a window defined in New York local time and on the regular session close being what the speaker says it is, so the venue, the product and the clock are worth checking directly instead of assuming that a 3:50–:00 p.m. window means the same thing on every instrument or every calendar day.
Keep the Account Limit Beside the Market Plan
The BestProps page Prop Firm Drawdown Rules Explained compares static, trailing, intraday, end-of-day, daily and balance-based drawdown calculations across named programs and links the provider documents it used.[4] Read its own disclosure: the page labels itself stale, states its sources were checked on 1 August 2026, and asks readers to recheck before relying on it. It is included because a method that deliberately allows drawdown up to a reference candle’s high is only meaningful alongside the loss rules of the account it is traded in, and those rules differ by firm and program.
ICT Market Close Sources
- [1] YouTube: ICT Price Action Chronicles – Market On Close Macro, The Inner Circle Trader (source recording; transcribed in full, and its player tested from a BestProps origin)
- [2] CME Group: E-mini Nasdaq-100 Overview (exchange product page for contract unit, quotation and trading hours)
- [3] CME Group: Holiday and Trading Hours (venue schedules and holiday calendars)
- [4] BestProps: Prop Firm Drawdown Rules Explained (document-based comparison; page states sources checked 2026-08-01 and labels itself stale)
BestProps is not affiliated with The Inner Circle Trader or CME Group, and no source listed here endorses this article, this site or any setup. Market on close, macro, dealing range, PD array, premium wick, fair value gap, octant, liquidity pool and algorithmic range projection are used on this page as descriptive study terms taken from the recording, not as terms with independently established definitions. Nothing here demonstrates a tested, repeatable or profitable result, and no part of it is a recommendation to copy a reported trade.
This material is educational and general in nature. It is not individualised financial advice, a recommendation to trade Nasdaq futures or any other instrument, or a promise of trading results. Futures involve substantial risk, and trading a scheduled window around the close carries its own liquidity and execution uncertainty.