
Key takeaways
ICT’s roughly eighty-three-minute How New Students Should Start Part 2 recording is a non-executed price-reading rehearsal for beginners, not a signal service, audited result or trading stream.
Read the full summary
ICT’s roughly eighty-three-minute How New Students Should Start Part 2 recording is a non-executed price-reading rehearsal for beginners, not a signal service, audited result or trading stream. Students should place no live or demo trades, keep a notepad, record open, high, low, close and time, define confirmation and invalidation before price moves, and replay failed scenarios without treating them as personal verdicts. ICT navigates consolidation after a large overnight decline using the regular-trading-hours opening range gap, prior settlement, daily imbalance quadrants and octants, and first-presented fair value gaps from Monday 24 August and Tuesday 25 August, favoring hypothetical longs because of the open space above while acknowledging price could fall. He says the opening-gap midpoint or consequent encroachment has roughly a 70 percent chance of trading by 10 a.m. within his framework and identifies 29,212 as an objective where a graded opening-gap level and daily imbalance converge, but supplies no supporting data. Entries, stops, partial exits, an approximately 20-handle loss, totals that drift from about 60 handles to 125 or 130 handles, and the 29,212 target are narrated examples, not verified fills. His contract arithmetic assigns the micro contract 2 dollars per point and 50 cents per tick and the mini 20 dollars per point and 5 dollars per tick, with four ticks per point, though current specifications should be confirmed independently. TradingView Bar Replay can advance price one step at a time, while its blue intraday session-break lines help distinguish electronic and regular sessions. Automatically generated captions support only his spoken words, garble some levels and terminology, cannot verify chart markings or calculations, and provide no evidence that the framework has a reproducible edge.
How we researched this article
BestProps used document-based research from primary firm sources, checked September 24, 2026. The complete source list, scope, limitations, and commercial-state record appear near the end of this article.
The recording opens on “today’s morning session” (0:00) and runs about eighty-three minutes. ICT’s son is present and addressed by name within the first minute (0:58), which matters for how the lesson should be read: he describes it as a training exercise for a beginner, not a signal service or an execution stream. He refers back to “the first lecture yesterday”, so this session sits inside a larger sequence rather than standing alone.
How ICT Reads Price Before the Session
His first statement is directional-context building. He identifies highs above the market that he expects price to be drawn toward, sell-side references below it, and an unusually large gap between yesterday’s regular-session settlement and the session’s opening area (1:57). He then says his preferred path would be for price to leave a low in place, sweep the highs above, and only then work back down toward lower references. He also notes a daily-chart inefficiency that he divides into quadrants and octants, and reads the current area as the discounted end of it.
He adds two more references to the same chart: the first-presented fair value gap he had marked from Tuesday 25 August (5:13) and the first-presented gap that day (12:59). Later he marks the high of the first-presented gap from Monday 24 August as another level bodies should not trade below (17:59). He also remarks that the market looks to be following a seasonal tendency toward lower prices that he says he flagged earlier (12:33), an interpretive claim, not a measured statistic.
Why ICT Narrates the Price Exercise Without Trading
The single most important framing in the recording comes early. At 5:42 he says the positions are hypothetical, states that they are not doing any execution that week, and then walks through a long with a stop below the recent low. From that point the session is a sequence of conditional statements: a fill he “will say” happened, a stop that “would go” to a stated level, a partial that “would be taken” at a marked reference.
He is explicit about the purpose at 38:27: this is tape reading, not pushing a demo trade, and the objective is to get a feel for reading price. Later he repeats the point in stronger terms. The pretend profit is not what matters, and the importance is reading price action and paying attention to specific features he teaches (1:03:54).
How a New Student Reads Choppy Price
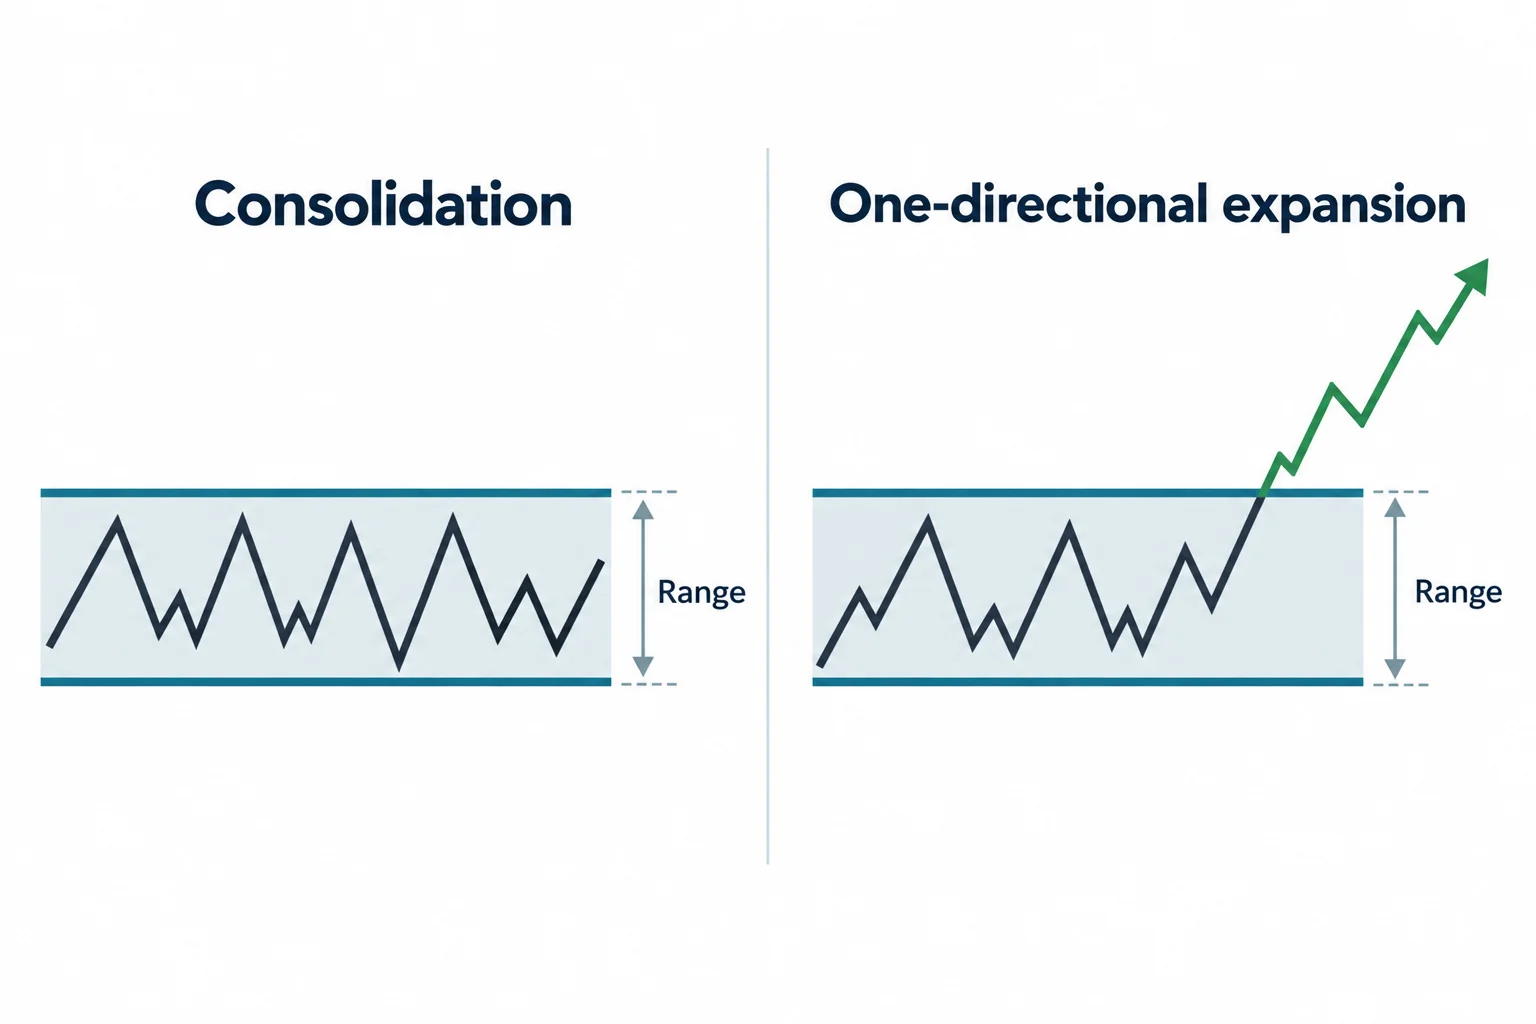
Price does not move cleanly. He takes several hypothetical attempts, gets stopped or closed at covered cost, briefly flips to a short and adds to it, then says he is wrong on that idea and returns to the long side. He never claims the morning was easy; he calls it a challenging morning with a very large range gap.
The teaching value he draws from that is aimed at new students. He says he has not abandoned the long idea but expects the morning to behave as consolidation after the overnight decline (29:54). He then tells newer viewers to be nimble, to be forgiving with themselves if they get chopped up, and (if they are brand new) to let the experience of watching price happen rather than getting excited about chasing a move (31:57 and 32:05). It is a point about learning to recognise what one-directional expansion feels like, so that a beginner can tell it apart from repeated failure inside a range.
He interrupts the technical flow to note that an ISM release was due within a few minutes and would probably cause a whipsaw (27:17), and he jokes about needing to “pull price up” with a “dead pull technique” that he says you have to pay extra for on your platform (20:58). Both remarks are worth noting as tone: the session is deliberately informal, and the numbers being called out are placeholders in a rehearsal.
Why ICT Favors Longs in Price Reading
His stated rationale at 40:32 is the size of the regular-trading-hours opening range gap above the market. In his words, while the session is in consolidation he is more inclined to take longs, because with that much open space above, buys are more likely to produce an exaggerated run into the gap than shorts are to produce a similar move lower. He is careful to add that this does not mean price cannot go lower.
He also explains how he grades that gap. He measures the opening price against the prior settlement and marks levels inside it, describing the midpoint as the gap’s consequent encroachment, and says he normally expects that midpoint to be traded to with roughly seventy percent likelihood by 10:00 a.m. He notes that it had not happened yet that morning (56:51). That probability figure is his stated expectation inside his framework; the transcript contains no data set behind it.
His primary objective is 29,212. His reason is confluence: he says that level is both a graded level of the opening-range gap and a level belonging to the daily imbalance, so it lines up on two separate readings of the chart (54:43, revisited at 1:22:44). He also ties his preference to context outside the chart, describing the day as falling in nonfarm payroll week, after a day of significant consolidation and a huge overnight decline (57:49).
Two timing references run through the whole session. He points out that at 10:30 the chart contains an hour’s dealing range, which he says makes it more likely a large gap stays open for a while and makes price speed up (43:26 and 1:01:13). He also keeps returning to whether a marked gap is behaving as an inversion fair value gap, explaining that he needs a close beyond it to treat it that way, and that in this session it had not given him that signal (44:01, 45:03 and 46:15).
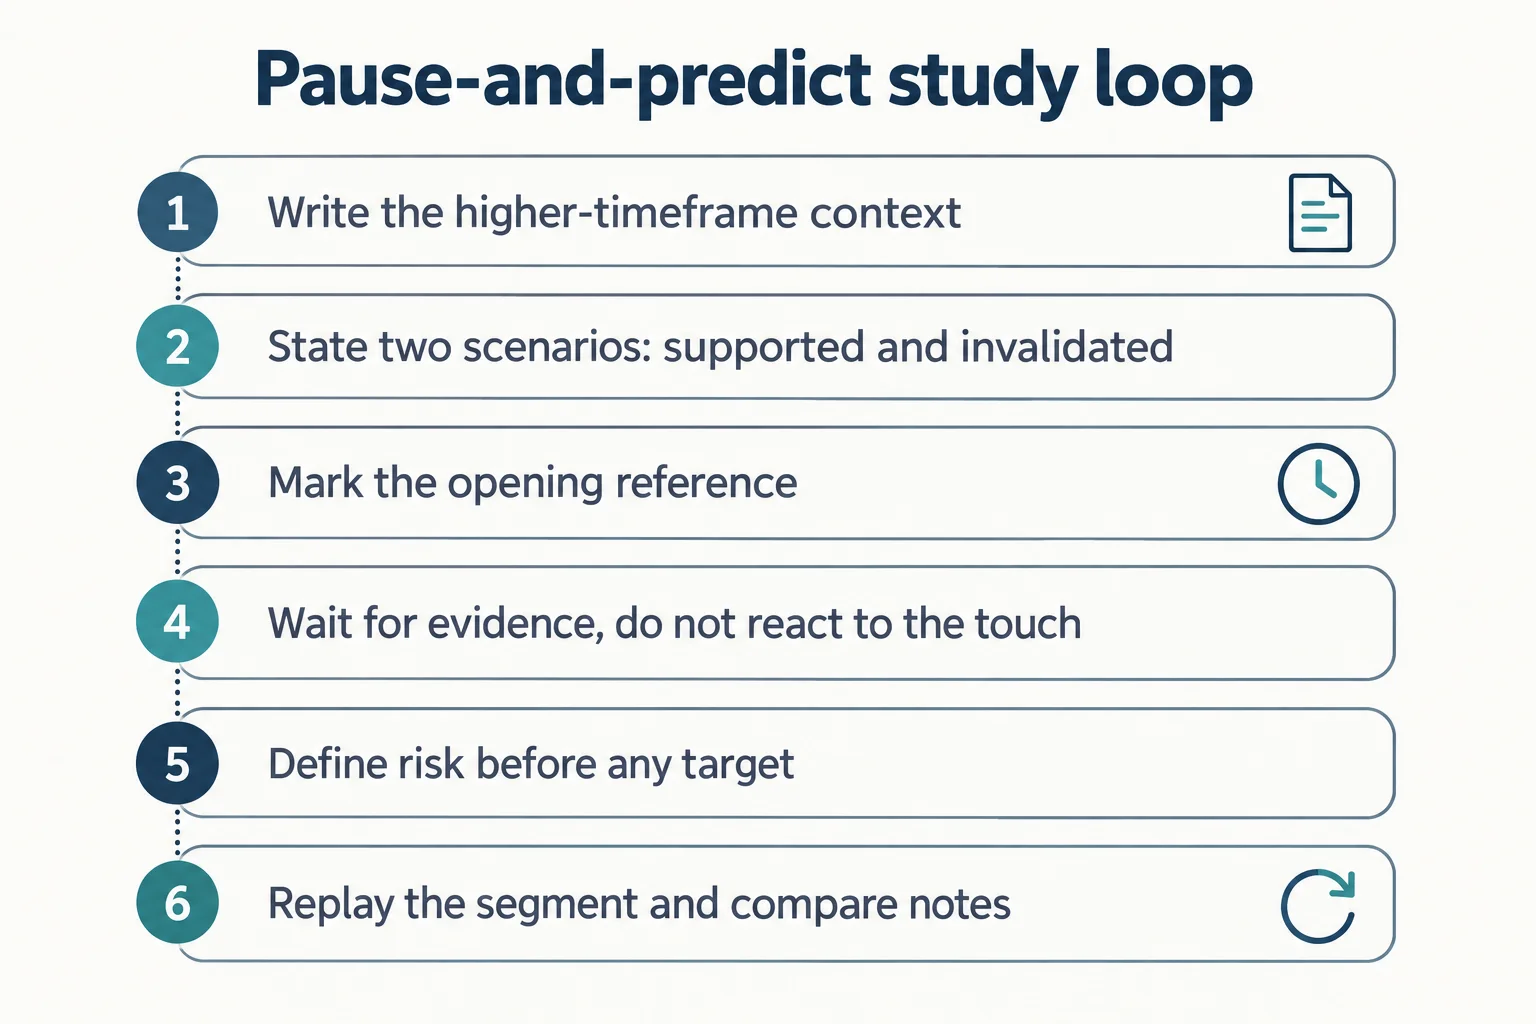
The ICT Price Reading Exercise Assignment
At 52:26 he states the purpose directly: he is pantomiming a new student and says he is trying to encapsulate roughly the first two months of what a student would be doing with his material. He admits the demonstration cannot be a true day one, because he cannot forget his own experience, an honest limitation worth noting.
His instructions for that stage are concrete:
- Do not place even a demo trade; read the chart instead (38:27).
- Keep a notepad and write the numbers down. He makes the point by scolding his own son for not taking notes during the session (32:46 and 1:13:46).
- Say what price should do if an idea is valid, before it does it, for example requiring a candle to close above a marked wick level as confirmation (19:12).
- Watch failed scenarios without treating each hypothetical outcome as a personal verdict (53:27).
- Work from open, high, low, close and time rather than piling on tools (1:23:01).
He also spends time on contract arithmetic so that students can score their own rehearsal honestly. He suggests starting with the micro contract, where he says one point is worth two dollars and one tick fifty cents, and moving to the mini later, where he says a point is twenty dollars and a tick five dollars, noting there are four ticks in a point (1:14:06 to 1:14:49). Confirm current values with your broker or exchange before relying on them, and remember that these are presented here as his explanation, not as a verified specification.
What ICT Price Captions Can Prove
Reading this recording as evidence requires keeping several limits in view.
- Nothing was executed. He says explicitly that there was no execution that week and repeatedly labels entries, stops and partials as hypothetical. The 29,212 objective, the “octant” touch he celebrates near the end (1:19:31) and the running totals are narration, not fills.
- The running totals drift. He calls the morning’s result about sixty handles at one point (1:02:45) and around 125 to 130 handles a minute later, after one losing transaction of roughly twenty handles (1:03:32). Treating either figure as the session’s result would overstate what the source supports.
- Captions garble levels and terms. The prior settlement appears as “0.9511” where the intended value is evidently a level near 29,511 (1:57 versus 4:54). “Consequent encroachment” is rendered as “consequent corment” and “consequent encouragement”, and “first-presented fair value gap” as “first percent” or “first part”.
- Dates are consistent but not stated outright. The inventory lists the upload on 1 September 2026, and the spoken references to Monday 24 August, Tuesday 25 August, Wednesday 26 August and nonfarm payroll week fit a Tuesday session in that week. The transcript never states the calendar year, so the mapping is an inference from the calendar, not a quotation.
- Probability and tendency claims are framework language. The expected seventy percent likelihood for the gap midpoint, the seasonal tendency toward lower prices, and the reading of the daily imbalance are his interpretations. The captions cannot validate them, and no track record is shown for them in this source.
How a New Student Should Start Price Reading
Stripped of the proprietary labels, the exercise is a documented rehearsal method. Choose a session, write down the reference levels before price reaches them, state in advance what would confirm or invalidate your idea, note what you expected at each decision point, then replay the session and compare your notes with what happened. The discipline is in writing expectations down first and keeping the failures.
What the recording does not provide is evidence that any of these references produce a reliable edge, or that the narrated hypothetical outcomes could be reproduced. Its value is the structure of the practice and the vocabulary, not the numbers called out during it.
Watch the Original ICT Price Reading Recording
The lesson is embeddable and plays in the frame below; the player was tested from a BestProps page on 13 September 2026 (video element playing at 6.4 seconds with a reported duration of about 5,008 seconds and no error state) before this markup was saved. Everything you read above comes from the recording’s automatically generated captions, which support the speaker’s words but not his chart, his calculations or any trading result.
Primary source: How New Students Should Start Part 2, the recording this article paraphrases. The timestamp links above each point to the passage they describe.
ICT Price Reading Exercise Tools
Two parts of the method need specific platform behaviour rather than a market view: replaying price forward without seeing the outcome, and knowing where your chart draws session boundaries. The documentation below covers those mechanics.
Replay Price One Step at a Time
TradingView’s Bar Replay guide explains that after the replay panel opens, the chart enters a mode for selecting the starting point, that the Forward button advances the chart one step, and that the Jump to real-time chart button returns you to live data.[1] That is the mechanism that makes a “pause before each decision” exercise possible.
Know Which Price Session Your Chart Shows
TradingView’s note on session-break lines states that blue vertical lines on an intraday chart indicate session breaks, and that their display can be switched off in the chart’s Events settings.[2] Since this lesson depends on the difference between electronic trading hours and the regular session, confirm your template and time zone before attributing a move to the wrong session.
ICT Price Reading Sources
- [1] TradingView: How do I turn Bar Replay on?
- [2] TradingView: Session-break vertical lines on a chart
This is independent educational commentary on a publicly available recording. It is not official ICT material, not a tested trading system, and not a claim that any narrated result can be reproduced. Futures are leveraged and carry substantial risk. BestProps is not affiliated with TradingView or YouTube, and no source listed here endorses this article or any trading approach.
