
Key takeaways
In How New Students Should Start Part 1, ICT works through a beginner routine rather than a trade signal: filter an economic calendar for the week’s high-impact events, mark the prior month’s high, low and close on the September E-mini Nasdaq contract, carry those higher-time-frame levels onto every chart you use, keep separate layouts for…
Read the full summary
In How New Students Should Start Part 1, ICT works through a beginner routine rather than a trade signal: filter an economic calendar for the week’s high-impact events, mark the prior month’s high, low and close on the September E-mini Nasdaq contract, carry those higher-time-frame levels onto every chart you use, keep separate layouts for gaps and reference levels, reason out a step-by-step “draw on liquidity” with no entries required, and then record and replay a single session to write down what you expected before you saw what happened. He also says plainly that he does not teach trading with real money because he is not licensed to do so, and that funded-account challenges taken on without experience are gambling.
How we researched this article
BestProps used document-based research from primary firm sources, checked September 19, 2026. The complete source list, scope, limitations, and commercial-state record appear near the end of this article.
This article is written from the recording’s own timestamped captions. Everything market-related in it is ICT’s framework and his opinions, reported as such. Where the captions or his reasoning cannot support a claim, that is said in the text. Nothing here is investment advice.
What ICT Part 1 teaches new students
The session opens on the last day of August. He tells his son Caleb that a new month begins the following day, notes that the date is August 31, 2026, and frames the run into the year-end as a period when, in his opinion, price delivery tends to become cleaner because scheduled economic events pick up (0:10, 0:15).
The substantive promise of the lesson is narrower than that framing suggests, and he states it directly about an hour in: the exercise is figuring out, step by step, how to arrive at a draw on liquidity, and he says explicitly that no entries are required. He calls this the first thing a student is supposed to learn from him: knowing what you are looking for, why it should be there, which levels matter, and what would change the interpretation (54:27).
ICT students start with the economic calendar
He begins in his economic calendar tool and describes filtering it down to what matters for the market being studied, keeping the currencies relevant to the pair a forex trader would work and removing everything else so the list stays readable (0:44, 1:13). He sorts events by impact using the folder markers in the calendar, distinguishing low-impact entries from the ones he cares about and noting that low-impact events can still move price (1:43).
His stated purpose is not to predict the numbers. It is to identify when scheduled announcements may interfere with otherwise ordinary price behaviour, and he adds that the release time and the day both matter (5:00). Applied to that particular week, he reads Monday as a light calendar day where he has to rely on price action alone, and flags the following day for a 10:00 a.m. set of data. His instruction for a scheduled 10:00 driver is to wait out roughly the first 30 minutes of trading, let whatever liquidity or inefficiency sets up beforehand form, let the release hit, and then work with what is left in its wake (8:38).
He also offers a concrete illustration of how a partial exit could be staged if a student were marking the session hypothetically: with three micro contracts, one could come off at the first level reached, with the rest held against the same wick-and-body rules he is applying live (1:10:48).
ICT calendar claims that need a caveat
Two of his statements in the calendar segment are opinions, not findings, and they are reported here as opinions. He asserts that government economic data has been fabricated and is unreliable, and that it is revised later in a way he reads as proof of that (6:16). Later he attributes recent distortions in price precision to manipulation, fabricated data and geopolitical conflict (1:23:18). The cited caption passages do not substantiate either proposition, and this review did not verify them independently. Separately, his conclusion on the data is not really dependent on those claims: waiting out a release before engaging is a risk-management choice that stands on its own.
ICT students build patience before chasing setups
The part of the lesson aimed most directly at new students concerns restraint. He distinguishes two kinds of Monday. The Monday of a payroll week he treats as a session to be drilled, saying it is the one Monday where he tells students to be in their seat looking for a setup; any other Monday he calls hit-or-miss depending on experience (3:44). He also pushes back on the idea that he tells people never to trade on Mondays, and says the distinction he actually draws is the one above (7:44).
His warning to beginners is to stop demanding a setup from every session. He argues that whatever a student starts doing early tends to persist, so impatience, rushing, and the assumption of being right become habits rather than one-off errors, and that carrying that emotional weight early is what makes people quit (4:08). His specific instruction for payroll weeks is to avoid trading the Thursday and Friday, describing the window up to 11:00 a.m. Eastern on the Wednesday as the safer part of that week, and he applies the same rule to his son by saying a beginner should not be trying a demo account on that Thursday or Friday (6:52, 9:07). This is his personal guidance as stated in the recording. This caption-based review does not establish its performance, and it is not presented here as an established property of payroll weeks.
ICT students prepare charts from the top down
The chart demonstration starts on the daily Nasdaq chart, which he identifies as the September delivery contract of the E-mini Nasdaq. He wants the highest high and the lowest low of each daily range visible, and he says this preparation is something a student should be doing on a Saturday evening or a Sunday afternoon before the market opens, and that it takes very little time compared with the explanation of why it matters (10:04, 10:40).
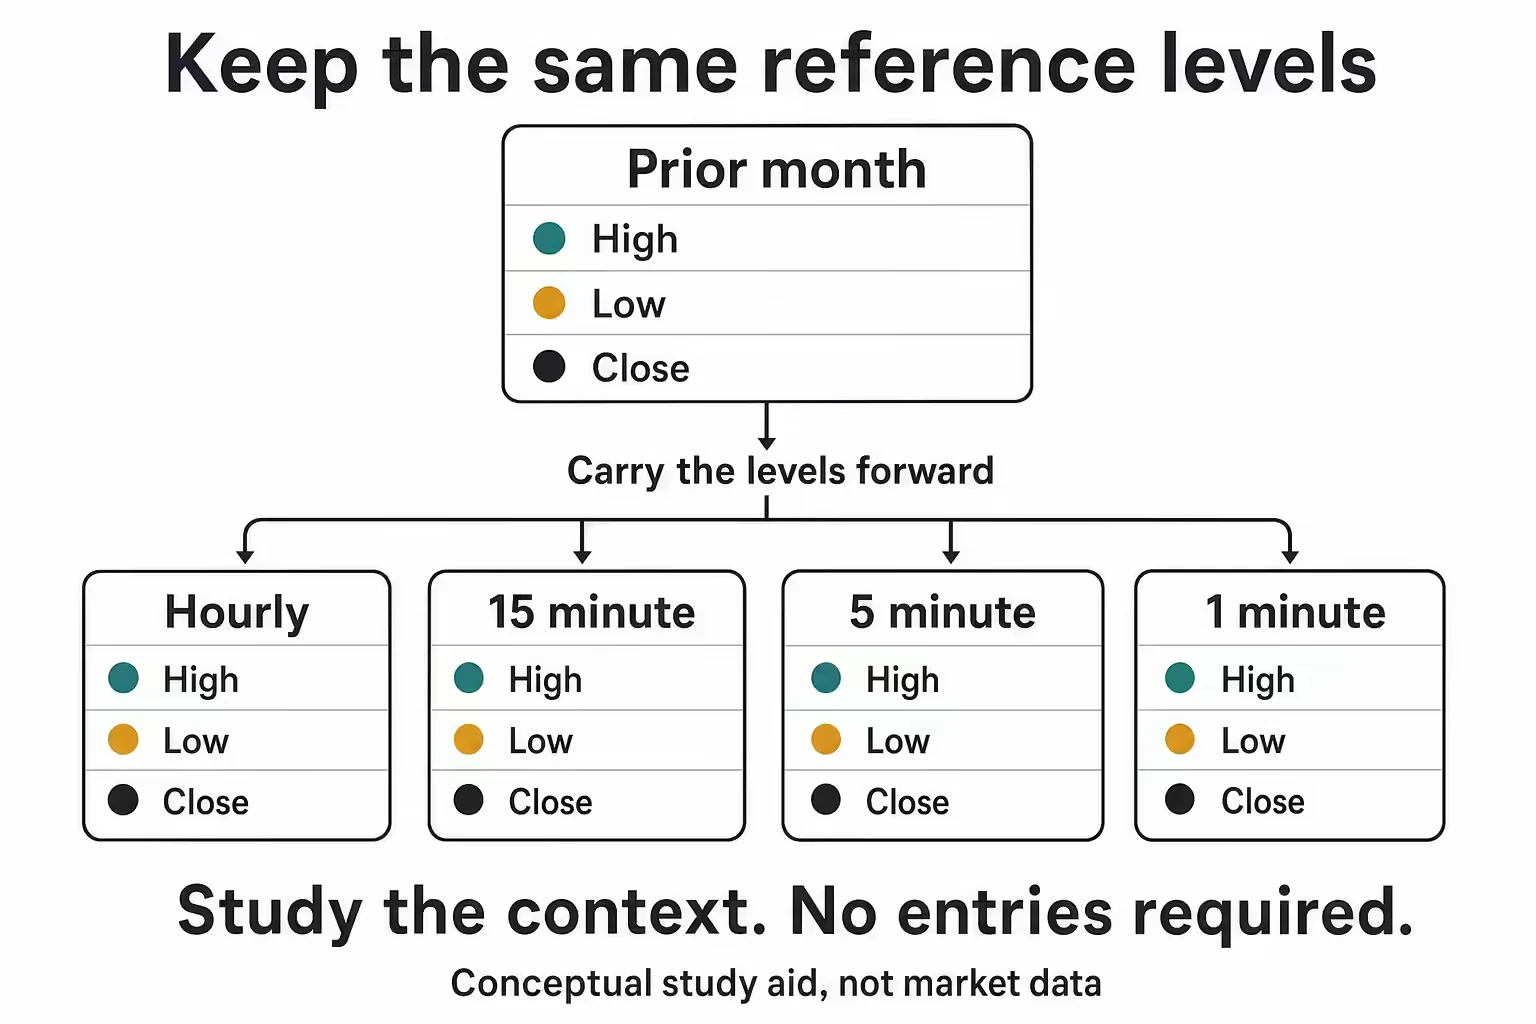
He is explicit that he is not trying to trade live price while doing this; the point is getting a feel for what he should be doing on a week-by-week basis (10:32). He switches to the monthly chart to mark July’s high, low and close, then carries those reference levels into the lower time frames. August is still in progress during the lesson: he adds its high and low but says its closing level must wait until the session ends. The practical distinction is between a completed month’s fixed references and a current month whose final close is not yet known (11:34, 15:11).
Separate chart layouts for ICT students
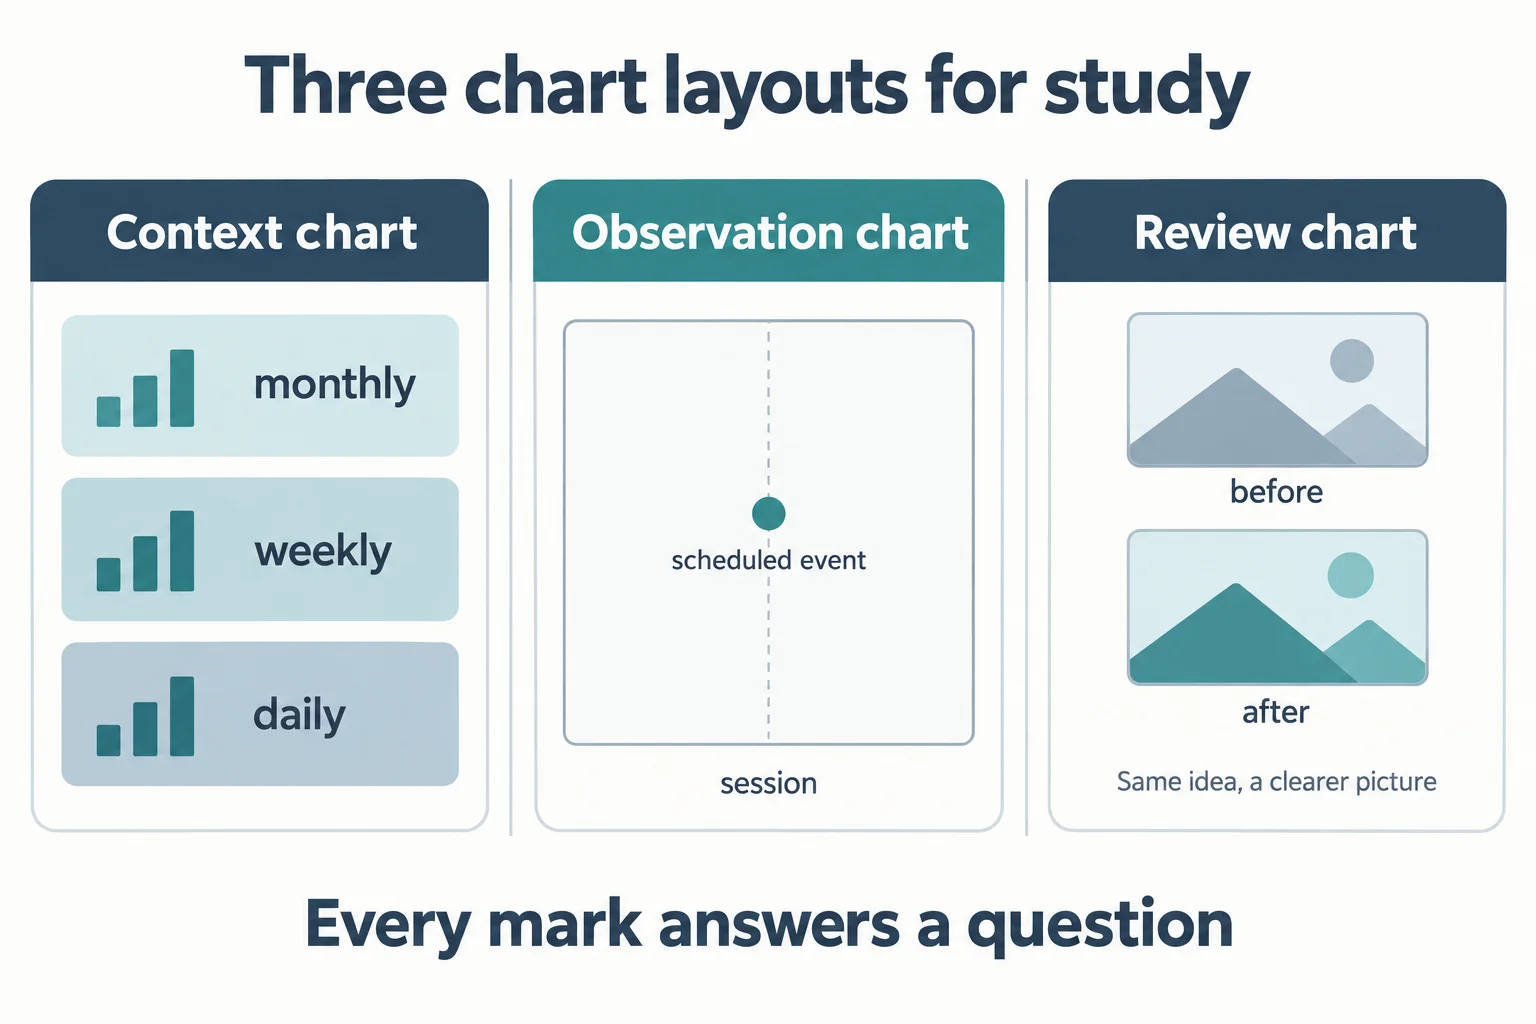
His answer to chart clutter is organisation rather than deletion. He shows a workspace that holds one category of levels and says he can toggle between them at a glance, including separate layouts for new week opening gaps, new day opening gaps, and first presented fair value gaps, and demonstrates creating a new layout (18:19, 18:41). The discipline he is modelling is consistency of colour, label and line weight so that each level’s origin stays identifiable, and keeping the deliberately sparse chart separate from the heavily annotated one.
ICT students map liquidity without entering trades
With the chart organised, he walks down through the hourly, 15-minute, five-minute and one-minute views, naming nearby highs, lows, gaps and higher-time-frame ranges as candidate levels price might seek. He is careful about the status of this exercise: what he is fleshing out is how to arrive at a draw on liquidity step by step, with no entries required (54:27).
A conditional structure runs through the whole session. Rather than treating every marked level as a trade, he describes what he wants to see at each one: whether candle bodies stay below a midpoint for a short-side read, whether movement accelerates or stalls, and what would invalidate the idea. He describes wicks as useful markers for measuring continuation, says he wants a short position’s bodies to stay below the midpoint rather than merely spike into the upper half, and puts a price on pain tolerance by asking how much adverse movement he would be feeling and whether the retracement still looks reasonable at that point (58:40, 59:07).
Later in the session he reasons through a hypothetical stop-out and a hypothetical partial exit on the same charts. Those passages are teaching examples, not verified fills. The video description also states that the performance displayed is hypothetical, with limitations including hindsight and the absence of actual financial risk. This caption-based review did not examine account statements, order records or every video frame. The transcript establishes what he said, not what was executed, and not whether the framework has an edge.
The ICT student assignment to record, replay and journal
The most concrete homework in the lesson comes near the end. For students who work during the day, he suggests letting screen-recording software run on a one-minute chart through the session, then sitting down afterwards to watch the recorded tape instead of the live one (1:47:56). The advantage he emphasises is the ability to pause: stop the playback, write down what you expect price to do and what it should not do, then resume and compare (1:48:39). He suggests doing that repeatedly through the first hour of the session, between 9:30 and 10:30 a.m. (1:48:48).
He then extends the assignment to a journal. Whenever he states in the recording that he wants to see something happen, or that he is watching for a particular reaction, he asks the student to screenshot that moment, annotate the levels involved on their own chart, and type out the reasoning in their own words; for example, that price closed above the regular-trading-hours opening-range-gap high, so trading the stops above and then returning into the gap is a reasonable expectation (1:55:04). That converts watching into a documented experiment with a before-and-after record, which is the point of the lesson.
ICT on demo trading and funded challenges for new students
Two disclosures are worth keeping separate from the chart material. The first is about scope: he says he teaches students to engage with paper trades or to highlight trades hypothetically, because he does not teach people how to trade with real money and is not licensed to do so (1:10:21).
The second is about sequencing. He tells students to start reasonably and humbly, and describes taking on funded-account challenges without the experience to justify measuring the result as gambling (1:13:37, 1:13:56). Whatever a reader makes of the rest of this session, that position is consistent with the assignment it sets: preparation, observation documentation and replay before execution.
ICT beginner routine takeaways
Set aside the terminology and the lesson still contains a usable beginner routine:
- Read the week’s scheduled events before you read the chart, and write down the day and time of the ones that matter.
- Decide in advance which sessions you are not yet equipped to trade, and treat sitting out as a planned outcome.
- Prepare higher-time-frame levels on the weekend, and carry them into every lower time frame you use.
- Keep annotation sets in separate layouts so the hierarchy stays legible.
- Describe the sequence you expect and the condition that would break it, without taking the trade.
- Record a single session, replay it, and pause to write your expectation before you see the result.
- Journal screenshots at your decision points, with your own reasoning, so the record shows process as well as outcome.
Watch ICT How New Students Should Start Part 1
The source lesson is How New Students Should Start Part 1 from The Inner Circle Trader. ICT dates the lesson August 31, 2026 in his opening remarks. This article is independent educational commentary grounded in the captions; it is not an official ICT publication, not a transcript, and not a summary that ICT has reviewed.
Watch the original lesson on YouTube
Watch the full lesson on ICT’s YouTube channel. The timestamp links throughout this article open the relevant passages in the original recording.
Tools for practising the ICT student routine
The practical parts of this lesson depend on doing a small amount of work consistently. These references cover the source itself, how to replay a session honestly, and how to turn observations into a written rule.
The ICT lesson and its unofficial archive
The authoritative version is the recording on ICT’s own channel, and the timestamp links in this article point into it. A third-party page, ICT Archivist’s write-up of the same session, is an unofficial archive maintained by someone else. It is not an ICT publication and BestProps has not verified its contents against the recording, so use it for orientation only and prefer the video for any detail that matters.
Replay an ICT study session before trading it
TradingView’s Bar Replay guide describes opening the replay panel, choosing a starting point, and stepping the chart forward one bar at a time, offering an alternative way to pause and form an expectation before advancing. This is a separate study tool, not the screen-recording method ICT assigns in this lesson. One caution the guide itself makes relevant: orders from Paper Trading and other brokers are executed on real-time data while the chart is in replay mode, so keep the replay and any order tool separate or the exercise stops being a simulation.
Write the ICT study rule before testing it
TradingView’s Pine Script documentation describes strategies as scripts that simulate trades across historical and realtime bars for backtesting and forward testing. That is the step that turns the journal described above into something testable, because expressing a setup as explicit conditions forces the definitions to be fixed before the outcome is known. Simulated results depend on fill assumptions and are not evidence of live profitability.
BestProps is not affiliated with The Inner Circle Trader, ICT Archivist or TradingView, and no source listed here endorses this article or the ICT methodology. Nothing in this article demonstrates a profitable or repeatable result, and no claim is made that anyone tested the process described above. Futures are leveraged, and the calendar and session conventions referenced here change over time, so verify them for the instrument and account you actually use.