
Key takeaways
The Inner Circle Trader’s 880-second YouTube review analyzes the 2 September 2022 E-mini S&P 500 futures session through ICT liquidity, fair value gap, order block and Power of Three concepts.
Read the full summary
The Inner Circle Trader’s 880-second YouTube review analyzes the 2 September 2022 E-mini S&P 500 futures session through ICT liquidity, fair value gap, order block and Power of Three concepts. On nonfarm-payroll Friday, which ICT says he normally avoids trading because the eight thirty a.m. New York release can cause severe slippage, price moved through a bullish order block into relative equal highs, swept presumed buy-side liquidity and rejected toward a previously marked daily fair value gap. He interprets the consolidation near the highs as a failed bull flag because of its location, then highlights a sweep above the 4017.75 reference level, cites an unverified 4019.25 high and shifts focus to sell-side liquidity below as price expands downward. His bearish Power of Three model comprises accumulation around an initial range, manipulation into a premium array and distribution toward discount, mapped to an open, high, low, close sequence. The main lesson at 11 minutes 31 seconds is to target the middle or meat of a confirmed directional move rather than its exact high or low. The article is based on automatic speech recognition without usable captions or access to the charts, so displayed prices, fills, social-media levels, participant motives and any trading edge remain unverified.
How we researched this article
BestProps used document-based research from primary firm sources, checked September 24, 2026. The complete source list, scope, limitations, and commercial-state record appear near the end of this article.
In ICT Emini S&P 500 AM & PM Session Review – 09/02/22, ICT reviews the E-mini S&P 500 futures session associated with the September 2, 2022 nonfarm-payroll release. He explains the day through his concepts of liquidity, fair value gaps, order blocks, failed continuation patterns, and Power of Three.
This is a retrospective explanation of ICT’s market interpretation, not independent proof that these concepts provide a trading edge. The transcript also cannot verify the chart’s displayed prices, any reported fills, or material referenced from an earlier video and social-media posts.
ICT Emini Session Context and Key Levels
ICT begins by pointing to chart levels that he says were established in the previous evening’s analysis: a high, a fair value gap, and an older daily low (0:36). He says he had been interested in relative equal highs and was not initially bearish; in his framework those highs represented a possible upside draw because resting buy stops could be located above them (1:11, 1:18).
He also stresses that this was a nonfarm-payroll Friday. Although he says he engaged with the market to illustrate his concepts, he repeatedly discourages trading the release itself (1:41). Around 2:59, he identifies the 8:30 a.m. New York release and warns that attempting an entry at that moment can lead to severe slippage and a poorly placed fill (3:04).
ICT Emini Morning Session Buy-Side Liquidity
ICT describes price first interacting with what he identifies as a bullish order block and then moving toward relative equal highs (2:09). He says the market reached those highs, bumped buy-side liquidity, and rejected, returning toward a fair value gap he had marked the night before, in his phrasing, from premium back to discount (2:16, 2:23).
He defines buy-side liquidity as pending buy stops resting above highs, which can be a single high or a group of relative equal highs (3:25). He says retail treats such a level as resistance and places stops there, and that larger participants leave stops at that level too, which is why he says the market goes right to it (3:35). That is ICT’s interpretive model: the transcript supports the explanation he gives, but it does not independently establish the identity or motives of the participants involved.
ICT Emini Bull Flag Failure
After the rally, ICT highlights a consolidation that he says would look like a conventional bull flag to someone who did not know the level above (4:07). At 4:20, he argues that the location mattered more than the pattern’s appearance: because the consolidation formed after price had reached his designated liquidity area, he classifies it as a false bull flag rather than a reliable continuation setup (4:25).
His broader lesson is to evaluate a chart pattern in relation to its surrounding levels. In this example, a failure to continue above the swept high shifted his attention from liquidity above the market to lows below it.
ICT Emini Session Shift at 4017.75
ICT discusses a horizontal level at 4017.75 that he says he also posted on social media (6:28). He explains that price moved slightly above the level, consolidated, and then failed to continue higher (6:52). He gives the high as 4019.25 but explicitly tells viewers to check it rather than take his word for it (6:44). Without the chart or exchange data, that exact high should be treated as unverified.
At 7:07, ICT characterizes the action as a sweep followed by price remaining below the reference level, which he reads as a failure to go higher rather than a continuation pattern (7:21). He then identifies multiple lows as sell-side liquidity objectives and says the market ultimately traded lower into the daily fair value gap (7:38, 7:41).
ICT Emini Afternoon Session Downside Expansion
Moving into the midday and afternoon action, ICT notes that lunch-hour trading usually retraces, and uses that expectation to focus on the lows below rather than the highs above (8:13). From approximately 7:58, he describes an advance from a 10 o’clock bullish order block and fair value gap, followed by consolidation and a later break toward old lows, and he notes unfinished business above a high with relative equal highs nearby (8:05).
He then identifies several formations within the decline, including fair value gaps and what he calls a rejection block (8:58). These labels depend on the chart shown in the video and ICT’s definitions; the transcript alone does not provide enough visual information to reconstruct their precise boundaries. He also says the afternoon timing was earlier than he preferred and repeats that he would not normally trade on nonfarm-payroll day (8:48).
ICT Emini Session Power of Three
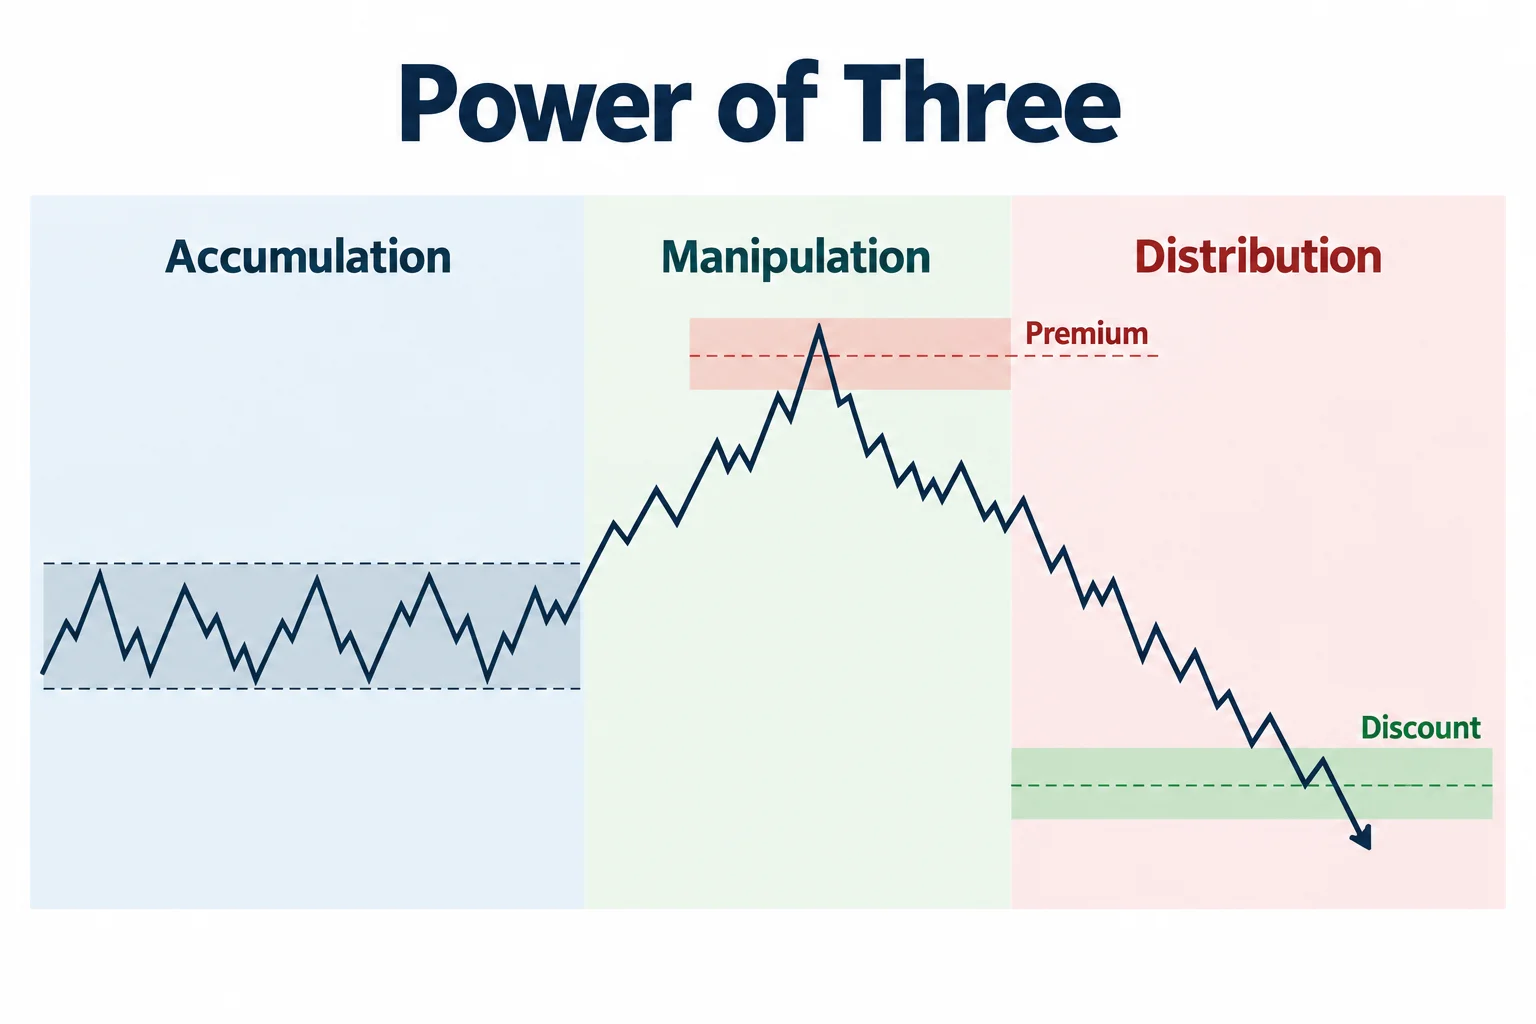
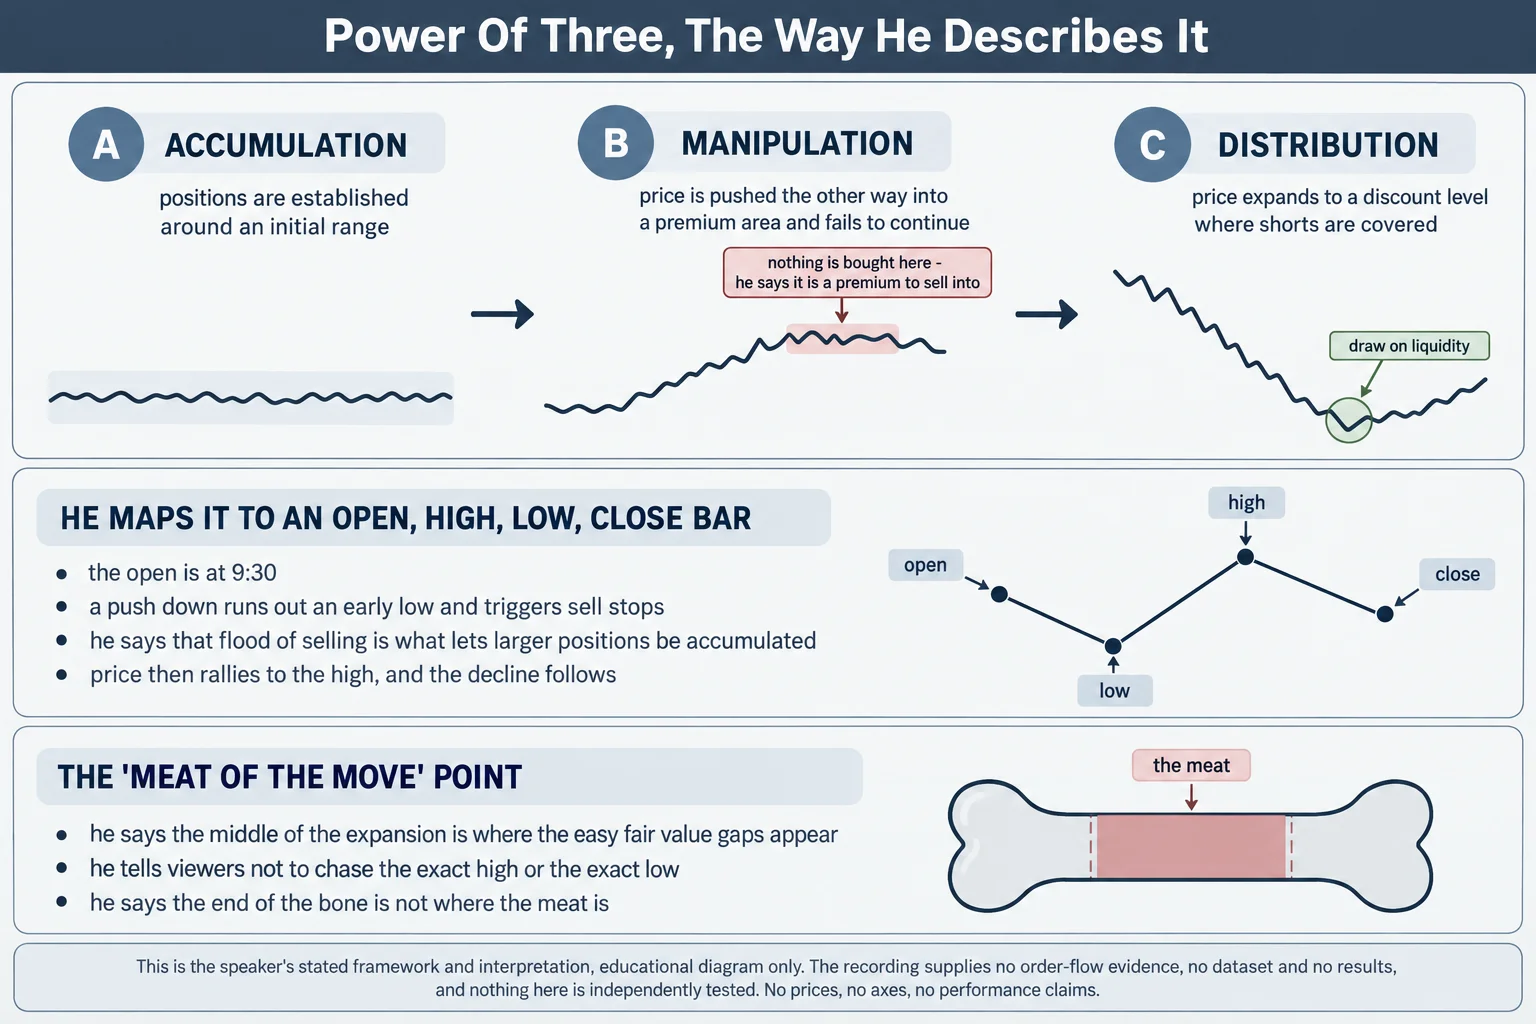
At 9:15, ICT relates the session to his Power of Three concept, noting that long-time traders will recognize the shape as an open, high, low, close bar (9:20). For a bearish structure he describes three broad phases (9:33, 11:13):
- Accumulation: he says positions are established around an initial range (10:35).
- Manipulation: price moves up into what he calls a premium array and fails to continue higher (9:42).
- Distribution: price expands down to a discount level he treats as the draw, where shorts are bought back (9:49, 9:56).
ICT maps this idea onto an open-high-low-close sequence. In his account, the rally into a premium array supplied the bearish setup, the decline represented expansion, and the move toward the lower objective provided an area where shorts could be bought back (10:04, 11:07). He describes an early push down that runs out a short-term low and triggers sell stops, and argues that the resulting flood of selling is what allows larger positions to be accumulated (12:13, 12:28). His statements about “smart money” accumulating and distributing positions are part of his explanatory framework; the transcript does not contain order-flow evidence identifying who traded or why.
ICT Emini Session Trading Lessons
Near 11:16, ICT says the middle portion of a directional move may offer clearer fair-value-gap examples than trying to capture the exact high or low (11:31). His “meat of the move” analogy (that the meat is not at the end of the bone) emphasizes waiting for the directional thesis to receive confirmation rather than pursuing every turning point (11:38).
The session review therefore connects three ideas: mark potential liquidity before the session, observe whether price accepts or rejects after reaching those levels, and use subsequent imbalances or retracements to study the directional expansion. These points are best treated as material for chart review and hypothesis testing. They are not investment advice, and the video does not demonstrate general profitability or guarantee that similar formations will behave the same way in other sessions.
Watch the ICT Emini Session Recording
ICT Emini S&P 500 AM & PM Session Review – 09/02/22
The Inner Circle Trader · watch page lists upload 2 September 2022 · 880 seconds, about 14 minutes 40 seconds. This recording is the primary source for every timestamp link on this page.
The recording is not embedded here. An embedded player was tested directly on 15 September 2026 from a BestProps page origin at desktop and mobile widths: the frame loads and then reports “Playback on other websites has been disabled by the video owner,” with no duration and no playback progress, while the video itself plays normally on YouTube. No half-working player is left on this page.
The watch page was read on 15 September 2026 and is publicly listed as ICT Emini S&P 500 AM & PM Session Review – 09/02/22 by The Inner Circle Trader, with an upload timestamp of 2 September 2022, not private and not unlisted, and a listed duration of 880 seconds, about 14 minutes 40 seconds, against a transcribed audio duration of 880.4 seconds.
ICT Emini Session Resources
These are the sources checked for this article. The regulator and investor-education pages are general material on assessing trading systems sold to the public and on short-term trading risk. None of them evaluates this speaker, and none of them verifies the liquidity reading, the failed bull flag, the reference level or the Power of Three mapping described above. Any ICT, smart-money or third-party indicator, script, note set, chart annotation, transcript pack or re-upload circulating outside the publishing channel’s own page is unofficial and has not been tested here.
- ICT Emini S&P 500 AM & PM Session Review – 09/02/22 The Inner Circle Trader (primary source and the recording transcribed for this article; watch page read 15 September 2026, listed duration 880 seconds).
- The Inner Circle Trader (official YouTube channel) (read 15 September 2026), the publishing channel for the review series this recording belongs to.
- CFTC (Commodity Trading Systems Sold on the Internet) (read 15 September 2026), the regulator’s guidance on assessing trading systems sold to the public, including its warning that hypothetical results typically simulate trades using prices that occurred in the past.
- Investor.gov (U.S. SEC), Day Trading (read 15 September 2026), the regulator’s definition, which states that day trading is extremely risky and can result in substantial financial losses in a very short period of time.
ICT Emini Session Transcription Note
There was no usable caption track for this recording, so the transcript behind this article is an automatic speech-recognition pass over the full original audio, not human-verified captions and not YouTube’s own captions. The pass covered the complete audio, reported no low-confidence characters and a maximum level of -3.8 dB, and returned a duration of 880.4 seconds against the watch page’s listed 880 seconds. Because the text is machine-recognised, terminology was checked against context rather than trusted as printed: the audio renders “not Farm Payroll” for non-farm payroll, “buy-sell liquidity” where he is naming buy-side liquidity, and “the deal chart” where he says the daily chart; the phrase “Texas sell side” appears where the surrounding passage is about the sell side being taken. The charts themselves were not available to this review; only the spoken description was, so the displayed prices, the marked levels and the social-media posts he refers to were not independently verified.
Source: ICT, ICT Emini S&P 500 AM & PM Session Review – 09/02/22, The Inner Circle Trader, 2 September 2022. Educational commentary, not investment advice. The liquidity reading, the failed bull flag, the reference level, the liquidity objectives and the Power of Three mapping are the speaker’s own narrated interpretation, reported with no independently verified chart prices, fills or account results.