
Key takeaways
The Inner Circle Trader reviews a bearish E-mini S&P 500 morning trade from 6 September 2022 across daily, hourly, five-minute and one-minute charts, reporting a six-contract short at 3940.25, a two-contract partial exit after more than 10 index points or 40 ticks, and a 3918.00 limit exit for the remaining four contracts, 22.25 points below…
Read the full summary
The Inner Circle Trader reviews a bearish E-mini S&P 500 morning trade from 6 September 2022 across daily, hourly, five-minute and one-minute charts, reporting a six-contract short at 3940.25, a two-contract partial exit after more than 10 index points or 40 ticks, and a 3918.00 limit exit for the remaining four contracts, 22.25 points below entry. ICT framed sell-side liquidity as the directional draw, watched price revisit a fair value gap around 3 minutes 20 seconds, used the midpoint of a projected range to select a bearish objective below 3920 around 6 minutes 27 seconds, and interpreted the 9.30 opening move as a Judas swing followed by bearish displacement. He emphasizes planned partial profits and practical exits rather than capturing the full decline, while warning that post-holiday sessions can be difficult and that traders should not blindly follow online personalities with live funds. The 705-second YouTube recording was published by The Inner Circle Trader and lasts about 11 minutes 45 seconds, but its chart markings, fills, slippage, commissions and account results were not independently verified.
How we researched this article
BestProps used document-based research from primary firm sources, checked September 24, 2026. The complete source list, scope, limitations, and commercial-state record appear near the end of this article.
In ICT Emini S&P 500 AM Session Review – 09/06/22, ICT reviews a bearish morning scenario using daily, hourly, five-minute, and one-minute charts. His explanation moves from higher-time-frame liquidity and imbalance concepts to a reported short execution and partial exits.
The central lesson is not that traders should capture an entire decline. ICT instead emphasizes defining a directional idea, waiting for opening-price behaviour to support it, selecting a nearby objective, and accepting an intentionally incomplete portion of the move. The transcript contains ICT’s account of his own orders, but it does not independently verify the chart annotations, fills, account results, or what happened after the review.
ICT Emini 500 Higher Time Frame Context
ICT begins on the daily chart at 0:12. He says price had previously swept a level, broken lower, and returned to an imbalance that failed to support price. He then identifies an old daily low, an order block, relative equal lows, and trading below liquidity associated with the prior holiday session (1:04).
At 1:12, he shifts to the hourly chart. In his interpretation, price visited an imbalance more than once, moved above relative equal highs, broke lower, and later returned toward a fair value gap. He describes sell-side liquidity as the directional draw (1:19).
These labels belong to ICT’s market framework. They should be understood as his reading of the session rather than independently established evidence that price must move toward a particular level.
Why ICT Found the Session Difficult
A substantial part of the review concerns restraint. Beginning around 1:33, ICT explains why he avoided immediately publishing a trade idea, saying he did not want to put viewers “in harm’s way.” He characterizes morning sessions following a market holiday or shortened session as potentially problematic for inexperienced participants (1:48), and he warns that an initial loss can lead to an attempt to recover immediately, creating additional drawdown (2:11).
He also tells viewers not to follow an online personality blindly or use live funds when they do not understand the underlying logic (4:49). This caution is one of the clearest broadly applicable educational points in the recording: recognizing terminology is not the same as being able to manage uncertainty, adverse movement, or risk.
ICT Emini 500 Bearish Session Setup
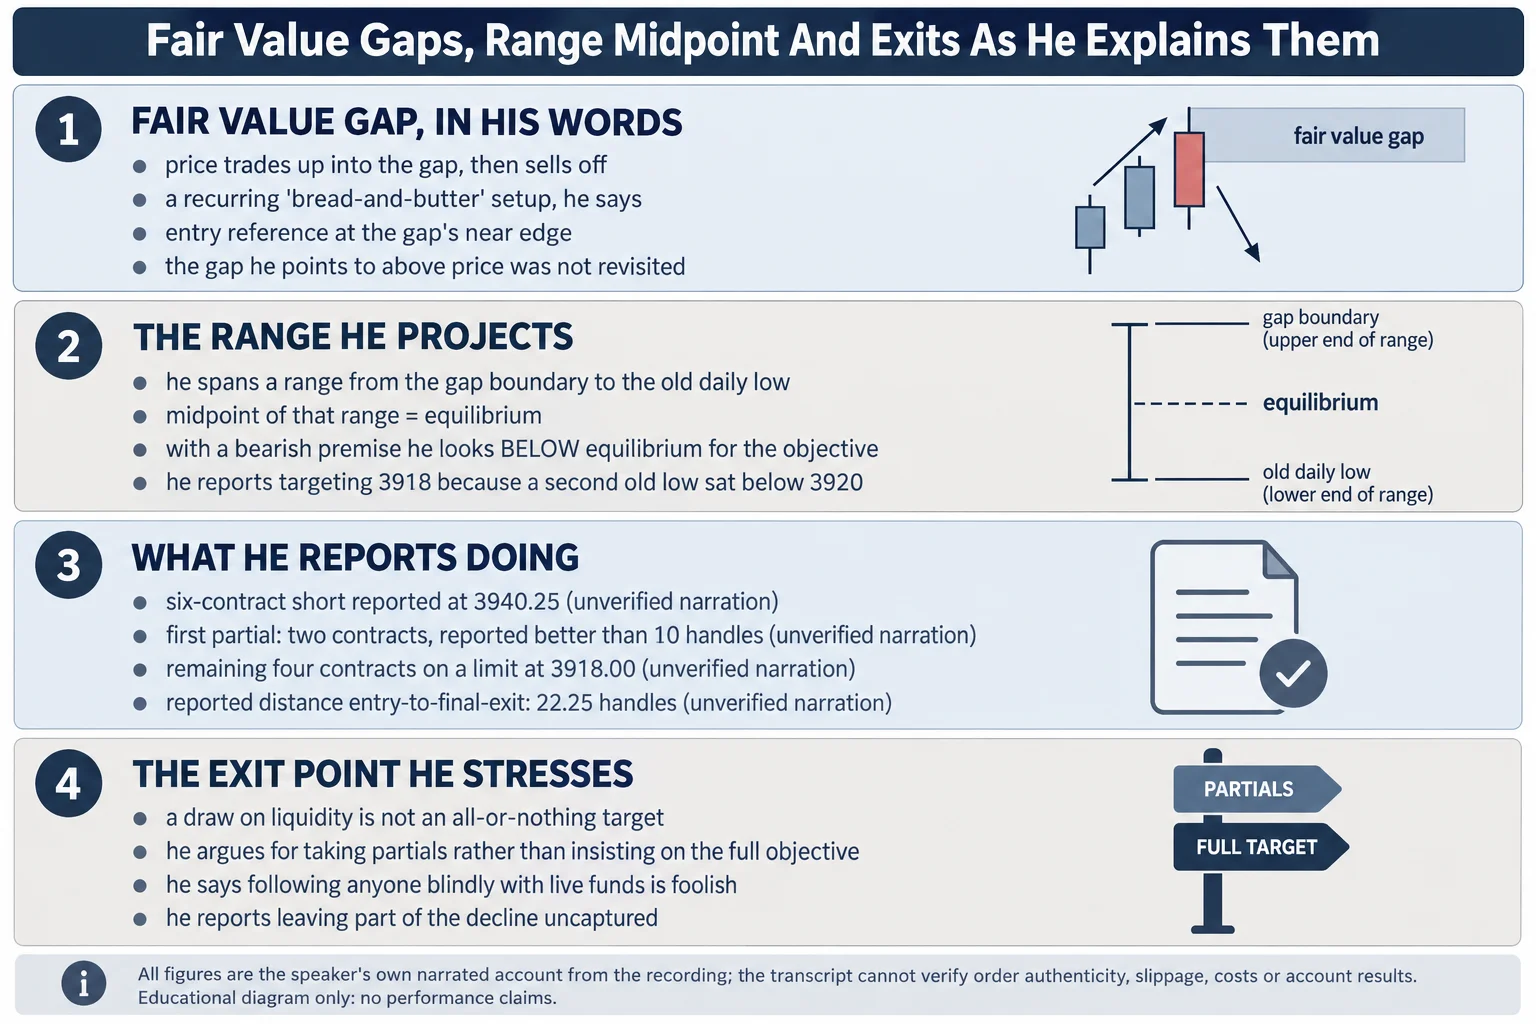
At 3:20, ICT points to a small fair value gap that price revisited before selling off (3:24). He calls this a recurring or “bread-and-butter” type of setup. His projected dealing range extended from a fair value gap boundary toward an old daily low and liquidity from Monday’s session (4:11).
On the five-minute chart at 5:45, he highlights an old low being broken and then retested from below. A separate imbalance above price was not revisited (5:59). ICT says he would have considered another short entry if price had returned to that area, but according to his narration, it did not (6:04).
He then applies the midpoint, or equilibrium, of his selected range (6:27, 6:33). In ICT’s terminology, a trader holding a bearish premise would look below that midpoint for an objective (6:38). He identifies a second old low below 3920 and says this was why his limit order targeted 3918 (7:03). This is a retrospective explanation of ICT’s level selection, not a general rule that every old low or below-equilibrium price will be reached.
ICT One Minute Opening Setup
ICT says he did not know before the open exactly what price would do. He explains that he waited to observe the opening and interpreted the subsequent displacement as confirmation of the bearish scenario (7:29).
On the one-minute chart at 8:19, ICT labels the 9:30 move higher a “Judas swing.” In his account, that move reached a fair value gap boundary before price broke lower (8:35). He describes entering during that sequence and remaining willing to add if price retraced into another gap (8:51), although according to his narration that additional retracement did not occur.
ICT Emini 500 Trade Execution and Exits
Near 10:43, ICT gives the numerical details of the trade he says he executed:
- A six-contract short entry at 3940.25.
- A first partial exit of two contracts after the move exceeded 10 index points, described in the transcript as 40 ticks.
- A limit exit for the remaining four contracts at 3918.00.
- A reported distance of 22.25 index points from entry to the final exit.
These figures are claims made by ICT in the recording. The transcript alone cannot establish order authenticity, slippage, commissions, account-level profit, or whether the chart displayed every relevant execution.
ICT Emini 500 Session Takeaways
At 9:17, ICT stresses that a directional liquidity objective does not have to become an all-or-nothing exit target. He argues for taking partial profits and closing at a practical nearby level rather than insisting on capturing the session’s full move. He later notes that his exit left part of the subsequent decline uncaptured.
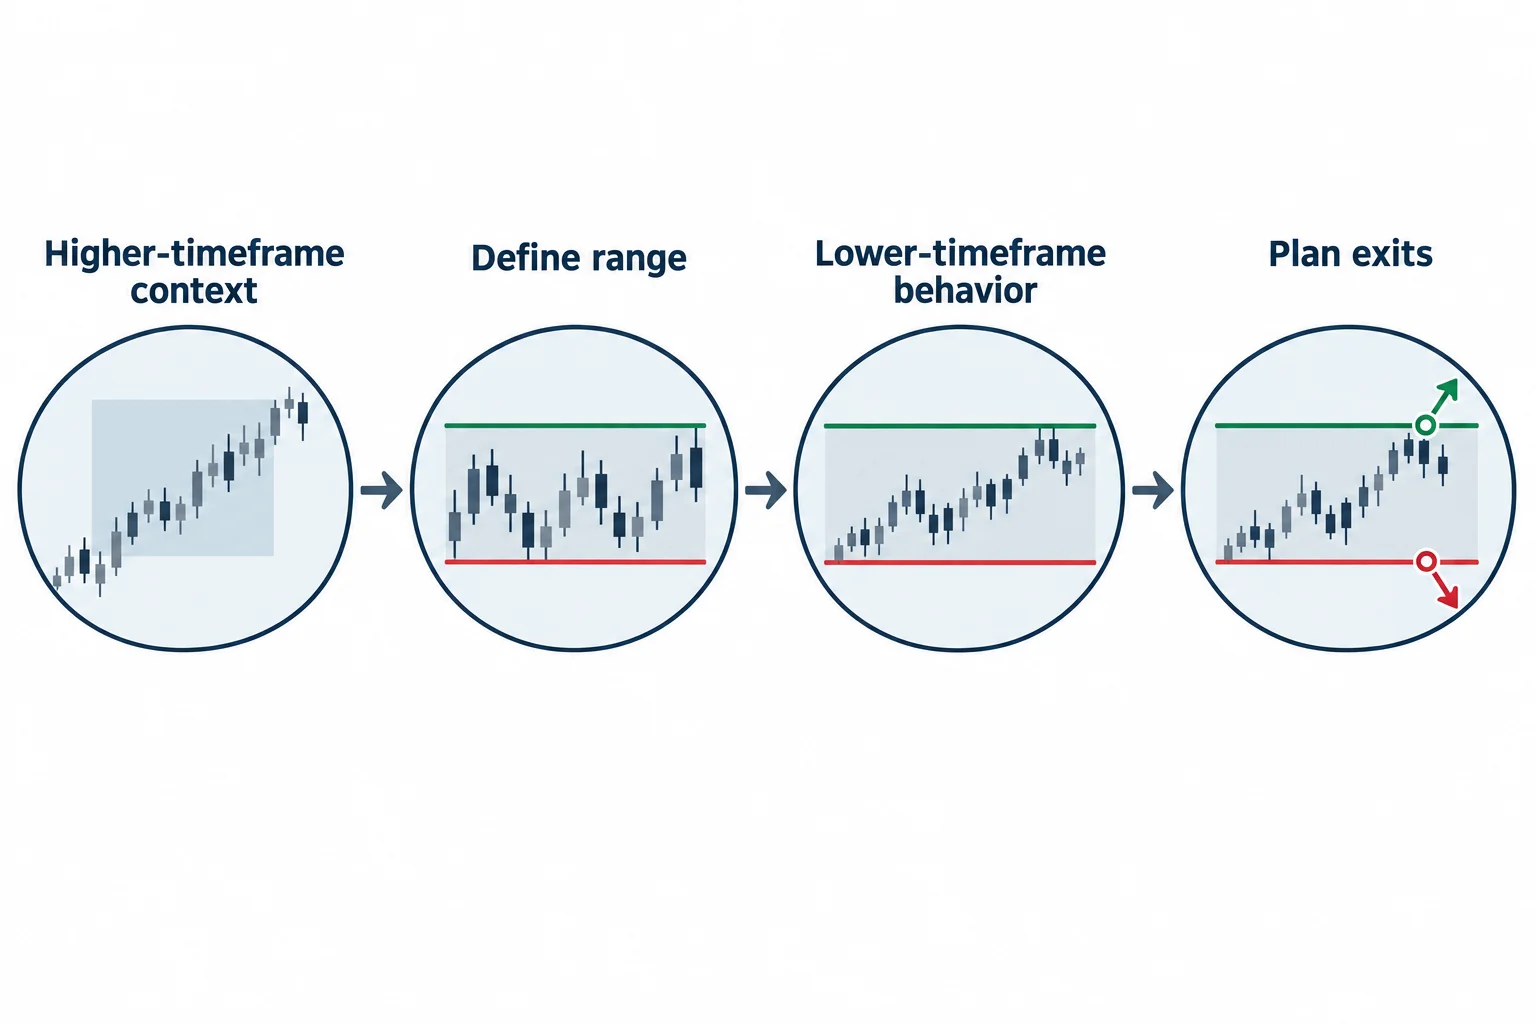
More generally, the review illustrates a top-down analytical workflow: establish context on higher time frames, define a range and directional hypothesis, wait for lower-time-frame behavior, and plan exits before becoming fixated on an extreme target. That workflow can be studied as an example of structured decision-making, but this single narrated session does not demonstrate consistency or profitability. Futures trading involves substantial risk, and the video should be treated as educational market commentary rather than investment advice or a performance promise.
Watch the ICT Emini 500 Session Recording
ICT Emini S&P 500 AM Session Review – 09/06/22
The Inner Circle Trader · watch page lists upload 6 September 2022 · 705 seconds, about 11 minutes 45 seconds. This recording is the primary source for every timestamp link on this page.
The recording is not embedded here. An embedded player was tested directly on 15 September 2026 from a BestProps page origin at desktop and mobile widths: the frame loads and then reports “Playback on other websites has been disabled by the video owner,” with no duration and no playback progress, while the video itself plays normally on YouTube. No half-working player is left on this page.
The watch page was read on 15 September 2026 and is publicly listed as ICT Emini S&P 500 AM Session Review – 09/06/22 by The Inner Circle Trader, with an upload timestamp of 6 September 2022, not private and not unlisted, and a listed duration of 705 seconds (about 11 minutes 45 seconds), against a transcribed audio duration of 705.4 seconds.
ICT Emini 500 Session Resources
These are the sources checked for this article. The regulator and investor-education pages are general material on assessing trading systems sold to the public and on short-term trading risk. None of them evaluates this speaker, and none of them verifies the chart read, the range construction, the reported orders or the reported exits described above. Any ICT, smart-money or third-party indicator, script, note set, chart annotation, transcript pack or re-upload circulating outside the publishing channel’s own page is unofficial and has not been tested here.
- ICT Emini S&P 500 AM Session Review – 09/06/22 The Inner Circle Trader (primary source and the recording transcribed for this article; watch page read 15 September 2026, listed duration 705 seconds).
- The Inner Circle Trader (official YouTube channel) (read 15 September 2026), the publishing channel for the review series this recording belongs to.
- CFTC, Commodity Trading Systems Sold on the Internet (read 15 September 2026), the regulator’s guidance on assessing trading systems sold to the public, including its warning that hypothetical results typically simulate trades using prices that occurred in the past.
- Investor.gov (U.S. SEC), Day Trading (read 15 September 2026), the regulator’s definition, which states that day trading is extremely risky and can result in substantial financial losses in a very short period of time. Relevant to a review built entirely on short-term trade management.
ICT Emini 500 Session Transcription Note
There was no usable caption track for this recording, so the transcript behind this article is an automatic speech-recognition pass over the full original audio, not human-verified captions and not YouTube’s own captions. The pass covered the complete audio, reported no low-confidence characters and a maximum level of -2.3 dB, and returned a duration of 705.4 seconds against the watch page’s listed 705 seconds. Because the text is machine-recognised, terminology was checked against context rather than trusted as printed: where the audio produces “fair bay gap” the surrounding discussion is about fair value gaps throughout, the “Judah swing” of the one-minute section is the pattern ICT calls a Judas swing, and the passage written as “SIBI, self-signal balance, buy-signal efficiency” is the sell-side-imbalance / buy-side-inefficiency label as spoken. The charts themselves were not available to this review; only the spoken description was, so the chart markings he narrates (the levels, the gap boundaries and the displayed executions) were not independently verified.
Source: ICT, ICT Emini S&P 500 AM Session Review – 09/06/22, The Inner Circle Trader, 6 September 2022. Educational commentary, not investment advice. The liquidity reading, the range construction, the entry and exit levels and the reported partial exits are the speaker’s own narrated account, reported with no independently verified fills, order authenticity, costs or account results, and the chart levels he narrates were not independently verified.
