
Key takeaways
ICT Price Action Model 7 presents an unverified bearish sell-side framework for low-resistance liquidity runs using five stages of preparation, opportunity discovery, trade planning, execution, and management.
Read the full summary
ICT Price Action Model 7 presents an unverified bearish sell-side framework for low-resistance liquidity runs using five stages of preparation, opportunity discovery, trade planning, execution, and management. Preparation reviews medium- and high-impact calendar events plus the prior 20, 40, or 60 trading days excluding Sundays, marks the highest high and lowest low as a dealing range, and identifies a lower liquidity draw or discount PD array. Opportunities include a market maker sell model targeting its lower terminus and the declining phase of a market maker buy model moving toward discount before a possible rally. Planning seeks a volatility-driven retracement into a premium fair value gap or raid above buy stops, followed by an institutional order flow entry drill on a five-minute chart around a five- or 15-minute premium area during the London or New York open. Management uses multiple demo positions at a common entry, a stop beyond a referenced high, staged 20, 40, and 60 pip objectives, and progressive risk reduction. A hypothetical $20,000 account risks 1.5% with a 20-pip stop, uses micro, mini, or standard lots while rounding size down, halves the risk percentage after a full-risk loss until half that loss is recovered, and reduces risk again after five consecutive wins. ICT asks students to backtest multiple samples but provides no sample size, results, costs, or out-of-sample validation. His algorithmic theory distinguishes faster severe continuation declines from controlled demolition toward discount within a broader buy model, cites crude oil trading below zero as evidence targets can be exceeded, and warns that rapid repricing can gap through stops and cause substantial slippage.
How we researched this article
BestProps used document-based research from primary firm sources, checked September 24, 2026. The complete source list, scope, limitations, and commercial-state record appear near the end of this article.
ICT Price Action Model 7 Explained
In ICT Charter Price Action Model 7 – Trade Plan & Algorithmic Theory, ICT presents a bearish, sell-side framework built around what he calls low-resistance liquidity runs. The lesson has two main parts: a structured trade plan followed by a discussion of why downward moves can differ in speed and severity.
This is ICT’s interpretation of market behavior, not proof that markets follow a particular algorithm or that the model has a reliable trading edge. The transcript also cannot confirm the charts displayed in the video, actual entries, fills, or later outcomes.
ICT Trade Plan for Price Action Model 7
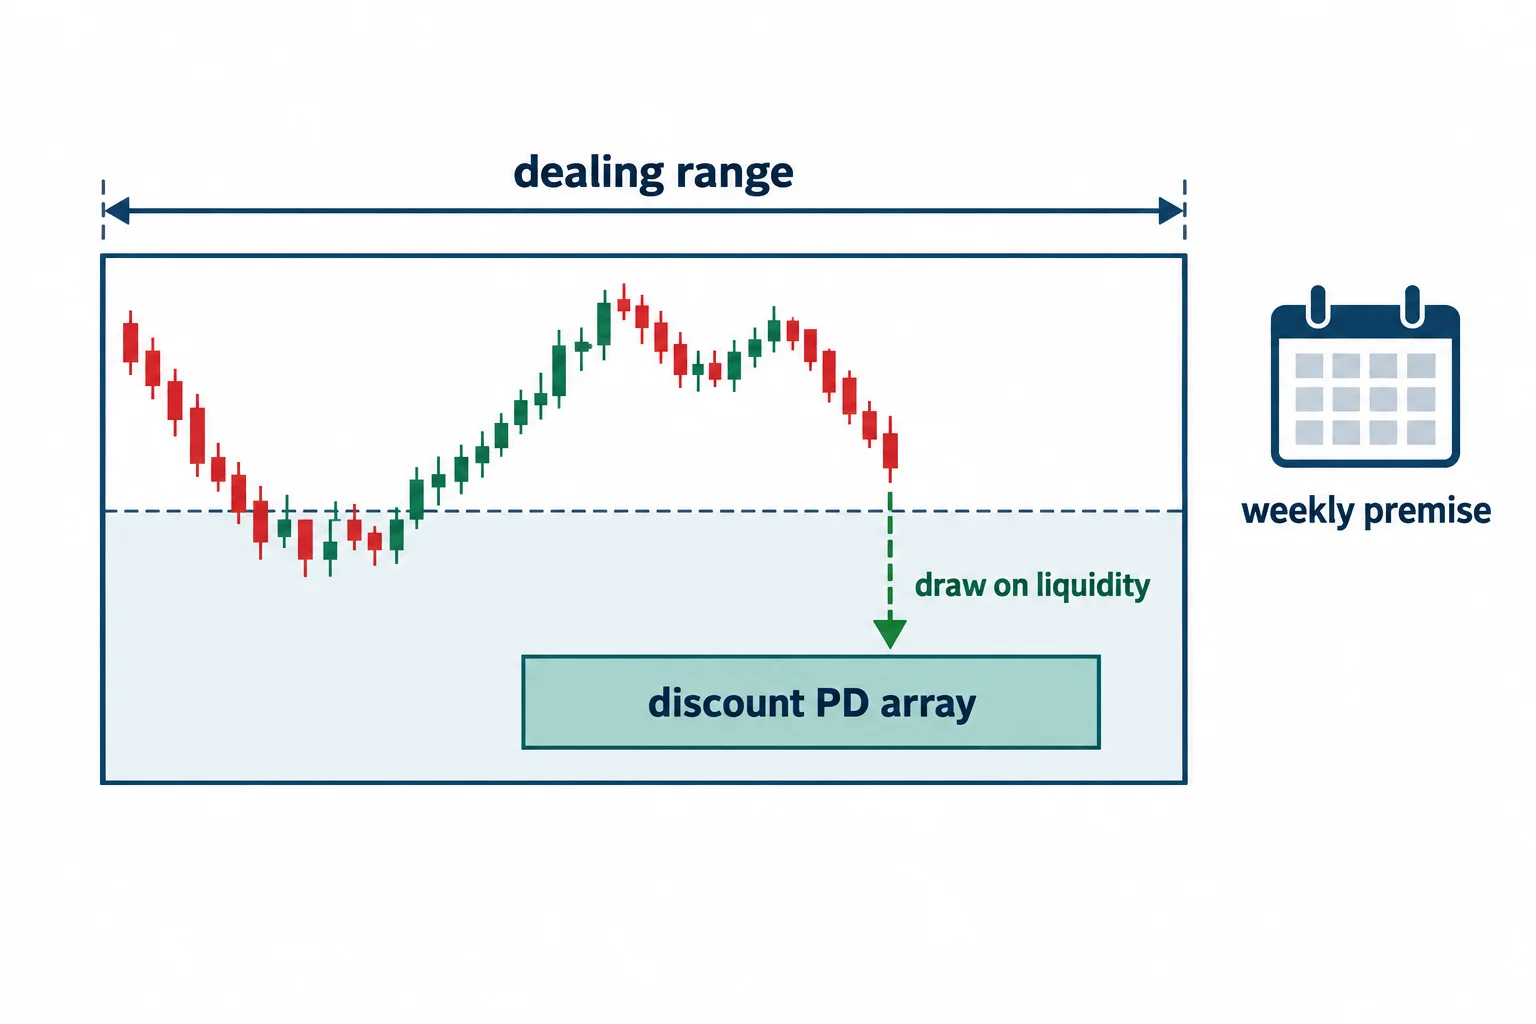
ICT introduces five stages (preparation, opportunity discovery, trade planning, execution, and management) near the 0:37.
ICT Trade Plan Preparation
The preparation stage begins with noting medium- and high-impact calendar events for the markets being studied. ICT proposes comparing those events with current market structure to form an expectation for the weekly range.
He then discusses reviewing the previous 20, 40, or 60 trading days, excluding Sundays, and marking the highest high and lowest low as a dealing range. Within that range, the analyst is supposed to identify the next potential draw on liquidity and a lower-priced “discount PD array” consistent with the bearish weekly premise. The five stages are named at 0:37; he sets out the range lookback at 1:18, notes at 1:37 that Sundays are not counted, instructs marking the highest high and lowest low at 1:40, looks for the next draw on liquidity at 1:51, and seeks the discount PD array at 1:59, anticipating the move to it at 2:08.
“PD array” and the ASR-rendered term “IPTA data ranges” belong to ICT’s specialized vocabulary. The latter may be a recognition error and should be checked against the video’s visible slide before being quoted as an exact label.
ICT Trade Opportunity Discovery
At 2:35, ICT narrows the lesson to opportunities below the current market. He describes two contexts:
- A market maker sell model, where the short waits for 2:56 and targets the terminus at the discount PD array.
- The declining portion of a market maker buy model, where price is expected to reach a discount area before a possible bullish phase begins, targeting 4:37 at the terminus.
In both cases, the immediate directional idea is bearish. Their broader contexts differ, however: one may continue an established decline, while the other is treated as a move into an anticipated support or reversal area.
ICT Trade Planning and Execution
ICT says bearish planning should look for price moving temporarily against the intended short direction around a calendar event that may introduce volatility. His examples include a premium fair value gap or a raid above prior buy stops. He discusses entries around a five- or 15-minute premium area during the London or New York open beginning at 3:41.
At 4:11 he specifies that the short is framed when price moves up into a 15-minute or 5-minute premium fair value gap PD array converging with a standard deviation of no more than plus three, during the London or New York open, and at 4:26 that scalping protocols can be applied here to reduce risk further. The execution section calls for 4:55 on a five-minute chart during a retracement or buy-stop raid. These are ICT’s setup labels rather than independently established market mechanisms. No exact chart price or completed trade can be recovered from the transcript.
ICT Trade Management
The management rules begin at 5:15, where the plan asks for a sell limit order on every position executed in the demo account, using the standard deviation and PD-array convergence minus five pips as the entry price, with all orders sharing that same entry price. He gives staged objectives of 20 pips on one position, 40 pips on a second, and a 60-pip objective at which 80% of the trade is closed to see whether it has more to run. At 6:11 the stop is placed above the referenced high plus 20 pips; at 6:17 he says the trade can be re-entered if it stops out, noting at 6:23 that day trades may require multiple attempts. Risk is reduced in three consecutive steps from 6:32: reduced by 25% at 25% of the expected objective, by 50% at 50%, and moved to break-even at 75%.
These numbers are examples from the lesson, not universal parameters. Pip value, instrument specifications, volatility, gaps, commissions, and slippage can materially change risk. ICT later warns that a stop can fill beyond its intended level during a rapid repricing event.
ICT Trade Plan Position Sizing and Drawdown Rules
From 7:02, ICT gives the sizing formula as account equity times risk percent divided by the stop distance in pips. He works through a hypothetical $20,000 account risking 1.5% with a 20-pip stop, arriving at a $300 risk figure, then compares the lot sizes: 8:08 at 10 cents per pip, 15 mini lots at $1 per pip, and one and a half standard lots at $10 per pip which must be rounded down to one. At 8:14 he states the instruction to always round down, and concludes that standard lots are not ideal for optimal risk management because the position must be rounded so far down.
ICT also proposes reducing the selected risk percentage by half after a full-risk loss, then restoring it only after half the loss has been recovered; if the reduced-risk trade also loses, the risk percentage is halved again, repeating until the earlier loss is half recovered. At 10:17 he adds that after five consecutive winning trades the risk percentage is also dropped by half, because a loss is eventually likely, with the stated goal of limiting sharp equity swings. These are ICT’s classroom rules; the video does not provide test results showing that they improve performance.
At 10:40, students are told to backtest the plan and collect multiple samples rather than waiting for ICT’s examples. The transcript supplies no sample size, results, transaction-cost assumptions, or out-of-sample validation.
ICT Algorithmic Price Action Theory
The second section starts at 10:58. ICT argues that sell-side runs are often faster and more volatile than comparable bullish moves. He contrasts a continuing bearish market maker sell model with a temporary decline inside a broader market maker buy model.
His central distinction is between a severe continuation decline and what he calls a “controlled demolition” toward a discount area that may later support a rally. Around 20:44, he says traders should decide which type of move they are analyzing rather than treating every second-stage distribution as equivalent.
He adds at 23:47 that this fractal is universal and can be applied across time frames, and notes at 11:14 that much of what he said in the Model 6 lecture is reversed here.
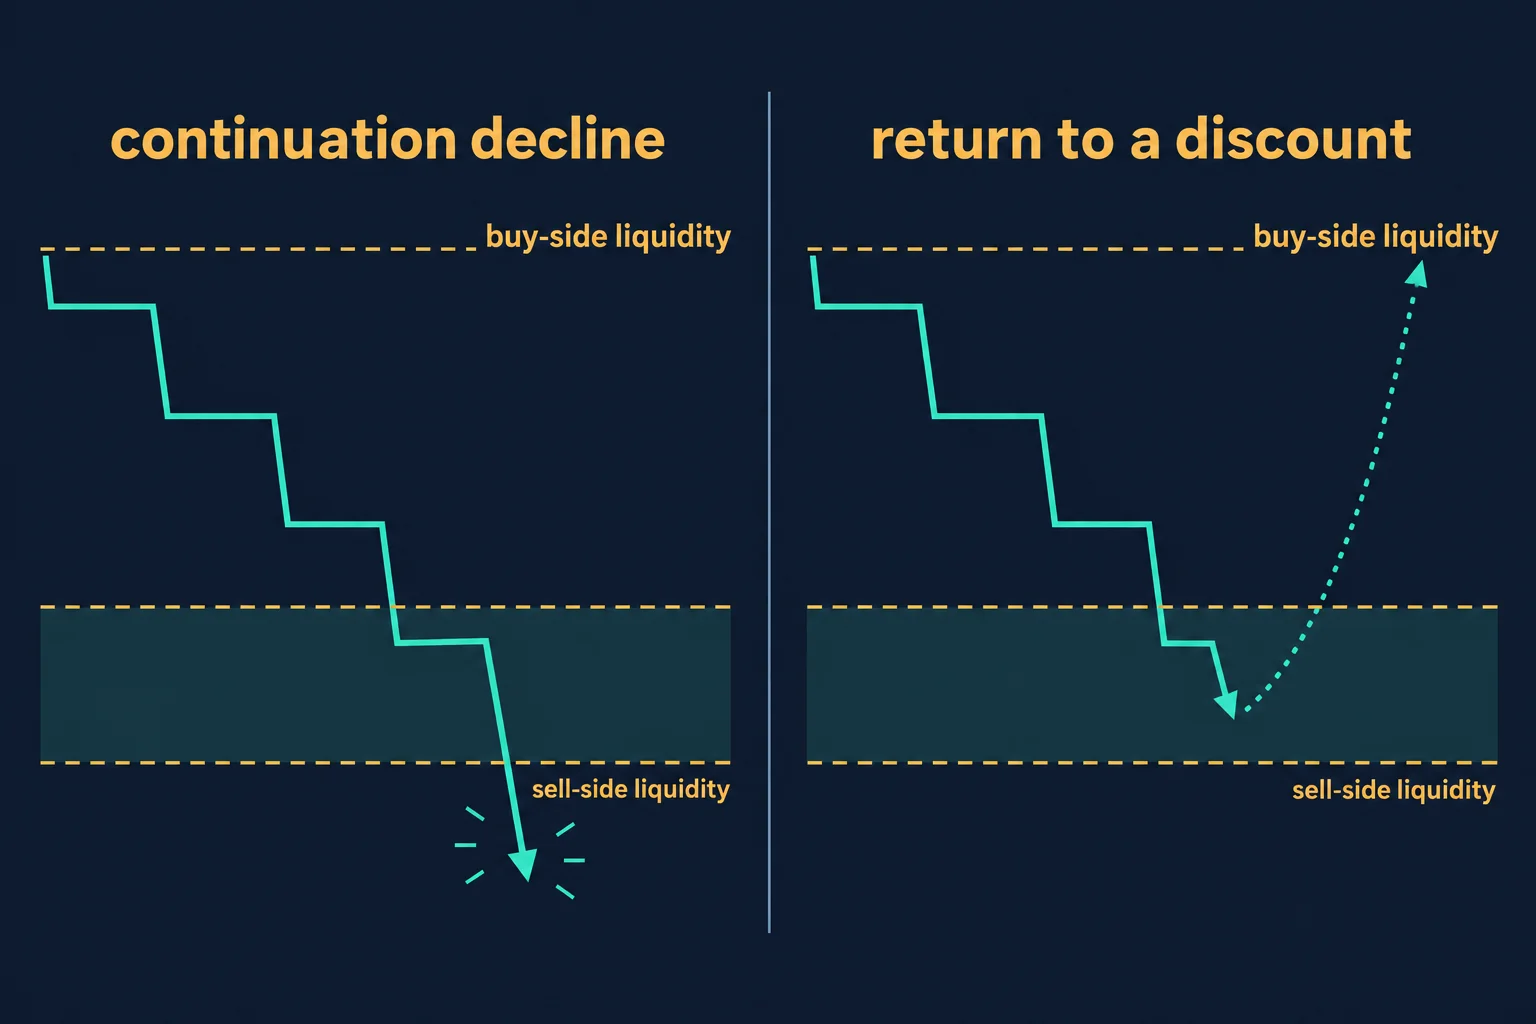
ICT cites crude oil’s historic move below zero as an example of a decline exceeding an anticipated objective. At 14:56 he recalls watching it go to negative $40 a barrel, and at 15:50 he says $11 had been his target for oil and that price went right through it and below zero, adding that he would have lost had he committed to that target. He uses it to emphasize model risk: even a strongly held target can be overwhelmed by unusual conditions. At 21:57, he also notes that fast markets may gap through stops and produce substantial slippage.
ICT Price Action Model 7 Takeaways
Separate from accepting ICT’s algorithmic explanation, the lesson can be read as a checklist exercise: define the higher-time-frame premise, identify the setup context, specify invalidation and exposure before entry, and distinguish an ordinary target move from a disorderly market event. The strongest risk lesson is that labels and stop orders do not guarantee execution at an intended price.
The macroeconomic and geopolitical comments later in the recording are time-specific opinions referring to 2022, even though the YouTube upload date is February 1, 2024. They should not be treated as current forecasts or verified outcomes.
Watch the original recording
The video mapped to this article is ICT Charter Price Action Model 7 — Trade Plan & Algorithmic Theory, a public upload on the channel The Inner Circle Trader dated 1 February 2024 and running 1,788 seconds. Every timestamp link above points into that recording. The transcript used for this guide was produced by local automatic speech recognition of the complete original audio rather than from YouTube captions, so its wording should be treated as automated, not human-verified. The recording’s charts and on-screen annotations were not examined by this review.
Reference sources and provenance
These references support specific points in the guide above. None of them is an ICT publication, none endorses or tests the approach, and none is offered as evidence for the statements shown in the recording.
Why a stop order is not a guaranteed fill price
The lesson places stops above a referenced high and later acknowledges that fast markets can trade well beyond them. Investor.gov, the U.S. Securities and Exchange Commission’s investor education site, explains the mechanism: a stop order becomes a market order once the stop price is reached, and “the disadvantage is that a stop price purchase or sale could be activated by a short-term fluctuation in a stock’s price.” It adds that “the price at which your trade is executed may differ from the stop price, especially in a fast-moving market where stock prices can change rapidly.”[2] That is the same slippage risk the recording describes, stated independently and in general terms; it is not a comment on this model.
Why the stated pip objectives are not a performance record
Objectives of 20, 40 and 60 pips describe intentions, not measured results. The U.S. Commodity Futures Trading Commission states on its Forex Frauds page that “two out of three retail foreign exchange traders lose money each quarter.”[3] That sentence is quoted as general context for retail participation in these markets and says nothing about this speaker, his method or the examples in the recording.
Why the worked examples are illustrations, not audited results
The lesson uses hypothetical account figures and chart walkthroughs rather than a disclosed track record, and 17 CFR 4.41 explains why a performance claim needs care: the regulation’s prescribed statement notes that “these results are based on simulated or hypothetical performance results that have certain inherent limitations,” and adds that “simulated or hypothetical trading programs in general are also subject to the fact that they are designed with the benefit of hindsight.”[4] The recording does not present its examples in that form, so no outcome on this page should be read as an audited or independently verified result.
Why the player above is the check on every timestamp
The whole article rests on the mapped upload, so the reader’s own control is the embedded player. YouTube’s help documentation states that “you can add a YouTube video or playlist to a website or blog by embedding it” and that age-restricted videos cannot be watched on most third-party sites, redirecting viewers back to YouTube instead.[5] The upload used here is publicly listed and not age-restricted, and the embed was play-tested rather than assumed to work.
Sources
- [1] Primary source: ICT Charter Price Action Model 7 — Trade Plan & Algorithmic Theory (The Inner Circle Trader)
- [2] Investor.gov (U.S. Securities and Exchange Commission): Stop Order
- [3] CFTC Learn & Protect: Forex Frauds
- [4] 17 CFR 4.41: Advertising by commodity pool operators, commodity trading advisors, and the principals thereof
- [5] YouTube Help: Embed videos & playlists
Any ICT, SMC or third-party indicator, script, transcript, note set, spreadsheet or social summary circulating outside the publishing channel’s own upload page is unofficial and untested here. PD array, low-resistance liquidity run, market maker buy and sell models, stage 1 and stage 2 redistribution, premium and discount arrays, standard deviation convergence and the institutional order flow entry drill are the speaker’s own framework and terminology. No win rate, drawdown figure, fill, position size or account result is claimed anywhere in this article.
Leveraged foreign-exchange trading carries substantial risk. Staged objectives, a stop reduced in three steps, halved risk percentages after a loss and after five consecutive wins, and the instruction to always round position size down all change the distribution of outcomes, and none of them removes slippage or the possibility of loss. The $20,000 account and 1.5% risk figures in the lesson are worked examples, not a recommendation. This article is educational commentary, does not provide individualised financial advice, and reports no outcome from any session or account.
