
Key takeaways
ICT Price Action Model 5 is an intraday chart framework that projects objectives with Fibonacci standard deviations, consecutive-day confluence, session timing, prior highs and lows, order blocks, gaps, and 10-, 20-, and 30-pip stop-sweep extensions.
Read the full summary
ICT Price Action Model 5 is an intraday chart framework that projects objectives with Fibonacci standard deviations, consecutive-day confluence, session timing, prior highs and lows, order blocks, gaps, and 10-, 20-, and 30-pip stop-sweep extensions. Its range hierarchy uses the Central Bank Dealers Range when it is at least 15 pips, an Asian range when it is at least 20 pips, and otherwise the full range ICT calls the flout, often halved from its 50 percent equilibrium for smaller deviation increments. In the U.S. Dollar Index example, ICT rounds equal highs at 95.53 up to 95.55, adds a 10-pip sweep for a 95.65 objective, and aligns it with standard deviation 4 and a Thursday New York reversal profile. The cable example uses a gap open at 131.41 matching standard deviation 3 and an order-block candle open at 130.07 rather than its wick. The AUD/USD short combines bearish daily bias, a London-session high, fair value gap, and sell-side liquidity with clustered projections at 73.94.4, 73.90.7, and 73.92.1, the last described as the measured candle’s exact low. ICT accepts roughly three to five pips of error, says analysts must choose among wick, body, and deviation measurements based on overlapping readings, and warns that Model 5 is not a fixed A-B-C process. The method is mainly intended for scalping and intraday analysis around London and New York kill zones, and ICT suggests reviewing about one month of 15-minute EUR/USD or GBP/USD data while retaining failed cases. All examples are hindsight-based historical chart readings, not verified fills, audited performance, evidence of an algorithmic edge, or trade recommendations.
How we researched this article
BestProps used document-based research from primary firm sources, checked September 24, 2026. The complete source list, scope, limitations, and commercial-state record appear near the end of this article.
In ICT Price Action Model 5 | Algorithmic Theory, ICT presents a framework for projecting intraday price levels from defined session ranges. The lesson combines Fibonacci-based standard deviations, prior highs and lows, time-of-day windows and directional bias. These are ICT’s interpretations of historical charts, not proof that markets follow a particular algorithm or that the method will be profitable.
ICT Model 5 Range Hierarchy
The first part of the video explains how ICT selects the range used for a Fibonacci expansion. Beginning at 1:24, he marks what he calls the Central Bank Dealers Range and the Asian range alongside the full range he calls the flout. His stated hierarchy appears at 9:24:
- Use the Central Bank Dealers Range if it is at least 15 pips.
- If that range is too small, use an Asian range of 20 pips or more.
- If neither threshold is met, use the full range he calls the flout.
In the first example, ICT calculates an Asian range from 115.58 to 115.81, which he describes as over 20 pips, while the dealer range of 115.71 to 115.85 does not reach the 15-pip minimum. He selects the Asian range and at 3:27 plots a Fibonacci expansion anchored at the range’s extreme points, projecting it in both directions.
The following day does not meet either minimum. At 7:27 ICT switches to the flout. He first identifies its 50% equilibrium and then, as described at 40:50, halves the measured span so the expansion tool returns smaller standard-deviation increments rather than one wide measurement.
ICT Price Projection Confluence
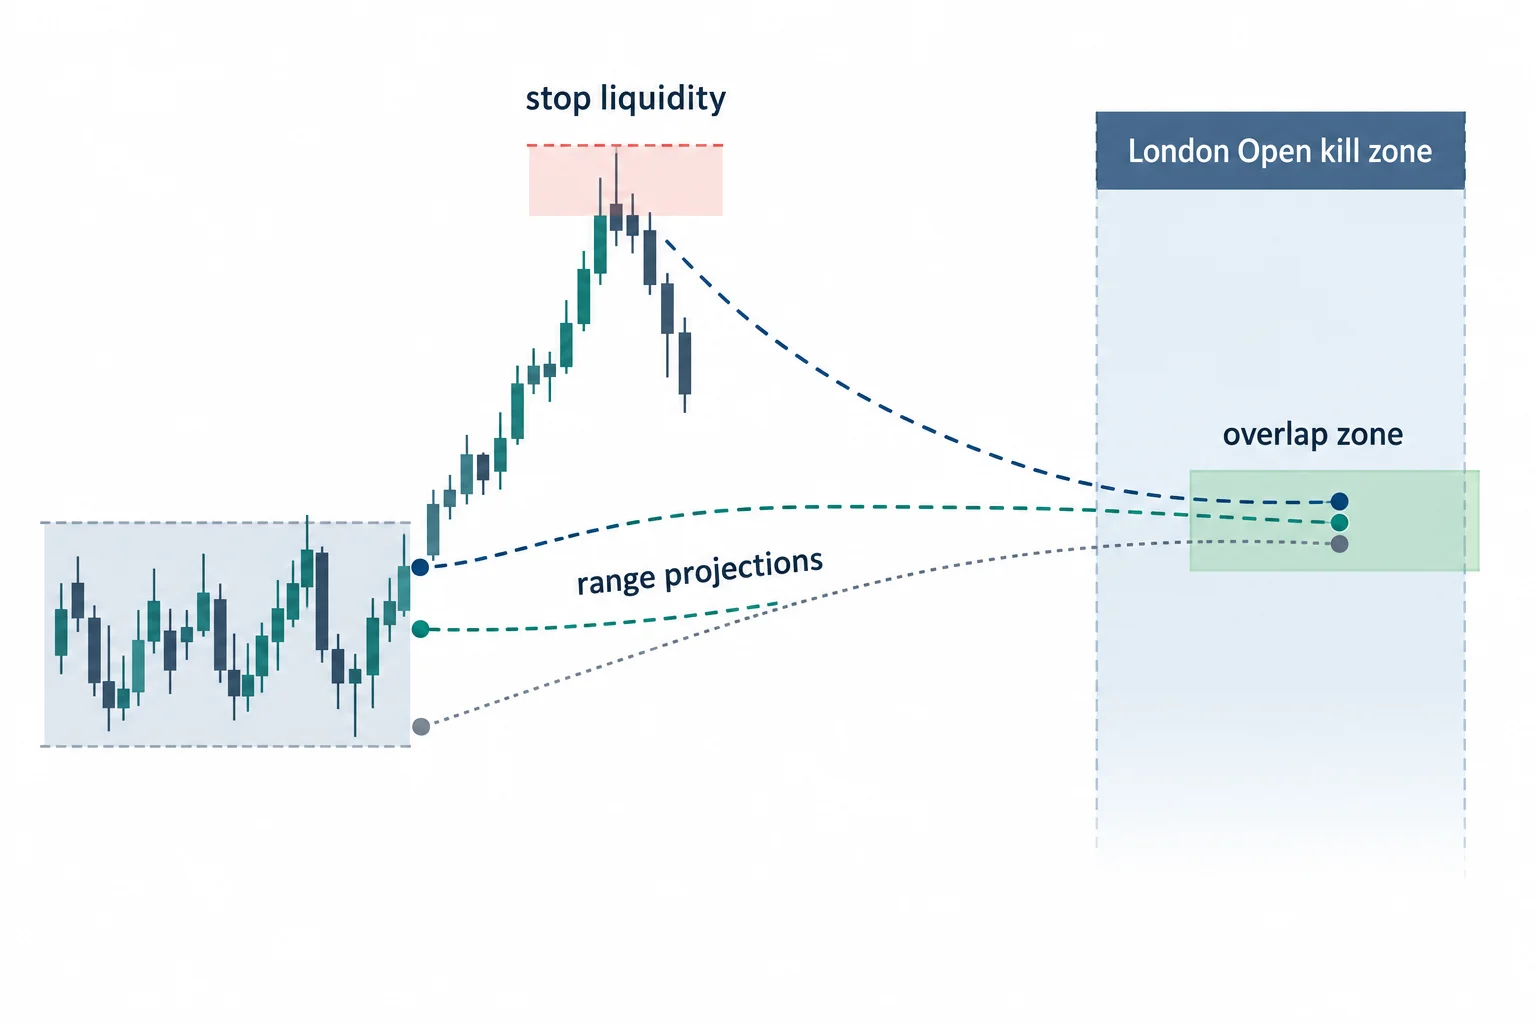
The central idea is not simply to select one Fibonacci level. ICT compares projections from consecutive days and looks for levels that cluster near one another. At 9:17 he summarises the hierarchy and identifies two standard-deviation readings that he describes as very close together, then names the price level they point to.
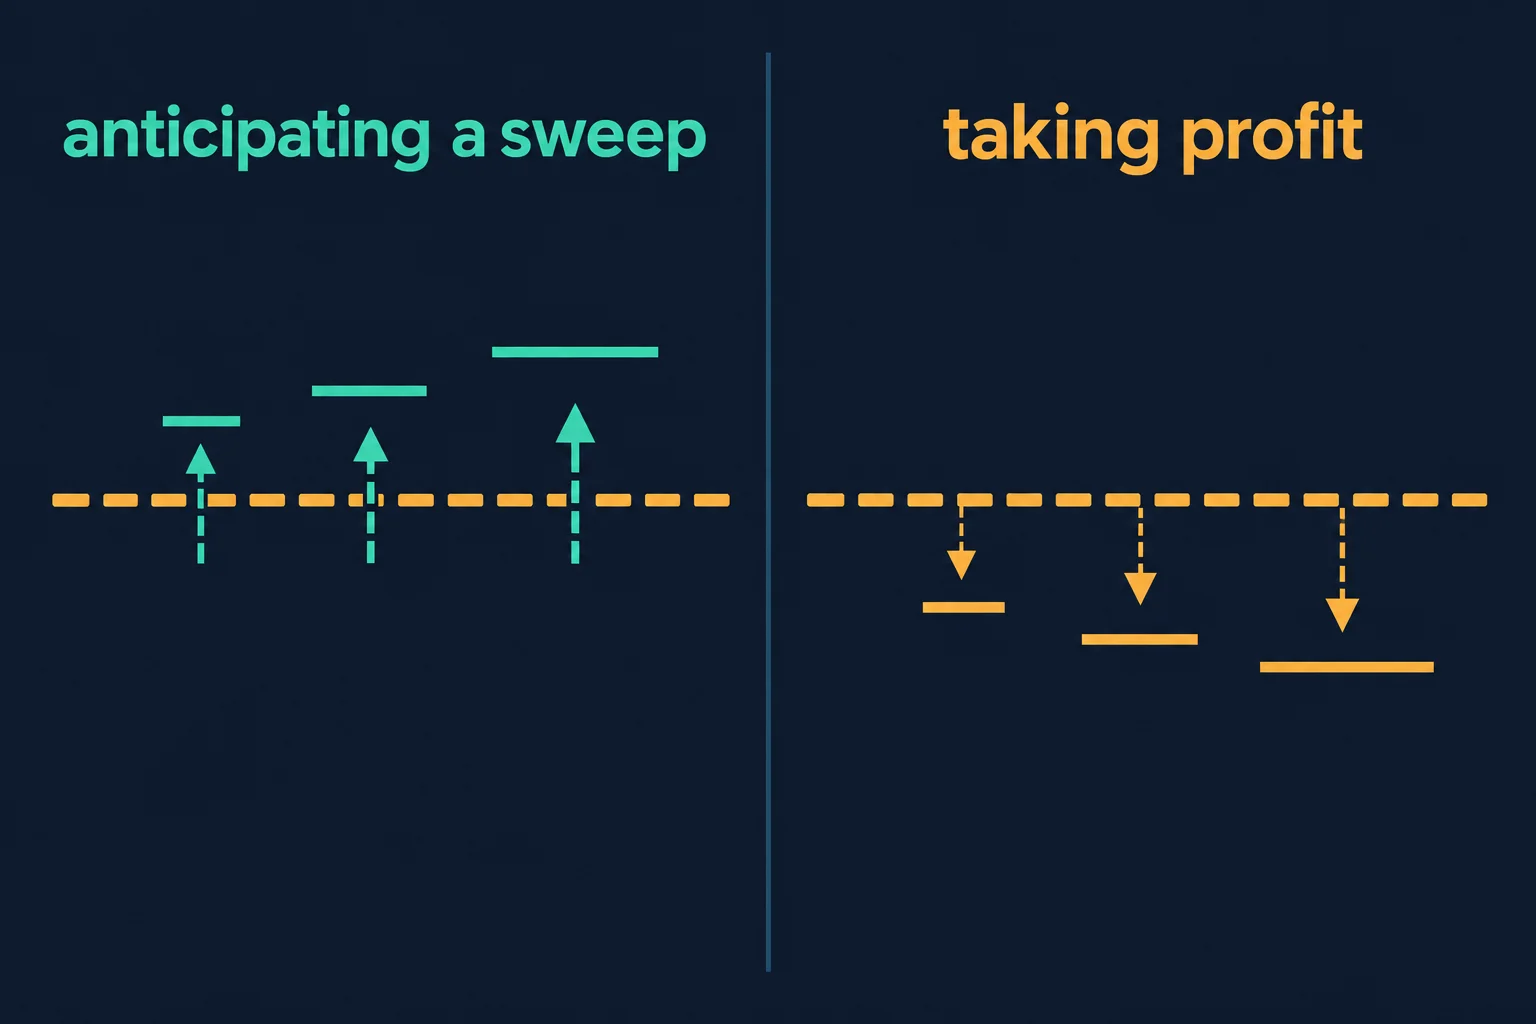
He adds another measurement based on presumed stop liquidity above short-term highs. From 10:22 he calculates 10-, 20- and 30-pip extensions beyond a swing high, and states at 12:43 that the same grades apply below lows when the expectation is downward. In the example, those extensions are compared with the session-range projections and with a swing high that coincided with the beginning of the London Open kill zone near 11:08. ICT reports that his projection was off by roughly one to three pips from the printed high and calls that an example of the “margin of error” he accepts; at 41:21 he states that tolerance as roughly three to five pips.
Because this section depends on chart geometry that the transcript cannot reproduce, the timestamps above show where ICT makes each statement rather than confirming the levels drawn on screen. The recording’s visual annotations were not independently examined for this article.
ICT Price Model Calibration With the Dollar Index
At 13:59 the lesson turns to the U.S. Dollar Index. ICT recalls an order block he had calibrated with a low end at 94.30, notes the actual low he reads as 94.29, and then explains how he derived a 95.65 objective above the equal highs.
The process starts with daily equal highs that he states as 95.53 at 19:25. Because his expectation was for price to trade above those highs, he rounds the reference upward to the nearest five increment, 95.55, as he reasons through at 20:59 and confirms at 21:35. He then adds a 10-pip sweep beyond that level to reach 95.65, described at 22:23, and reports at 22:38 that the session printed a high there. He also matches the level to a standard-deviation reading he calls standard deviation 4 at 24:20, and at 27:21 links the same price to a New York reversal profile on a Thursday.
He is explicit that this is a calibration convention rather than a directional rule. At 23:14 he gives the mirror case: if a level sat above price and the expectation was a sweep lower, he would round the level down instead, which he illustrates with a reference of 94.97 becoming 94.95. At 24:54 he separates the two directions outright, when anticipating a stop run he expands the range beyond the old extreme, while a long position being reduced would round down toward an earlier exit. That is an explanation of his framework rather than a recommendation to trade or exit at those levels.
ICT Price Confluence With Order Blocks Gaps and Opens
The cable example beginning at 28:43 shifts attention to candle-level imbalances. ICT examines a series of down-close candles preceding an upward displacement and, instead of treating the group as one broad bullish order block and marking its midpoint, focuses at 32:55 on a one-pip difference between one candle’s close and the next candle’s open. He identifies the open of a gap at 131.41 at 31:55 as a level the market later reached, and reports that the same price coincided with a standard-deviation reading he calls standard deviation 3 at 34:04.
He then draws the practical distinction that motivates the section. At 35:21 he identifies a later level at 130.07, chosen as the open of the last down-close candle rather than the visible wick, and at 35:42 explains why: the gap may act as a draw to rebalance, but the order block itself is what the price array is reaching for. His general rule, stated at 37:04, is that the open-versus-wick choice is what decides whether he buys at an open or at a wick high, with the reverse applying to bearish order blocks.
This section is the most chart-dependent part of the recording. The transcript supports the concepts and the price readings he quotes, but it cannot establish exact candle placement, order flow, fills, or whether other levels would have worked equally well. The reaction he describes at 36:02 is his reading with the session already complete.
ICT Price Model Walkthrough for the Australian Dollar
From 38:04 ICT applies Model 5 to AUD/USD. He begins with a bearish daily bias based on his reading of seasonal tendency, a breaker and nearby relative equal lows, and sets the daily low as the intraday objective at 38:37. On the 15-minute chart (which he calls the bellwether timeframe at 38:46) he measures the high to low, takes the 50% level and drops the expansion from there so the deviations come in smaller increments, a construction he describes at 40:34.
For the proposed short he looks for a London-session high, movement into a fair value gap at 42:45 and subsequent expansion toward sell-side liquidity. He reports three separate measurements landing near one another: a flout deviation of negative 1.5 at 73.94.4 described at 43:09, the prior day’s deviation of 73.90.7 at 43:22, and a swing projection of negative 1 at 73.92.1, which he says was the exact low of that candle, at 43:54. He frames entries around the London or New York kill zones at 44:36.
Two qualifications belong with that walkthrough. The deviations he compares sit within the few-pip tolerance he allows, so levels that differ by a handful of pips are treated as the same objective rather than as independent confirmations. And the example is presented after the fact on a completed day, so the projections are being read with the outcome already visible. Neither point is disputed by the recording; ICT makes the first himself and repeatedly notes the second is a study exercise.
Practical ICT Price Model Takeaways
ICT explicitly cautions that Model 5 is not a fixed A-B-C procedure. From 46:18 he says it will never be that simple, and at 45:29 he acknowledges that the analyst must pick among multiple measurements, including ranges measured by wicks and ranges measured by candle bodies. His stated criterion is the number of overlapping readings between the previous day and the day being traded. At 47:43 he adds that this degree of precision is chiefly useful for scalping and intraday work, and that obvious prior highs and lows may already provide adequate objectives. He also says at 48:04 that the exercise is meant to illustrate that markets refer to specific times and measurements, an assertion about how price behaves, not a demonstrated result.
His suggested study exercise, given at 12:43 and repeated at 13:39, is to review roughly one month of 15-minute data on a pair of your choosing (he mentions euro and cable) and record when consecutive-day projections, 10-/20-/30-pip extensions and session windows overlap. A neutral way to run that exercise would be to define every rule before reviewing later candles, retain the failed examples alongside the successful ones, and avoid changing anchors after seeing the outcome. He suggests backtesting against old data at 45:54. That reduces hindsight bias, although it does not validate the underlying algorithmic claim or demonstrate a trading edge.
This is best treated as a vocabulary and chart-review framework for studying one presenter’s market interpretation. The recording supplies no controlled testing, no order records and no evidence that the method produces consistent returns. Markets involve substantial risk, and this summary is educational rather than investment advice.
Watch the Original ICT Price Model Recording
The video mapped to this article is ICT Price Action Model 5 | Algorithmic Theory, a public upload on the channel The Inner Circle Trader dated 19 January 2024 and running 2,957 seconds. Every timestamp link above points into that recording. The transcript used for this guide was produced by local automatic speech recognition of the complete original audio rather than from YouTube captions, so its wording should be treated as automated rather than human-verified; where a term or number was ambiguous, the article either omits it or marks it. The recording’s charts and on-screen annotations were not examined by this review.
ICT Price Model Sources and References
These references support specific points below. None of them is an ICT publication, none endorses or tests the approach, and none is offered as evidence for the statements made in the recording.
Why a Price Objective Is Not a Performance Record
Levels such as 95.65 or 73.92.1 are measurement exercises on completed charts, not measured results. The U.S. Commodity Futures Trading Commission states on its Forex Frauds page that “the reality is that two out of three retail foreign exchange traders lose money each quarter.”[2] That sentence is quoted as general context for retail participation in these markets and says nothing about this speaker, this method or any example in the recording.
Risk Context for the ICT Intraday Model
Investor.gov, the U.S. Securities and Exchange Commission’s investor education site, describes day trading as “extremely risky” and states that it “can result in substantial financial losses in a very short period of time.”[3] Model 5 is framed around repeated intraday attempts at a session objective, so that framing is relevant as general risk context. It makes no claim about the speaker or his statements.
Why ICT Model Examples Are Not Audited Results
The walkthroughs in the recording are chart reconstructions rather than a disclosed track record, and 17 CFR 4.41 explains why a performance claim needs care: the regulation’s prescribed statement notes that “these results are based on simulated or hypothetical performance results that have certain inherent limitations,” and adds that “simulated or hypothetical trading programs in general are also subject to the fact that they are designed with the benefit of hindsight.”[4] Because ICT reviews these sessions after they completed, hindsight is present in every example. The recording does not present its material in that form, so no outcome on this page should be read as an audited or independently verified result.
Verify Every ICT Timestamp in the Recording
The whole article rests on the mapped upload, so the reader’s own control is the embedded player. YouTube’s help documentation states that “you can add a YouTube video or playlist to a website or blog by embedding it.”[5] The upload used here is public and not age-restricted, and the embed was play-tested rather than assumed to work.
ICT Model Sources
- [1] Primary source: ICT Price Action Model 5 | Algorithmic Theory (The Inner Circle Trader)
- [2] CFTC Learn & Protect: Forex Frauds
- [3] Investor.gov (U.S. Securities and Exchange Commission): Day Trading
- [4] 17 CFR 4.41: Advertising by commodity pool operators, commodity trading advisors, and the principals thereof
- [5] YouTube Help: Embed videos & playlists
Any ICT, SMC or third-party indicator, script, transcript, note set, spreadsheet or social summary circulating outside the publishing channel’s own upload page is unofficial and untested here. Flout, kill zone, optimal trade entry, PD array, order block and standard deviation as used above are the speaker’s own framework and terminology; the transcript renders several of them inconsistently because it is automated speech recognition. No win rate, drawdown figure, fill, position size or account result is claimed anywhere in this article.
Leveraged foreign-exchange and index trading carry substantial risk. Projecting a level from a chosen range does not reduce slippage, spread or the possibility of loss, and the choice of range materially changes every level that follows. This article is educational commentary, does not provide individualised financial advice, and reports no outcome from any session or account.