
Key takeaways
ICT Charter Price Action Model 12 is a five-minute intraday scalping framework built around daily range expansion and a fixed sequence: establish a directional expectation for the current daily candle, identify an order block at the start of an initial expansion, wait for price to retest it, require a second expansion away from the retest,…
Read the full summary
ICT Charter Price Action Model 12 is a five-minute intraday scalping framework built around daily range expansion and a fixed sequence: establish a directional expectation for the current daily candle, identify an order block at the start of an initial expansion, wait for price to retest it, require a second expansion away from the retest, and only then find a fair value gap inside that later expansion and wait for price to return to it. The recording presents 20 pips as the objective, notes a 80%/20% style split between taking profit and leaving a smaller portion for the next price-delivery-array target, and repeatedly warns against chasing the expansion or trading every fair value gap. It gives EUR/USD and GBP/JPY examples, says the pattern is not limited to five-minute charts, and adds that alignment with daily institutional order flow inside a kill zone makes the setup higher probability. The transcript is automatic speech recognition of the audio, so no chart level, fill or outcome in it is independently verified here.
How we researched this article
BestProps used document-based research from primary firm sources, checked September 24, 2026. The complete source list, scope, limitations, and commercial-state record appear near the end of this article.
In ICT Charter Price Action Model 12 – Scalping Intraday Model, a public upload on The Inner Circle Trader channel, the model is presented as a short-horizon technique rather than a forecast. The video was published on 14 February 2024 and runs about twenty-five minutes.
Two limits shape how this should be read. The source here is automatic speech recognition of the full original audio rather than human-authored captions, so spoken terms and numbers are treated as reported speech and a few passages are too garbled to use. The charts shown in the recording were not inspected for this article, so no price level, gap coordinate, order fill or drawdown figure in it is confirmed here.
What Model 12 is built from
The recording names the stage, setup and pattern in its first minute. The stated focus is 20 pips per trade, the stage is daily range expansion, the setup is an order block paired with a fair value gap, and the pattern runs from an internal range to a 20-pip price run. He summarises the aim at 0:44 as identifying the likely or most probable direction of the current daily bar.
He states the sequence explicitly rather than leaving it implied: wait for an order block to form, then for an expansion swing to unfold (1:04). The order block then has to be retested, and only after that retest does he look inside the following expansion for the fair value gap and use internal range liquidity for the entry (1:48, 2:02, 2:04).
The distinction he stresses: where the gap sits
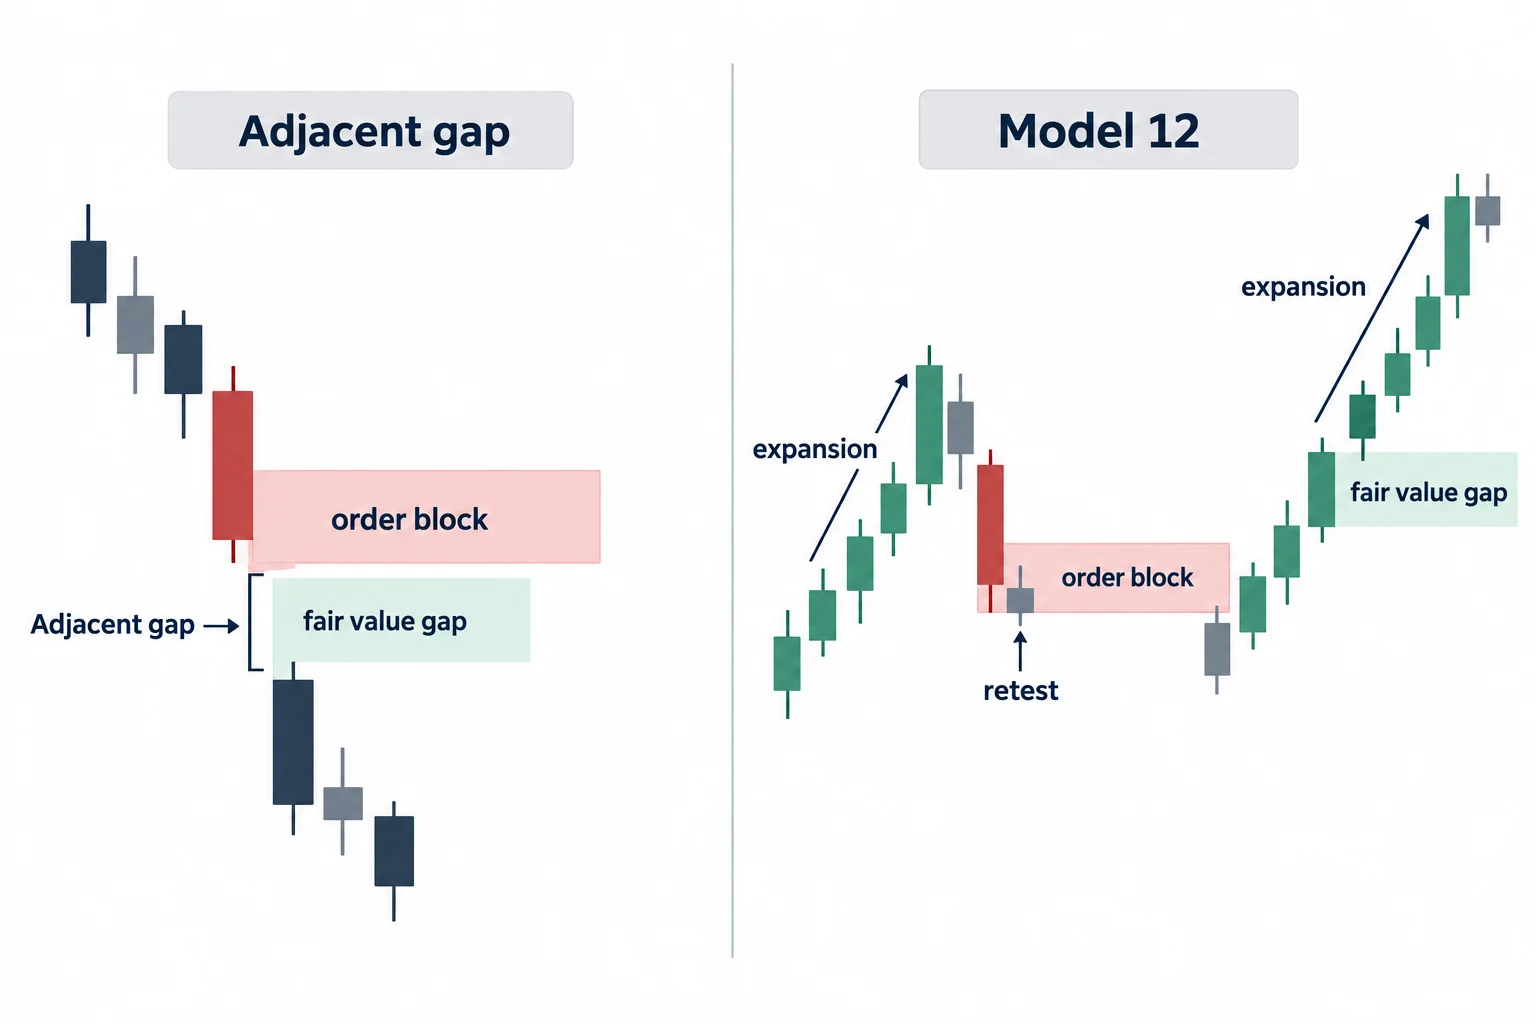
He anticipates the objection that this repeats earlier material and separates the two ideas himself. His higher-probability order block is a down-close candle with a fair value gap linked directly to it, whereas Model 12 looks for gaps in the middle of price runs that are not adjacent to the order block (2:35, 2:43). In the first example the order-block candle is followed by an expansion, and the usable gap sits inside that later swing rather than beside the candle, which is why he describes the pair as an order block and fair value gap coupled for this model (6:21, 6:25).
The stated reason is timing. He concedes he may miss the initial reaction into the order block, but says an expansion move afterwards shows him the order flow reacted there, so the later gap becomes the entry he will not miss (7:02, 7:23). He also notes that a candle he would reject under his ideal definition may still be tradable here, and that being wrong on that classification is acceptable to him because the pattern is what he is trading (4:24, 4:32).
The bullish sequence in his first example
The first walkthrough is EUR/USD on a five-minute chart, with the model described as built on five-minute charts for scalping (3:53). Working from a bullish bias, he identifies a down-close candle as the order block, says it has no adjacent fair value gap, and then marks only the upper portion of that candle – from its high to its midpoint, which he calls the mean threshold – rather than the whole candle, adding that full order-block theory would use the entire candle but that he prefers the upper portion because that is where the sensitivity is (4:57, 5:16).
A detail worth stating plainly: he says that when price trades into that area he does not want to be a buyer there with this model, and instead waits for the order block to prove expansion (5:29). The gap he then uses is defined inside the expansion swing: one pass through, the previous candle’s high and the next candle’s low forming the gap, with the candle’s low framing the gap’s high (5:51, 5:56). He says all it takes is for price to return to that level or lower, plus the spread, to be a buyer (6:04).
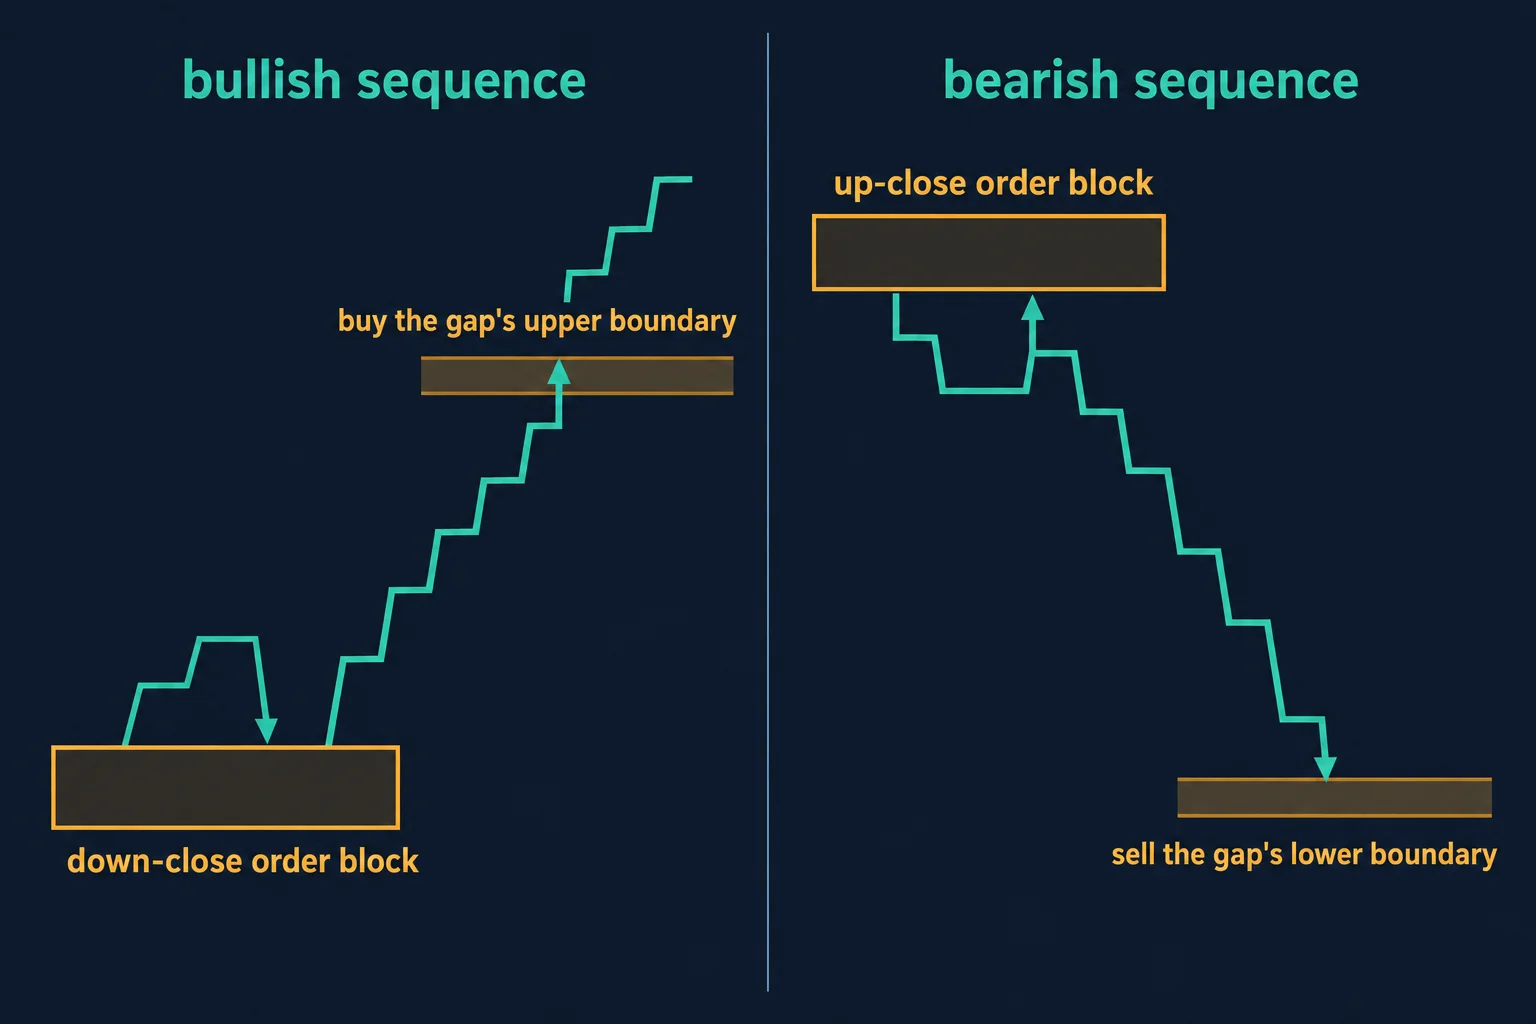
He reports only modest adverse movement before the run: around one or two pips of drawdown once the spread is accounted for, and a 20-pip run shown for illustration rather than a reported fill (8:14, 8:21, 8:34). He notes in passing that price continued further than the shaded distance, and that the shaded area is only the objective he is illustrating (8:31).
The bearish sequence and the premium filter
The second example is pound-yen, which he calls the guppy (10:55). Up-close candles sit as one order block, price trades down and returns into it, and the proof he wants is the expansion swing (11:01, 11:07). He rejects a gap that is too far into the move, saying it is not worth chasing because price is already too extended (11:19).
His filter is the price-delivery-array midpoint: take the price high down to the low, split it in half, and require the level to be at or above the 50% mark, in what he calls equilibrium or premium territory, before it qualifies (11:35, 11:42). The selected gap’s high, or just above it, is the fill he describes, with the shaded area again standing for a 20-pip run once spread and slippage are counted (11:59, 12:16). He restates the protocol at 12:24 – order block, retest, expansion, then the gap – and calls that the protocol.
That is also where he turns on the obvious over-reading. He says he knows the audience’s instinct is to look for every potential fair value gap and trade it, tells them not to, and notes that anyone who has tried has probably already run into that problem (12:36, 12:45). His framing is conditional: certain things have to happen in a series or a specific order before an outcome should be reasonably expected (13:01).
Management: 20 pips, and what he does beyond it
He is explicit that the target is deliberately limited. The model deals with 20-pip runs, not the absolute low or high: all he wants is what he calls bread and butter (10:42, 10:48). At 10:23 he says that if you can get 20 pips you should bank it and take 80% off, then look for other models to overlap for additional objectives.
He puts a concrete shape on that later. Describing his own presentation of the model, he says it is a one-shot entry: give him 20 pips and leave a very small portion on (20:53). His illustration is gearing of one standard lot as ten minis, taking eight of them off at 20 pips and leaving two to see whether the next price-delivery array delivers anything additional for a long, or the discount array for a short (21:01, 21:23). He also says the same pattern can be used to add to an existing position rather than only to open one (22:53). These are his own management choices, not tested rules: the recording does not state a stop distance, an account size or a verified result.
Spread and broker differences are handled rather than glossed. He says how far into a gap price travels depends on the broker, which is why the pattern places the reference at the low of the gap for a short and the high for a long (14:41, 14:46). Some feeds fill the whole gap, some stop at consequent encroachment, and some only tap the edge and never fill it (15:00, 15:15). He adds that the stop is placed above the gap, with money management sized to endure the gap closing, and that seeing a gap close while in the trade is the part people find hardest even when the stop allows for it (15:38, 15:46, 16:06).
Scope: not limited to five minutes
Although the examples are five-minute forex charts, he says the pattern is not limited to that timeframe and expects students to see it form on higher timeframes, including a 15-minute chart for intraday swings and daily charts for position or longer-term swing trading (17:52, 18:04, 18:10). His stated reason is that price is fractal and the theory and narrative stay the same at any scale, down to a one-minute chart (18:06, 18:28). Nothing in the recording tests that claim on any instrument or timeframe.
He closes with the qualifiers that would make the setup better in his view: being inside a kill zone, and being aligned with institutional order flow that is directionally derived from the daily chart (18:42, 18:50). He calls that combination a loaded deal and an easy, low-hanging-fruit setup (18:58, 19:04). Kill zone and institutional order flow are ICT-specific terms whose definitions he assumes the viewer learned elsewhere; this session does not define them or provide a self-contained method for determining daily bias. He also calls the model forgiving because it acts as training wheels for the part people say they cannot see in real time: an order block may be missed, price may return and move away, and the instruction is to wait rather than chase, treating the gap fill as the signal (19:11, 19:30, 19:46).
What the session does and does not establish
The procedural content is clear enough to restate: direction first, then an order block, then its retest, then expansion, then a gap inside that expansion, then patience until price returns to it. What the recording does not supply is evidence. It offers no win rate, no account statement, no independently verified fills and no test of whether the sequence improves on trading the same levels without it. The 20-pip and 80% figures are management preferences he describes, not measured outcomes.
A few passages in the automatic transcript are too garbled to reuse responsibly, including the remark in the opening minute and the aside around the closing discussion of the next round of models. They are noted rather than guessed at, and none is load-bearing for the explanation above.
Watch the original recording
This embedded player was loaded, opened and clicked from a BestProps page on 14 September 2026 and began playing at the recording’s own duration, so the video can be watched in place. The timestamp links above point at the passages being described.
Primary source and further reading
- The original Inner Circle Trader recording — the timestamp links above are the passages being described; the video runs about twenty-five minutes.[1]
- CFTC fraud advisory — commodity trading systems sold on the internet — the U.S. derivatives regulator’s warning that hypothetical results assume fills at specific prices, that stop orders may execute at a worse price or not at all, that bid/ask spreads may not be reflected, and that commissions and fees raise the break-even point.[2]
- CFTC Learn & Protect — forex frauds — the regulator’s own statement that two out of three retail foreign exchange traders lose money each quarter, directly relevant to reading any model presented on a currency pair pair without verified results.[3]
- CFTC Learn & Protect — registration and fraud checks — the reminder that there is no such thing as a risk-free trade or investment, and that markets and products should only be traded with entities registered with the CFTC or other federal or state regulators.[4]
- 17 CFR 4.41 — advertising by commodity pool operators and trading advisors — the rule requiring testimonials to be qualified as non-representative and stating that no representation is being made that any account will achieve similar profits or losses, cited because the recording’s claims about what the model delivers are not accompanied by any verified record.[5]
Any ICT, SMC or third-party indicator, script, transcript, note set, spreadsheet or social summary circulating outside the publishing channel’s own upload page is unofficial and untested here. Order block, fair value gap, mean threshold, consequent encroachment, premium and discount array, internal range liquidity, kill zone and institutional order flow are the speaker’s own framework and terminology. No win rate, drawdown figure, fill, position size or account result is claimed anywhere in this article.
Leveraged and spot currency trading carries substantial risk. Placing the reference at a gap boundary and holding a remainder past the 20-pip objective both leave the position exposed to spread, slippage and a full gap fill, and the recording’s illustration of one or two pips of drawdown describes a single observed example rather than a typical case. This article is educational commentary, does not provide individualised financial advice, and reports no outcome from any session or account.