
Key takeaways
ICT Charter Price Action Model 6 is a universal bullish framework for targeting a predefined draw on liquidity above price, such as an old high, equal or triple highs, a bearish order block, fair value gap, liquidity void, consolidation or other premium array, with the distance to that objective called the range of opportunity.
Read the full summary
ICT Charter Price Action Model 6 is a universal bullish framework for targeting a predefined draw on liquidity above price, such as an old high, equal or triple highs, a bearish order block, fair value gap, liquidity void, consolidation or other premium array, with the distance to that objective called the range of opportunity. Traders are not expected to catch the initial impulse and instead study point one, the first retracement into a fair value gap, order block or original consolidation, or point two, a second retracement often reaching a discount array within the newly created range. Only point one or point two is needed. The structure applies to both market maker profiles, including a sell model that expands upward into premium before reversal and a buy model that breaks below consolidation into discount before returning toward equal highs or the original range. It is presented as fractal across monthly, weekly, daily, four-hour, 60-minute, 15-minute and five-minute charts, with timeframe determining holding period and trade style. GBP/USD and U.S. Dollar Index walkthroughs illustrate nested smaller and larger models, but the examples are chart-reading demonstrations rather than tested results, claimed advance posts cannot be verified from the transcript, and auto-transcribed price levels are internally inconsistent. ICT warns against forcing setups or overtrading and frames the model as educational commentary, not proof of a trading edge or investment advice.
How we researched this article
BestProps used document-based research from primary firm sources, checked September 24, 2026. The complete source list, scope, limitations, and commercial-state record appear near the end of this article.
In ICT Charter Price Action Model 6 – Universal Trading Model, ICT presents a framework for studying bullish price expansion toward an identified liquidity objective. The lesson focuses on what he calls buy-side low-resistance liquidity runs, recurring market-maker-model fractals, and retracement opportunities within a larger expected move.
“Universal” does not mean trading every market, timeframe, or style simultaneously. At 2:19 ICT says it does not mean day trading, scalping and swing trading at once, which he calls “the highest order of doing it”; what he means is that a given setup should be identifiable wherever it appears. His warning follows immediately at 2:38: he says he is being careful not to invite students to overtrade or force a setup, but that if the setup is there it should be recognisable. He also frames the lesson as a description of the model he personally trades most rather than new material, and at 1:37 asks students to study the key levels and then review the post price action, what the move actually delivered after the level was reached, whether it worked or failed.
How the ICT Price Model Starts With a Liquidity Draw
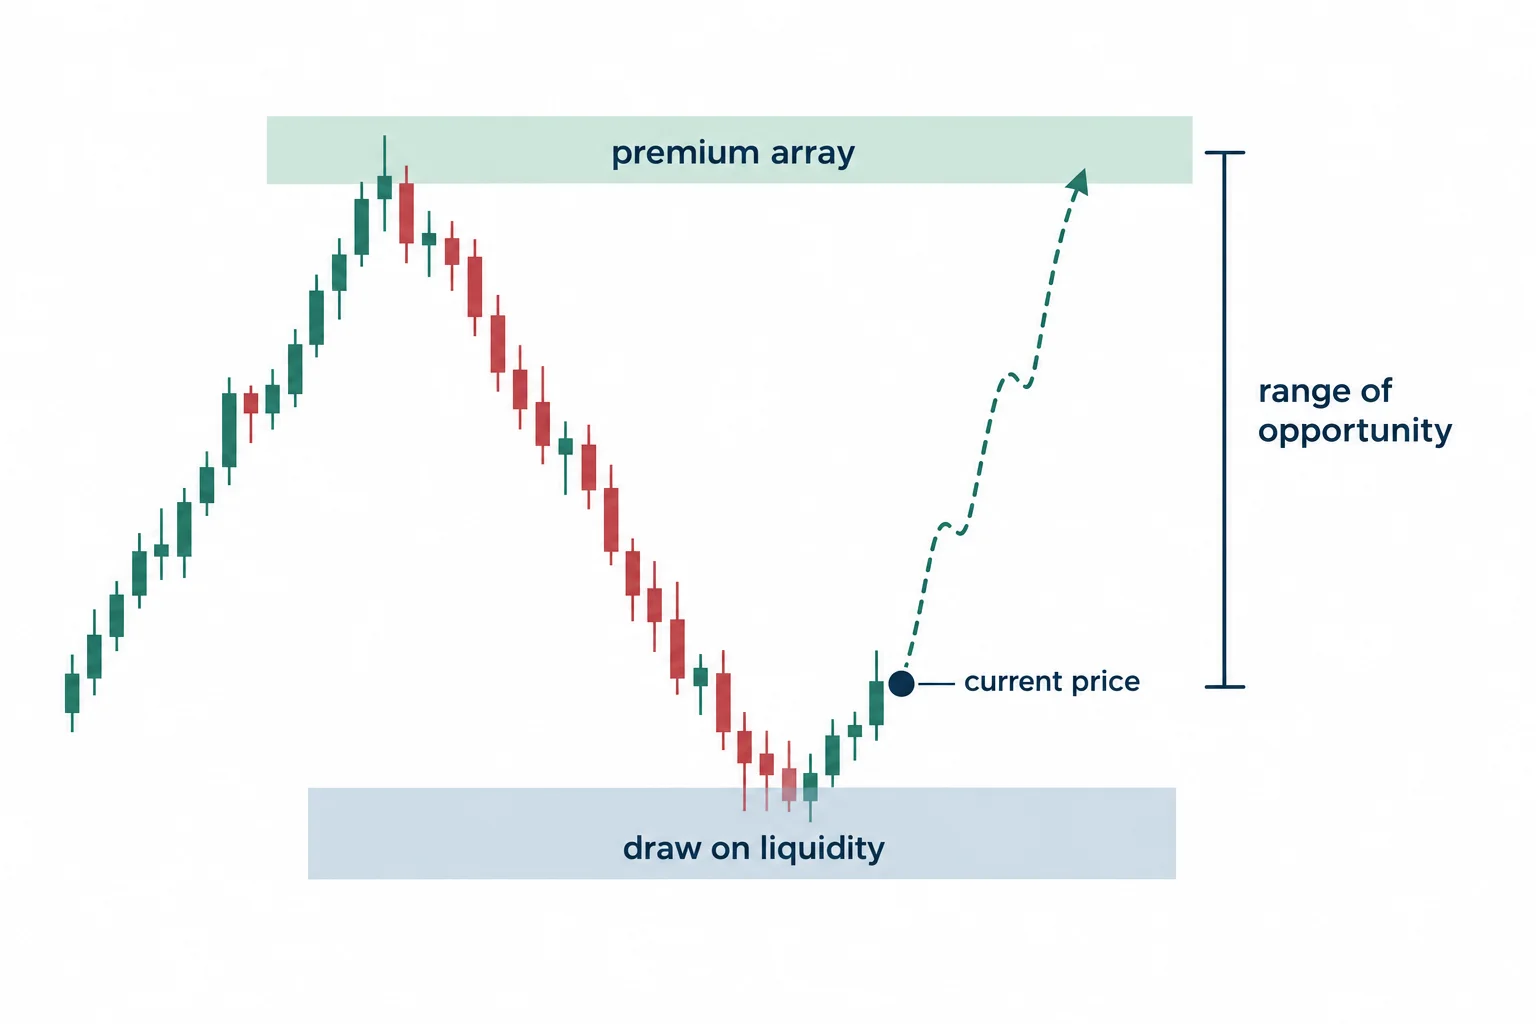
At 2:56, ICT defines the central task: identify a bullish condition and a plausible draw on liquidity above the current market. He then measures the distance from current price to the price level of that targeted liquidity and calls it the “range of opportunity.” He notes at 3:29 that his schematic assumes (with hindsight, in what he calls a crude depiction) an inkling that the market wants to trade up to that level.
Possible objectives in ICT’s terminology, listed at 3:49, include:
- A previous high, with the level above described as a bearish order block
- A run above a previous high
- A liquidity void or fair value gap that needs to be filled during a deeper retracement
- Another higher-priced “premium array” identified through his framework
He adds at 4:01 that framing which level is relevant is up to the trader, and at 4:12 that the same structure has to be adapted to whether the reader is a scalper, day trader, short-term trader, swing trader or long-term position trader.
The lesson does not provide an independently tested rule for proving that price must reach one of these levels. Rather, these are ICT’s classifications for forming a directional hypothesis.
Three Price Action Locations in a Bullish Expansion
ICT’s schematic starts with an initial bullish move that may emerge from consolidation, continue an existing trend, or form part of a reversal, he lists those three possibilities at 5:54 and says it is not apparent or necessary to know which at that stage. He says traders may not recognize that first move in real time. Instead of requiring an entry at its origin, the model highlights later retracements.
The Initial Price Impulse
The earliest possible location is the beginning of the bullish price leg. At 5:43 he says the beginnings of the move may not be clear, and at 6:45 he concedes that the reader may not see that initial buy (the “large green arrow” in his diagram) but says that after the move higher the setup should be visible as a potential buy. At 10:28 he describes the anticipated skill as something built over years of experience, and at 12:24 repeats that catching it is not necessary.
The First Price Retracement
At 7:04, ICT turns to the first pullback after an impulse higher. He says it may or may not return to the original consolidation, and at 7:17 that it could retrace into a fair value gap inside the first leg up, or at 7:25 into an order block, a choice he says is made through the trader’s own PD array matrix. In the weekly-chart framing at 9:17 he calls point one the ideal location for a long-term position or swing entry.
The Second Price Retracement
A second pullback may offer another area to study if the first one was missed or if the trader wants to add to a winning position. At 9:26 he describes the retracement to point two as a discount array relative to the range created by the new price action, and at 9:50 as another candidate for a position or swing trade, while noting that day trades can be taken at the same price point because they overlap. He stresses at 12:31 that only point one or point two is needed to find the setups in this model.
By 11:16, the practical message is clear: students do not need to predict the exact reversal or breakout. They can wait for an impulse, reassess the likely objective, and then study whether a retracement fits the model.
ICT Trade Model Buy and Sell Profiles
The terminology can initially seem counterintuitive because the lesson examines bullish opportunities through two profiles.
- Market maker sell model: ICT describes price expanding upward toward a premium objective before a possible reversal. During that expansion, the first and second retracements are treated as potential bullish study points.
- Market maker buy model: A prior consolidation leaves highs above the market, price breaks lower into what ICT considers a discount array, and then bullish behavior is studied with those highs as the prospective objective.
At 13:24, ICT shifts explicitly to the buy-model version. He describes a market that broke down from consolidation (possibly without warning) traded to a logical level of support or a discount array, and then showed willingness to be bullish. At 14:17 he measures the range of opportunity from that point to the equal highs or the original consolidation, and at 14:45 says point two is used when adding to a winner with the expectation of running the liquidity resting above that original consolidation. At 15:19 he generalises: equal highs, triple highs or a consolidation range, on any timeframe, breaking down into a clear discount array, is the condition he waits for.
Why the ICT Price Action Model Is Fractal
ICT repeatedly states that the pattern can appear on any timeframe, at 5:20 he answers the anticipated question about which timeframe directly: “it’s any time frame.” At 12:43 he says the timeframe should be whatever the trader is comfortable with, and at 12:51 describes a top-down pass from monthly through weekly, daily, four-hour, 60-minute, 15-minute and five-minute charts.
The timeframe also governs the expected holding period. At 31:17 he says classifying the timeframe helps set how long the position is intended to be held, and warns against abandoning a longer-term idea (getting “shook out”) because of intraday movement that would be a reasonable exit for a scalp or day trade. At 31:09 he directs students back to the mentorship’s timeframe classifications to connect interval with style.
This is best understood as a consistency principle: the analytical timeframe, target, and intended trade duration should match. It does not establish that all apparent versions of the pattern have equal reliability.
ICT Price Action Examples With Pound and Dollar Index
The chart walkthrough begins at 18:07 with British pound–U.S. dollar examples on weekly and hourly charts. On the weekly chart he describes a consolidation, the first impulse leg that made it visible, an interest area at an open around 143.46 in the auto-transcript, and a retracement into a bullish order block that he labels point one, a buying opportunity aimed at a premium array, with the caution at 19:28 that he is not trying to pick tops or call a long-term reversal. On the hourly chart at 21:09 he walks the same idea through equal highs, a break, a smart money reversal, a return into the order block as point one, a rally, and a second return into another bullish order block as point two.
At 21:27 he says the levels in that example were tweeted beforehand so the reactions are not hindsight reflections, and at 22:20 that a specific post went out on the 19th. Those timing claims rest on his own account and are not verifiable from the transcript; the article reports them as his assertions. Note also that the transcript’s pound levels are internally inconsistent (it renders both 143.46 and, later, figures around 129.65 and 29.65) because automatic speech recognition of spoken numbers is unreliable. None of those levels should be treated as verified market data, and the article does not reconstruct them.
At 26:25, he moves to the U.S. Dollar Index. He describes equal highs he expected to be run and a potential reversal, then works down to an hourly chart where a consolidation rallies into those equal highs. At 26:48 the transcript reports a high of 95.65 and describes calculations based on “model number five” standard deviations for intraday volatility; a later passage gives 95.55 calibrated from 95.53 as old daily highs, and another area is described as a preference for 94.85 to 94.95 at 29:43. Those figures are reported here as the auto-transcript gives them and should be read as approximate spoken values rather than confirmed levels, particularly given the inconsistency between the 95.65, 95.55 and 95.53 figures within the same example.
At 28:25 he calls the completed sequence one small fractal or market maker sell model, then at 28:34 zooms out to show accumulation, a smart money reversal, distribution and a larger consolidation being cleared, a second, bigger completed model. His point is that the smaller formation sits inside the larger one. At 30:17 he repeats the exercise on a 15-minute chart, where consolidation and equal highs run into the same reported level and distribution follows a market structure break.
Some portions of this walkthrough are retrospective. Even where ICT says levels were shared beforehand, the transcript alone cannot verify the timing of those posts, the displayed chart markings, executions, or outcomes.
How to Interpret the ICT Price Action Model
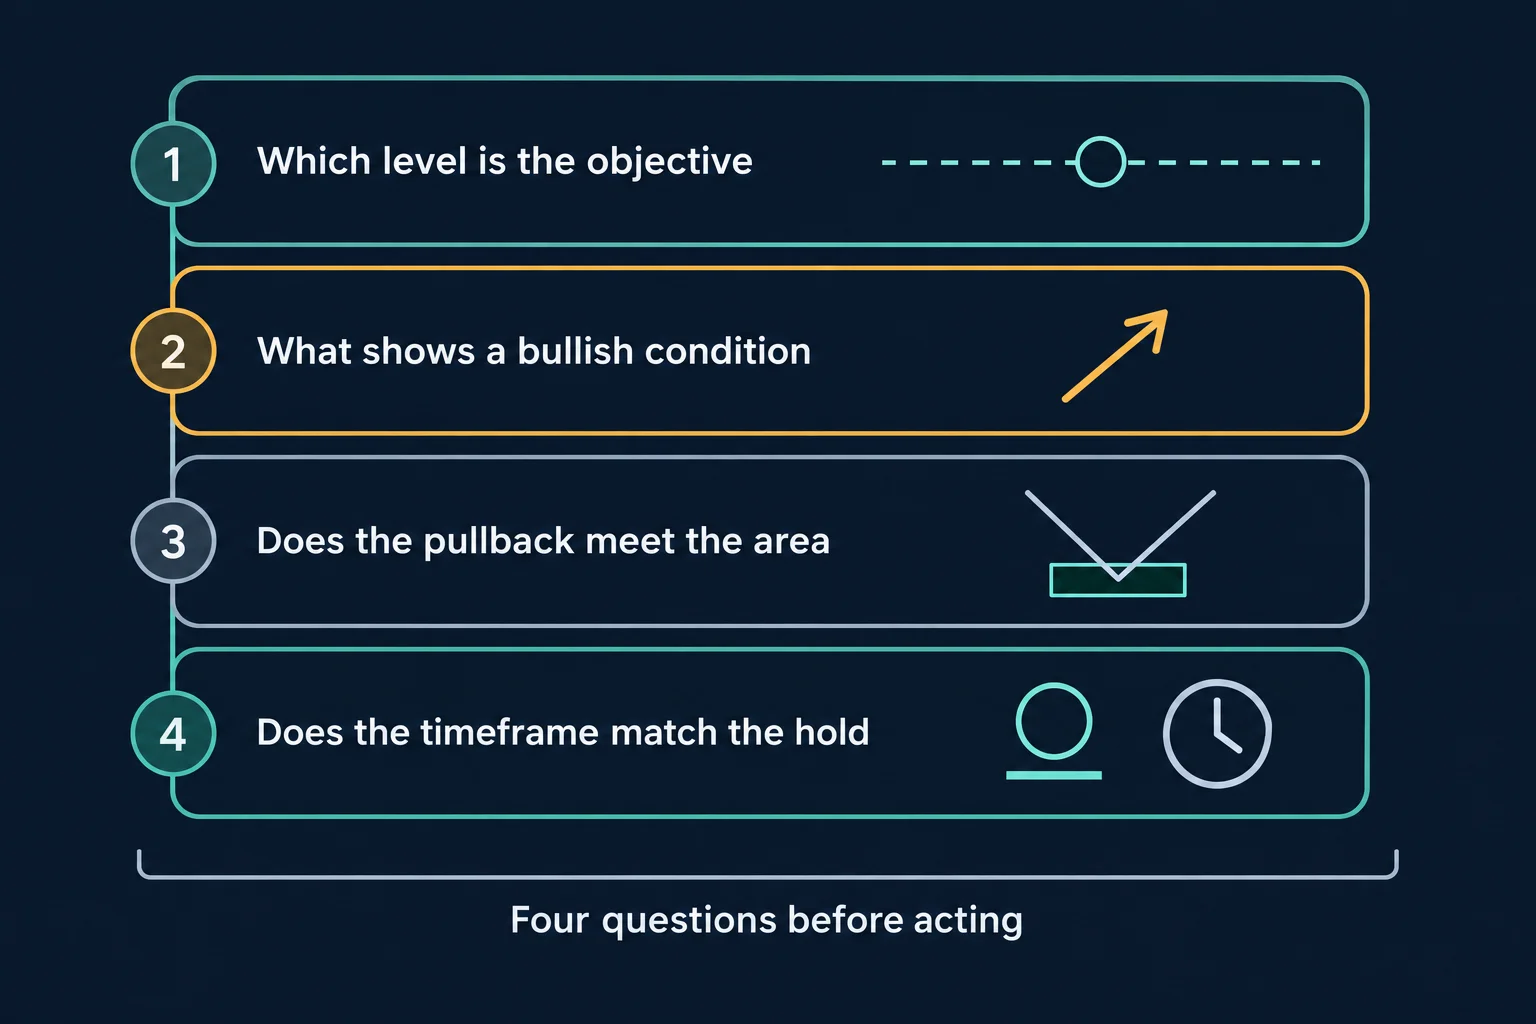
A practical way to study this lesson (without treating it as a promise of market behavior) is to separate it into four questions:
- What specific level above price is being proposed as the liquidity objective?
- What observable movement supports a bullish condition?
- Does a later retracement interact with a clearly defined area from the impulse?
- Does the selected timeframe match the intended duration of the analysis?
The model’s main lesson is not that every retracement should be bought. It is that ICT organizes bullish scenarios around a predefined objective, accepts that the first move may be missed, and then looks for one of two pullbacks while the thesis remains valid. This is educational commentary on ICT’s interpretation of price action, not investment advice or evidence of a proven trading edge.
Watch the Original ICT Price Action Model Recording
The embed above is the upload’s own YouTube player and it is left in place because it plays. This same iframe markup was loaded from a BestProps origin on 15 September 2026 and clicked: playback advanced to 4.9 seconds of the recording’s own 1,922.12-second duration with no error notice and no owner restriction reported by the player. YouTube’s help documentation states that a video or playlist can be added to a website or blog by embedding it[4]. All timestamp links above point into the same recording.
How This ICT Price Action Article Uses Its Source
The primary source is ICT Charter Price Action Model 6 – Universal Trading Model, a public upload on the channel The Inner Circle Trader running 1,922.12 seconds[1]. Its transcript was produced by local automatic speech recognition of the complete original audio rather than from YouTube captions, so the wording is automated, not human-verified. That matters most for the price levels quoted above, which are spoken figures rendered by a model and are internally inconsistent in the pound example; they are reported as transcribed and explicitly not treated as verified chart data. The recording’s charts and on-screen annotations were not examined by this review, so the timestamps point into the audio rather than describing what is on screen. Everything attributed to ICT is his stated rule, interpretation or recollection, not a verified market outcome.
ICT Price Action Model Sources and Further Reading
Two regulator references frame the risk language above. US federal rules for advertising by commodity trading advisors require that presented simulated or hypothetical performance carry the statement that such results “have certain inherent limitations” and that simulated programmes are designed with the benefit of hindsight[2] Relevant because a retrospective chart walkthrough is exactly that kind of presentation. The CFTC separately advises that no technology can consistently predict the future and that anyone trading foreign exchange should trade with a registered dealer[3]. Neither reference is a statement about this recording or channel, and this article is independent commentary rather than ICT material.
- [1] ICT Charter Price Action Model 6 – Universal Trading Model (The Inner Circle Trader) The primary source; use the timestamp links above to compare the explanation with its recording.
- [2] 17 CFR 4.41: advertising by commodity pool operators, commodity trading advisors, and the principals thereof The hypothetical-performance disclosure rule quoted above.
- [3] CFTC Learn & Protect: Forex Frauds Regulator guidance on predictive-technology claims and unregistered dealers.
- [4] YouTube Help: embed videos and playlists Platform guidance behind the player embedded above.
Any ICT, smart-money-concept or third-party indicator, script, transcript, note set or social summary circulating outside the channel’s own upload page is unofficial and untested here. Market maker buy and sell models, premium and discount arrays, the range of opportunity, low-resistance liquidity run, fair value gap, liquidity void, PD array matrix, smart money reversal and “fractal” are the speaker’s own framework and terminology, and “point one” and “point two” are his labels for two discretionary retracement locations rather than fixed rules. No win rate, drawdown figure, fill, position size or account result is claimed anywhere in this article, and no chart level is presented as verified.
Leveraged futures and foreign-exchange trading carries substantial risk. Applying an unconstrained timeframe to a pattern, treating a retrospective walkthrough as evidence of an edge, and holding a longer-term thesis through intraday movement all change the distribution of outcomes, and none of them removes slippage or the possibility of loss. This article is independent educational commentary, does not provide individualised financial advice, and reports no outcome from any session or account.