
Key takeaways
ICT Charter Price Action Model 6 presents a five-stage buyside framework covering preparation, opportunity discovery, trade planning, execution, and management across the rising side of market maker buy and sell models, but provides no trade results or evidence of a reliable edge.
Read the full summary
ICT Charter Price Action Model 6 presents a five-stage buyside framework covering preparation, opportunity discovery, trade planning, execution, and management across the rising side of market maker buy and sell models, but provides no trade results or evidence of a reliable edge. Preparation measures 20, 40, and 60 trading-day high-low ranges excluding Sundays, divides them into premium and discount, and favors longs from discount toward liquidity such as old highs, original consolidations, bearish order blocks, bearish breakers, or other premium PD arrays. The setup requires bullish bias, an upside market-structure break, stage-one or stage-two reaccumulation, a Judas swing near scheduled volatility, a 15- or 5-minute discount fair value gap converging with a standard-deviation reading the transcript gives as “no more than negative 3 standard deviations” (a phrase that is ambiguous as transcribed, so the exact direction is unconfirmed), London Open or New York Open timing, and a five-minute institutional order-flow pattern or sell-side stop raid. Demo orders use a shared buy-limit entry adjusted by five pips, targets at 20 and 40 pips, and at 60 pips with at least three positions close 80% and leave the remainder. The initial stop sits below the discount-array and standard-deviation convergence with a 20-pip allowance, then its distance is reduced 25% after reaching 25% of the objective, 50% at halfway, and moved to break-even at 75%. Position sizing uses equity, risk percentage, stop distance, and pip value, divides risk across orders, and rounds size down, with an example using $20,000 equity, 1.5% risk, and a 20-pip stop across micro, mini, and standard lots. Risk is reduced after a full loss until half the loss is recovered and reduced again after five consecutive wins, while students are directed to backtest multiple samples, study historical charts, and practice on a demo account.
How we researched this article
BestProps used document-based research from primary firm sources, checked September 24, 2026. The complete source list, scope, limitations, and commercial-state record appear near the end of this article.
In ICT Charter Price Action Model 6: Buyside Trade Plan, ICT presents a rules-based framework for studying the long side of both market maker buy and sell models. The lesson is organized around five stages: preparation, opportunity discovery, trade planning, execution, and management. It also includes position-sizing examples and instructions to test the model on historical charts and a demo account.
This is a summary of ICT’s interpretation of price action, not evidence that the model produces a reliable trading edge. The transcript does not show whether any setup was traded or how it subsequently performed.
ICT Buyside Trade Plan in Five Stages
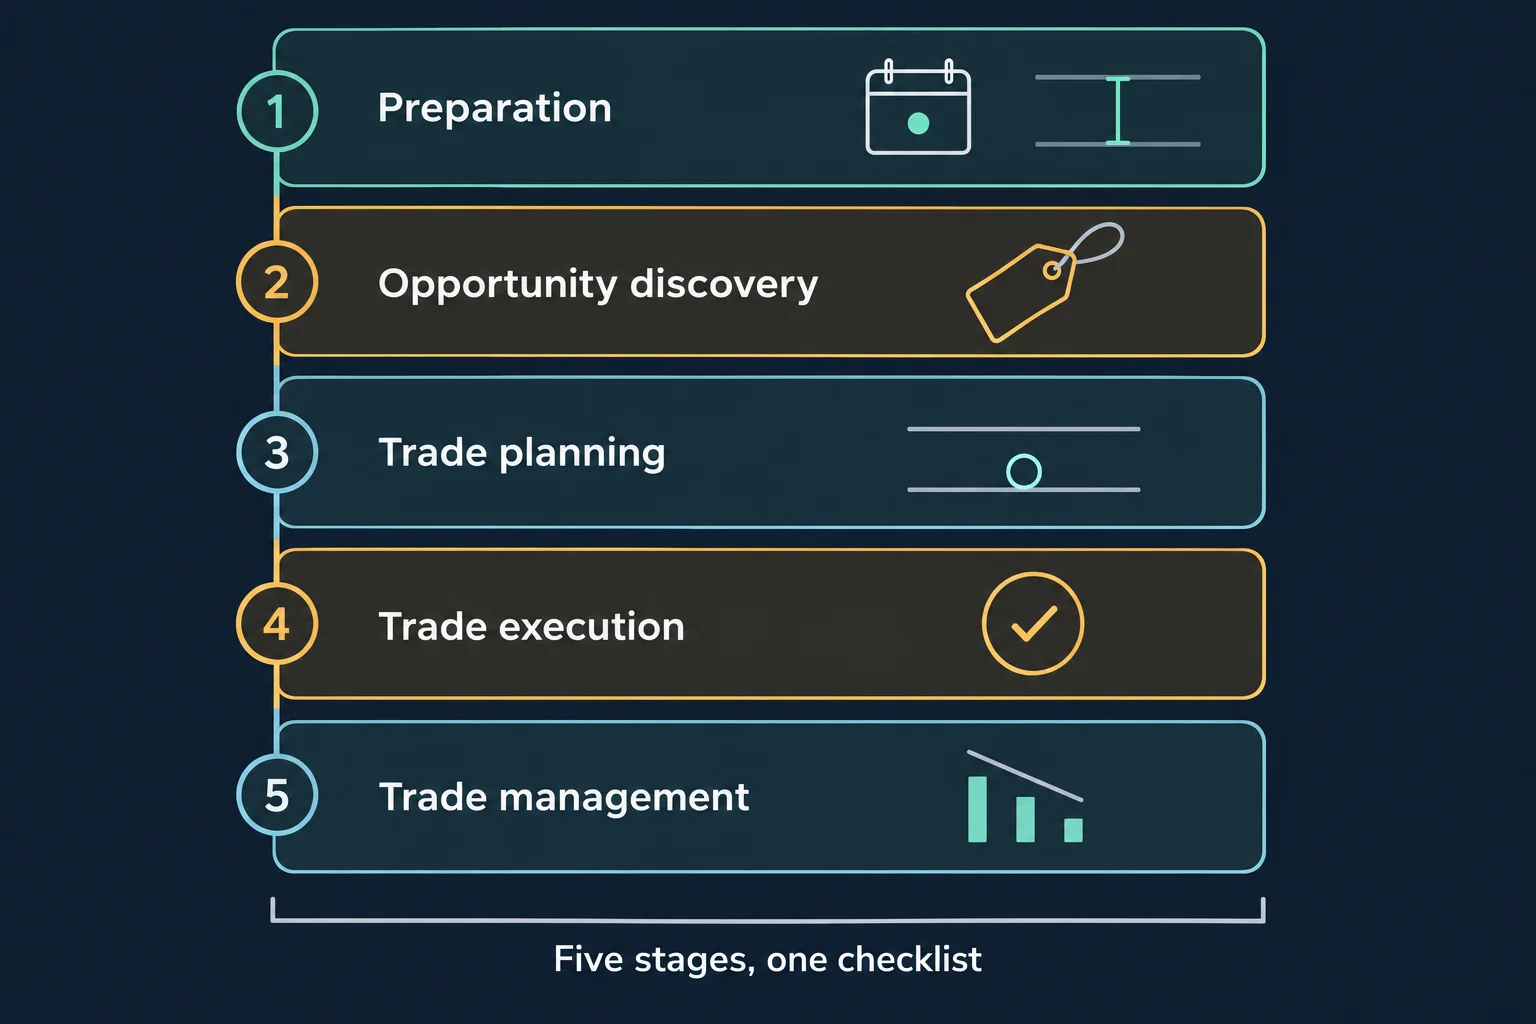
ICT introduces the plan at 0:39 through five recurring stages:
- Preparation
- Opportunity discovery
- Trade planning
- Trade execution
- Trade management
The purpose is to move from a broad market narrative to a defined entry, objective, and risk-management process rather than treating an isolated bullish signal as a complete trade plan.
Preparing the ICT Buyside Plan With Ranges and Liquidity
During preparation, ICT says at 0:57 to note all medium- and high-impact calendar events for the markets under study. He connects those scheduled events with current market structure and a possible weekly range profile, treating an event as a potential volatility injection rather than as a directional signal by itself.
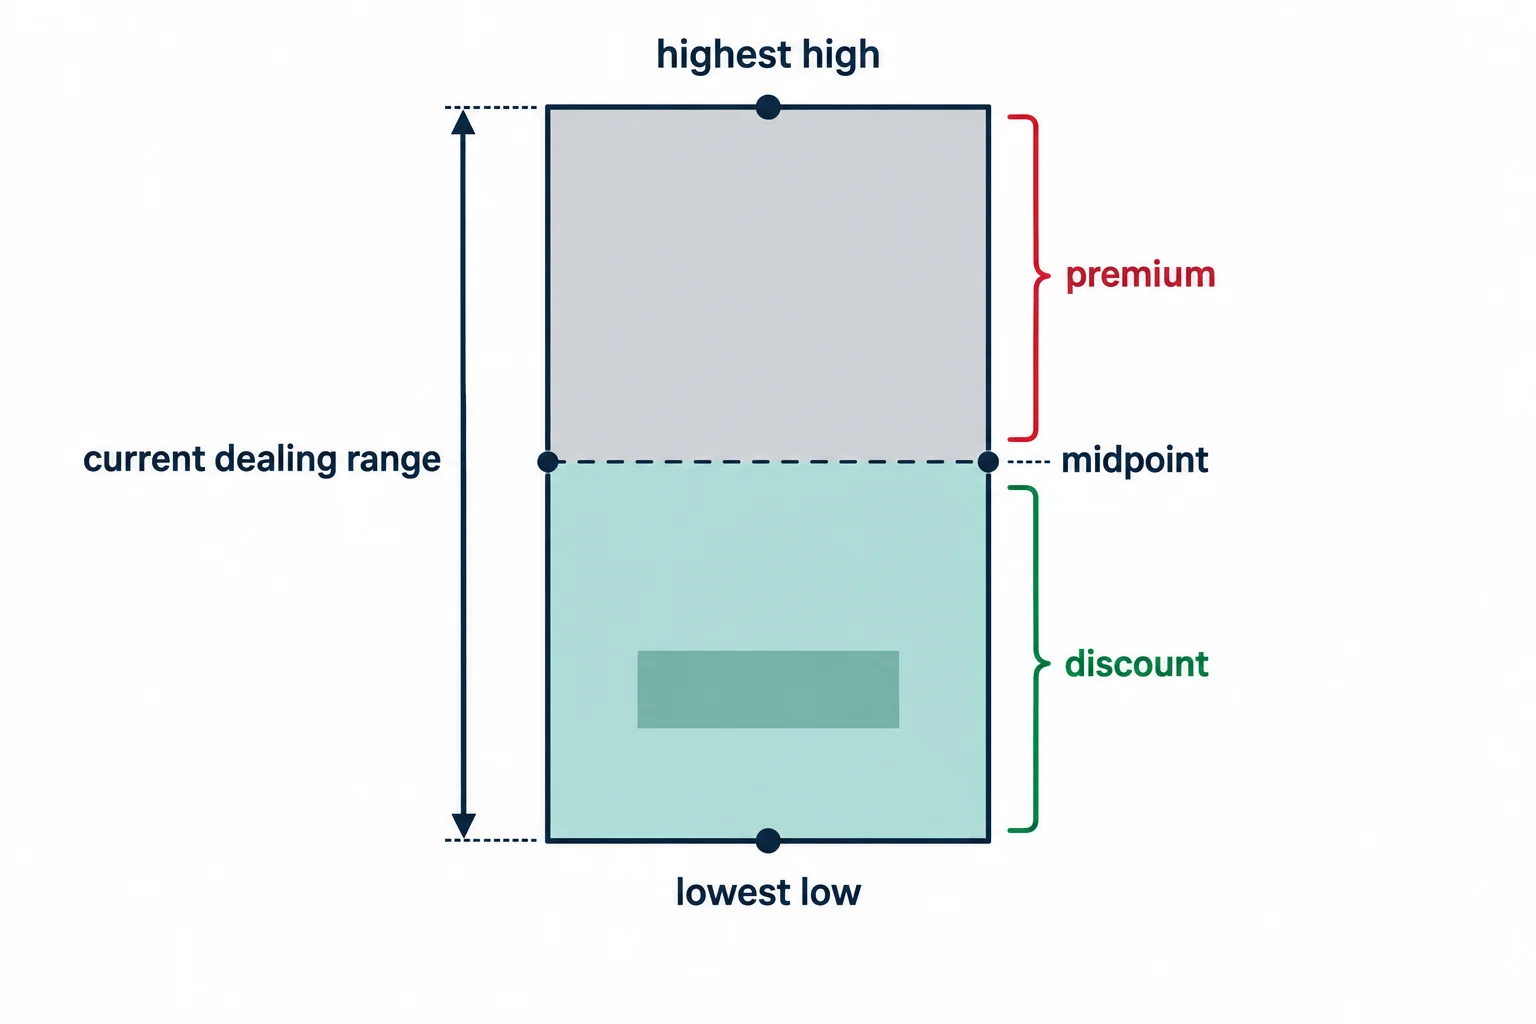
At 1:19, he describes measuring the highest high and lowest low over the previous 20, 40, and 60 trading days, excluding Sundays, and calls that span the current dealing range. The intended lookback varies with the setup timeframe: he ties the 60-day lookback to weekly setups around 2:06, while daily and intraday analysis may use the 40-day or 20-day range.
Dividing a selected range at its midpoint creates what ICT calls premium and discount, and he says the preference is to buy primarily from discount. For this buyside plan, the general preference is to investigate long setups in the discount half while identifying a prospective draw on liquidity above the market — which old high, original consolidation, or other premium price-delivery array (often abbreviated by ICT as a PD array) price might trade toward next.
How the ICT Buyside Price Curve Works
The plan is not limited to one larger market model. Instead, ICT focuses on the rising portion (or “buyside curve”) of two possible structures, which he contrasts at 3:04: the market maker sell model begins near a low or inside a discount and trades up to a premium before reversing lower and going below the original consolidation, while the market maker buy model begins at a premium consolidation, declines into discount, and then reverses back above that consolidation.
Buyside Curve in a Market Maker Sell Model
ICT describes a market that rallies first in order to drop. The trader studying only the buyside portion would attempt to frame the rise toward that anticipated turning point, not assume that the rally must continue indefinitely. In ICT’s terminology, the premium destination is the “terminus”: the area where the projected move may finish and reverse. At 6:21 he adds that he is not forecasting a mega-trade running three, four or five months in one direction, but a scalable move that ends where it creates a sell.
The opportunity-discovery discussion beginning around 4:12 emphasizes forecasting a route from current price toward a specific premium area. ICT gives a bearish order block or bearish breaker above the market, or a run above an old high that he compares to a turtle soup, as possible examples of that destination. He then waits for stage one or stage two reaccumulation to go long toward that premium array, and in a sell model he targets the buy-side liquidity above the old high as the terminus.
Buyside Curve in a Market Maker Buy Model
For the buy model, ICT describes price declining into discount, reversing, and then advancing toward the original consolidation above the market; the premium array in this case may be an old high or that original consolidation. He says the buyside plan waits for the decline and an upside market-structure break before looking for a long during what he calls stage-one or stage-two reaccumulation. When the market starts to rise, that rise is the portion this plan trades, and at 8:59 he gives the objective for a market maker buy model as the original consolidation. This distinction is explained at 6:52.
ICT Buyside Trade Planning Conditions
ICT’s proposed bullish setup combines direction, timing, and location. At 7:55, he looks for a temporary move opposite the bullish bias (described as a manipulation or “Judas swing”) near a time when the economic calendar may contribute volatility. From 8:14 he says he will buy discount fair value gaps or buy sell stops in a stage 1 or 2 reaccumulation, and at 9:13 he anticipates a five-minute institutional order flow entry drill inside a retracement lower during the London Open or New York Open kill zones.
The stated entry framework includes:
- A broader expectation that price is primed to rally.
- A retracement into a discount fair value gap on a 15- or 5-minute chart (8:24).
- Convergence with a standard-deviation reading; the transcript renders this as “no more than negative 3 standard deviations,” which is ambiguous as transcribed, so the exact direction is unconfirmed.
- Timing during the London Open or New York Open periods used in ICT’s framework.
- A five-minute institutional order-flow entry pattern or a raid on sell-side stops (9:26).
He adds at 8:42 that scalping protocols can be layered onto this stage to reduce risk further. For the lesson’s demo-account exercise, from 9:35 ICT specifies buy-limit orders on all positions at the identified convergence plus five pips. If multiple positions are used, he says they should share the same entry price.
ICT Buyside Trade Objectives and Stop Management
The video proposes scaling out through multiple orders. At 9:59, ICT lists a first limit order for 20 pips on one position and, at 10:06, a second for 40 pips. If a 60-pip objective is reached with at least three separate positions, he says at 10:14 to close 80% of the trade and leave the remainder to see whether there is more room.
His initial protective-stop rule, from 10:30, is to place the stop below the low that converged with the discount array and standard-deviation reading, with an additional 20-pip allowance. He adds at 10:41 that he will re-enter if the trade stops out, noting at 10:47 that day trades may require several attempts to secure a solid entry. He also presents a staged adjustment schedule: reduce stop distance by 25% after reaching 25% of the expected objective (10:56), reduce it by 50% after reaching halfway (11:03), and move it to break-even at 75% of the objective (11:09). At 11:15 he addresses the objection that this holds a lot of open risk by pointing to the partial objectives banked along the way.
These are ICT’s instructional parameters, not universally appropriate risk settings. Pip-based distances have different monetary and market implications across instruments, and the transcript supplies no comparative testing.
ICT Buyside Trade Sizing and Testing
The money-management section starts at 11:42. ICT gives the formula as account equity multiplied by risk percent, divided by the stop distance in pips, and at 12:11 he divides the total intended risk across the number of separate orders — his example being four orders at half a percent each to equal a 2% total. His worked illustration uses hypothetical $20,000 equity, 1.5% risk, and a 20-pip stop, producing a $300 risk figure that he divides by the per-pip value of micro, mini, and standard lots (12:47, 13:12, 13:53), arriving at 150 micro lots, 15 mini lots, or one standard lot because a standard lot cannot be split. He repeats “always round down” after each example and says at 14:26 that mini lots are more flexible because they can be divided.
ICT also proposes reducing the selected risk percentage by 50% after a full loss at that risk (14:31) and restoring it only after recovering half that loss, with a further halving if the reduced risk is also lost. At 15:19 he recommends another reduction after five consecutive winning trades, presenting this as a way to moderate equity fluctuations and avoid a deep drawdown.
The lesson closes at 15:38 by directing students to backtest the plan, collect multiple samples, revisit unclear lessons, and study historical charts. That testing instruction is important: the video lays out a model and its terminology, but its transcript does not provide fills, account results, or anything establishing profitability or predictive validity. The contract quantities in the sizing examples are worked illustrations, not a recommendation.
Watch the original recording
The embed above is the upload’s own YouTube player and it is left in place because it plays. This same iframe markup was loaded from a BestProps origin on 15 September 2026 and clicked: the player reported no error and no owner restriction, and playback advanced past four seconds of the recording’s own 956.96-second duration. YouTube’s help documentation states that a video or playlist can be added to a website or blog by embedding it[4]. All timestamp links above point into the same recording.
How this article used its source
The primary source is ICT Charter Price Action Model 6 \ Buyside Trade Plan, a public upload on the channel The Inner Circle Trader dated 27 January 2024 and running 956.96 seconds[1]. Its transcript was produced by local automatic speech recognition of the complete original audio rather than from YouTube captions, so the wording is automated rather than human-verified; where a term or number was ambiguous it is flagged above rather than smoothed over. The recording’s charts and on-screen annotations were not examined by this review, so the timestamps are pointers into the audio rather than descriptions of what is on screen. Everything attributed to ICT is his stated rule or interpretation, not a verified market outcome.
Sources and further reading
Two outside references frame the risk language above. US federal rules for advertising by commodity trading advisors require that presented simulated or hypothetical performance carry the statement that such results “have certain inherent limitations”, that simulated programmes are designed with the benefit of hindsight, and that no representation is made that any account will achieve similar profits or losses[2]. Separately, the CFTC advises that no technology can consistently predict the future and that anyone trading foreign exchange should trade with a registered dealer[3]. Neither reference is a statement about this recording’s compliance, and this article is independent commentary rather than ICT or channel material.
- [1] ICT Charter Price Action Model 6 \ Buyside Trade Plan (The Inner Circle Trader) — the primary source; use the timestamp links above to compare the explanation with its recording.
- [2] 17 CFR 4.41: advertising by commodity pool operators, commodity trading advisors, and the principals thereof — the hypothetical-performance disclosure rule quoted above.
- [3] CFTC Learn & Protect: Forex Frauds — regulator guidance on unsolicited trading approaches and guaranteed-return claims.
- [4] YouTube Help: embed videos and playlists — platform guidance behind the player embedded above.
Any ICT, smart-money-concept or third-party indicator, script, transcript, note set or social summary circulating outside the publishing channel’s own upload page is unofficial and untested here. Market maker buy and sell models, premium and discount arrays, the dealing range, low-resistance liquidity run, reaccumulation, the Judas swing, institutional order flow entry drill and the “terminus” are the speaker’s own framework and terminology. No win rate, drawdown figure, fill, position size or account result is claimed anywhere in this article, and the timestamped stop, objective and sizing rules above are the lesson’s instructions rather than a tested system.
Leveraged futures and foreign-exchange trading carries substantial risk. Working only the buyside portion of a larger model, scaling out of multiple orders, and re-entering after a stop-out all change the distribution of outcomes, and none of them removes slippage or the possibility of loss. The pip objectives, stop distances and contract quantities in the lesson are worked examples, not a recommendation. This article is independent educational commentary, does not provide individualised financial advice, and reports no outcome from any session or account.
