
Key takeaways
ICT Charter Price Action Model 6 presents ICT’s discretionary theory for interpreting the buy side of market maker models through fractal structures, liquidity narratives, and higher-to-lower-timeframe analysis rather than a disclosed algorithm or tested automated strategy.
Read the full summary
ICT Charter Price Action Model 6 presents ICT’s discretionary theory for interpreting the buy side of market maker models through fractal structures, liquidity narratives, and higher-to-lower-timeframe analysis rather than a disclosed algorithm or tested automated strategy. Traders first identify a premium objective such as an old high or liquidity above highs, then assess first-stage accumulation, second-stage reaccumulation, market structure shifts, fair value gaps, and Model 13 entries within that directional narrative. If price covers more than roughly half the anticipated run before retracing, ICT assumes only one accumulation stage may occur and avoids pyramiding, while a smaller initial move followed by a return into second-stage accumulation may support an additional entry. Unrealized range describes the remaining distance to the objective but does not guarantee it will be reached. A May 31, 2022 S&P e-mini futures example shows accumulation, reaccumulation, movement into premium, and an aggressive decline, while the mirrored bullish case begins in discount and seeks liquidity above prior consolidation. ICT gives extra weight to fair value gaps overlapping prior distribution areas and warns that isolated gaps are insufficient without higher-timeframe bias, liquidity objectives, market structure, time of day, day of week, and sometimes seasonality. The recommended study process is to annotate historical examples across timeframes, journal failures, and use simulation because the lecture provides no controlled performance evidence or assurance that projected objectives will be reached.
How we researched this article
BestProps used document-based research from primary firm sources, checked September 24, 2026. The complete source list, scope, limitations, and commercial-state record appear near the end of this article.
In ICT Charter Price Action Model 6 – Algorithmic Theory, ICT explains how he interprets the buy side of market maker models, low-resistance liquidity runs, and recurring (or “fractal”) price structures. The lecture assumes familiarity with his terminology, so it is best understood as a discussion of how several ICT concepts are combined rather than as a standalone entry system.
Why ICT Price Action Model Narrative Comes First
ICT begins at 0:38 by arguing that market maker buy and sell models can appear on any timeframe because their structures are fractal, but that recognising a familiar shape is insufficient without the logic of the narrative behind it. He says at 1:03 that his process runs through the time frames from highest to lowest looking for that narrative, and at 1:13 that the objective is a key level price can be drawn up to as a form of premium array.
An important distinction follows: a trader can focus on the rising, or buy-side, portion of a larger market maker sell model. In ICT’s framework, price may accumulate and then reaccumulate before reaching an upside objective, after which the sell-side phase could begin. Thus, calling the larger structure a sell model does not mean every part of it is traded short.
ICT Price Action Model Accumulation and Objectives
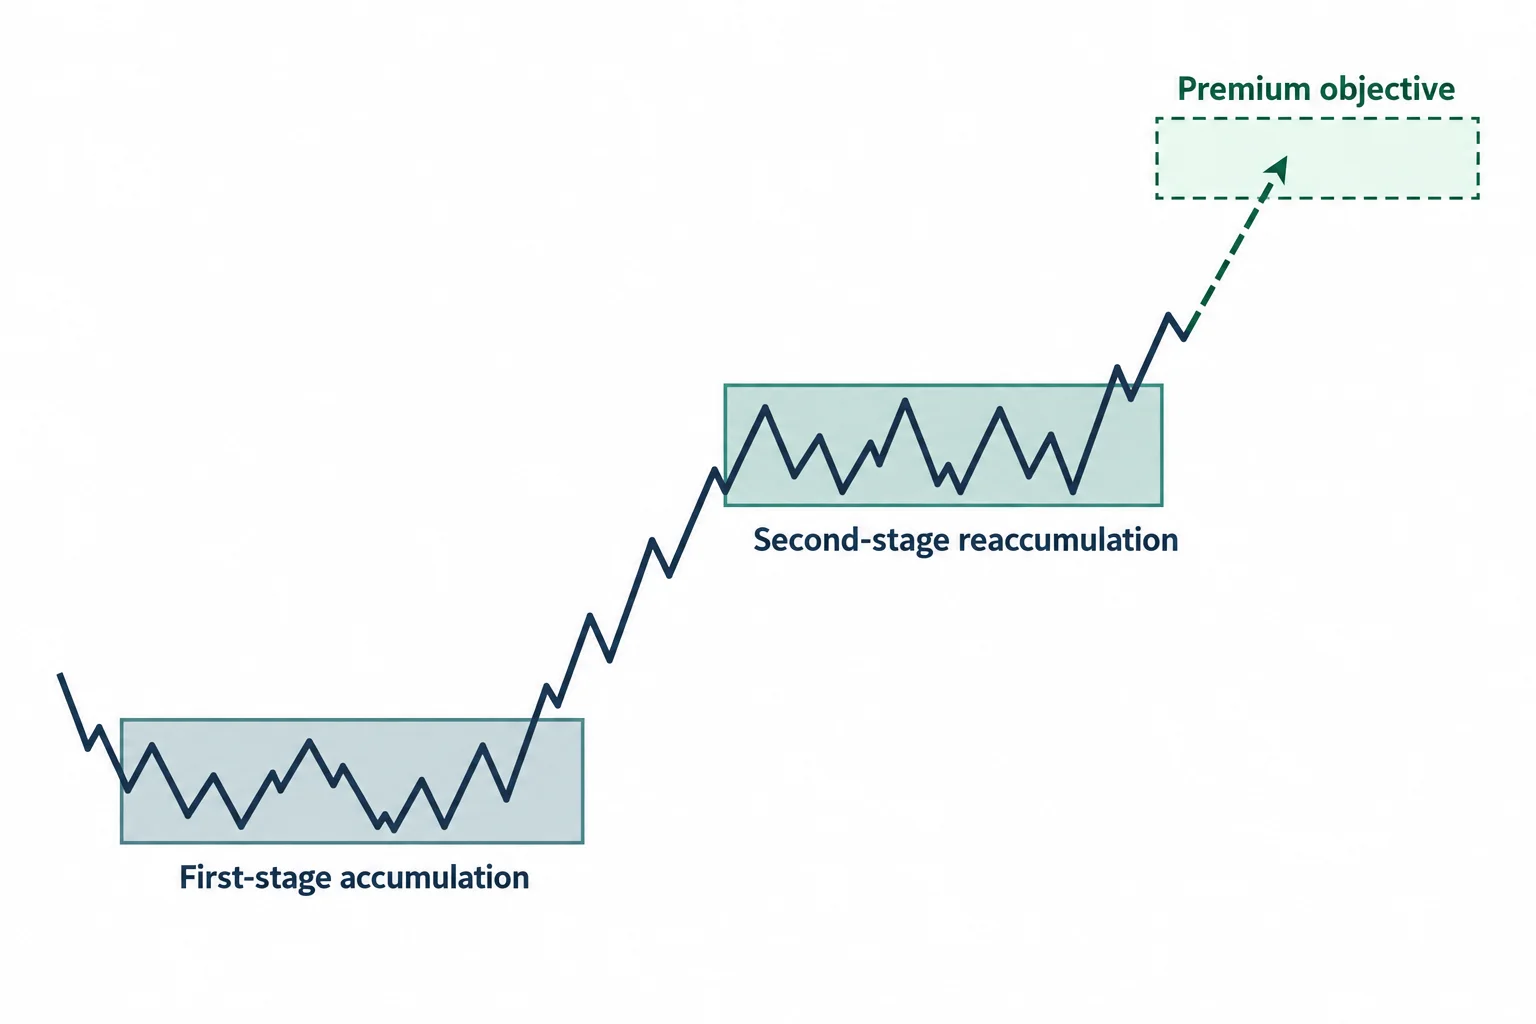
ICT describes two potential stages on the way to a target:
- First-stage accumulation: an initial area from which a bullish move may begin.
- Second-stage reaccumulation: a later pullback or consolidation that may precede what ICT considers the more dynamic part of the advance.
- Premium objective: the anticipated destination, which might be associated with an old high, liquidity above highs, or another reference from ICT’s array terminology.
At 4:13, he identifies this as using the buy side of the curve of a market maker sell model, after walking through the same-morning S&P e-mini example. He then recommends reviewing historical moves across multiple timeframes, tracing strong rallies or declines back to their origins, and annotating whether a market maker model appears to fit the move. This is presented as a study exercise, not proof that the framework predicts markets reliably.
Entry concepts such as a fair value gap or the separately taught “Model 13” are discussed as tools that may be placed inside the broader structure (5:14); he offers 5:21 as the simpler alternative. ICT’s larger point is that an entry pattern should not replace the directional narrative or the identification of a plausible destination.
ICT Price Action Model Pyramiding Rules
The number of accumulation stages also informs ICT’s approach to adding positions. At 8:10 he says that if price has already run more than 50% of the way to the target before retracing, he assumes at that moment that there will be only 8:23, which means he cannot pyramid. If the initial move covers less and then pulls back into a second accumulation area, he considers an additional entry; 22:46 restates the same 50% threshold later in the lecture. The illustrative sizing he gives is ten contracts, then five, then another two or three (23:10). Those figures are his worked example and are not position-sizing guidance.
He calls the distance that remains between the current structure and the objective “unrealized range” (9:04). Crucially, he also states that identifying such a range does not mean the objective will necessarily be reached. Although the lecture later gives illustrative futures contract quantities, those numbers reflect the speaker’s example and should not be treated as position-sizing guidance.
ICT Price Action Model Session on May 31, 2022
ICT discusses charts he says were shared on Twitter the same morning, dated May 31, 2022 (12:32). That session date is distinct from the video’s January 29, 2024 upload date. He recalls using the idea that morning on the S&P e-mini June contract, expecting price to move higher after it failed to take the sell-side level he had anticipated around the 8:30 news period (3:19); he notes at 3:39 that S&P was already at a discount ahead of the 9:30 opening, and describes a shift in market structure and a return into a fair value gap, which price briefly overshot. His stop sat just below the low rather than at it.
Later, he characterizes the example as an initial accumulation, a second accumulation, and a move into a premium area before an aggressive decline (24:48). The transcript records ICT’s retrospective interpretation, but it cannot independently establish chart levels, order fills, timing precision, or the complete outcome.
Reversing the ICT Price Action Buy Model Logic
From 14:56, ICT describes the mirrored case. Price first moves down into what he interprets as a discount area, produces evidence of reversal through a short-term market structure shift, and then forms accumulation and reaccumulation before seeking liquidity above an earlier consolidation.
He explains that an old area of distribution on the declining side of the structure can become a prospective accumulation reference after the reversal (17:06), so the first stage accumulation and the second stage reaccumulation are read from prior up-close candles carried across the curve. In his interpretation, up-close candles preceding earlier declines may be projected across the curve as levels to monitor. A fair value gap overlapping one of those prior areas receives more weight in his analysis than an isolated gap (18:04).
Why ICT Price Action Needs More Than Fair Value Gaps
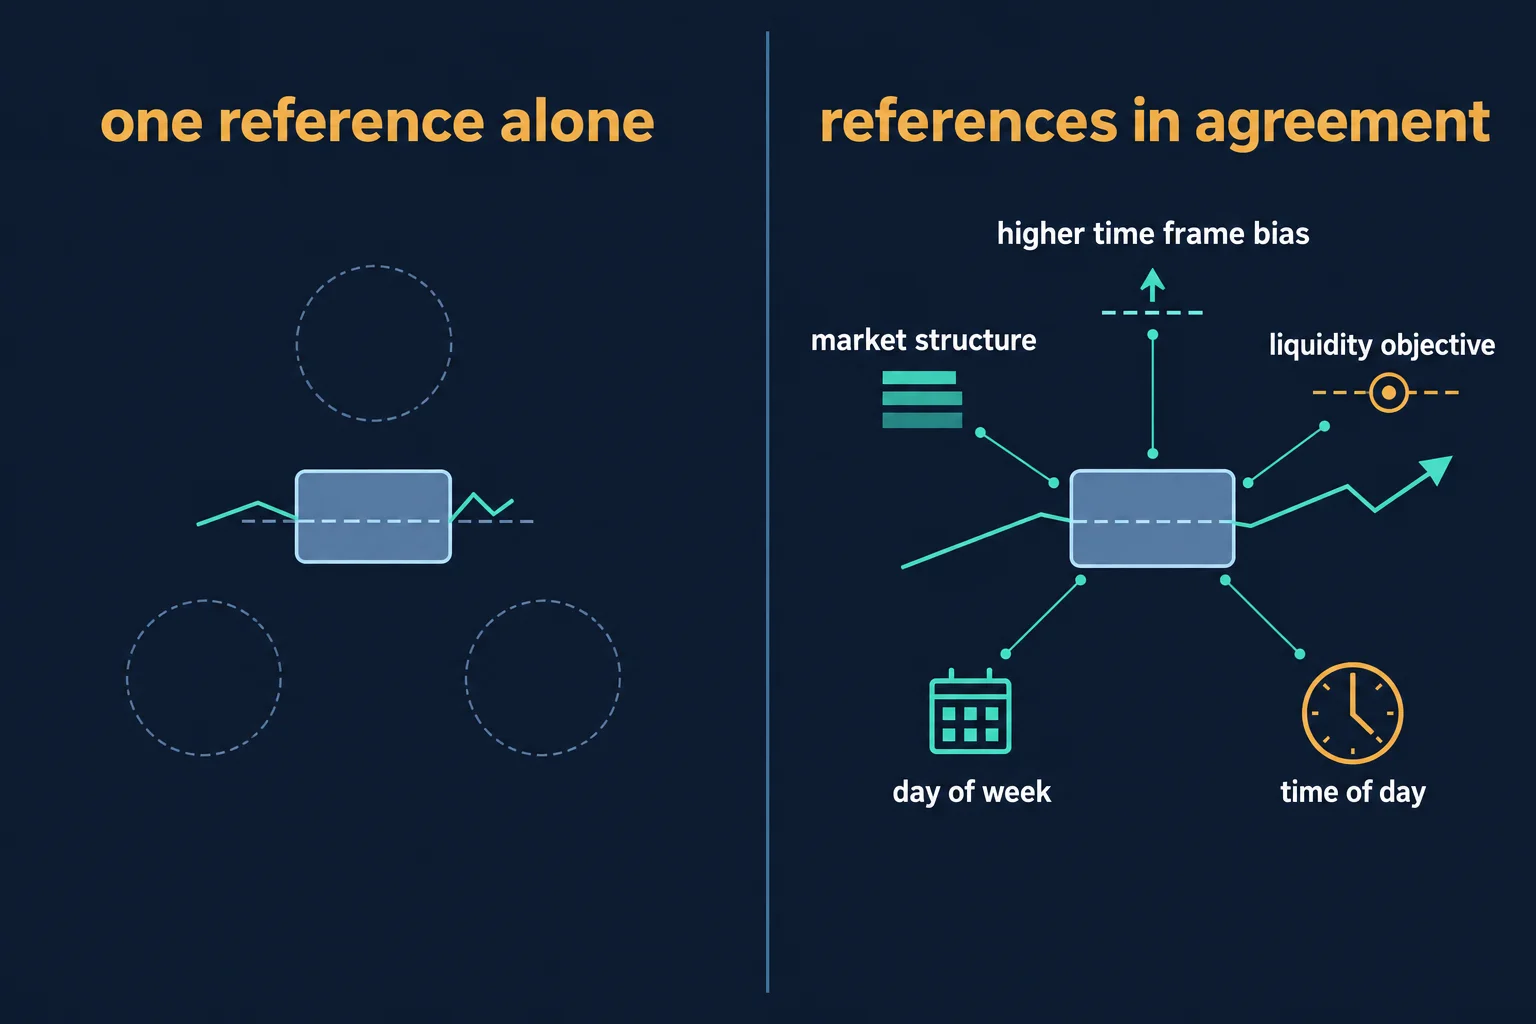
One of the lecture’s clearest cautions appears around 19:10. ICT says he does not want students to turn one concept into an entire model, and at 19:13 he says a fair value gap alone is useless in the hands of a beginner. He instead looks for agreement between the higher-timeframe bias, the anticipated liquidity objective, market structure, time of day, day of week and sometimes seasonality, and at 18:04 he says a fair value gap overlapping an old area of distribution carries far more weight than an isolated one. He also notes at 19:27 that newer students are rushing into live funds on the strength of a single gap.
This emphasis helps explain what “algorithmic theory” means within this particular lesson: not a disclosed computer algorithm, formula, or tested automated strategy, but ICT’s theory that recurring price structures can be interpreted through a consistent set of narrative and liquidity concepts.
One clarification on the terminology: at 24:48 he describes the S&P example as a first stage accumulation followed by a second stage, and later in the same lecture he states plainly that this is not Wyckoff. The accumulation and distribution labels here are his own definitions, balanced against which side of the curve price is on, and should not be read as the classical Wyckoff method.
Practical Lessons From ICT Price Action Model 6
The most source-supported study process is straightforward:
- Begin with a proposed destination rather than an isolated entry signal.
- Review the structure from higher to lower timeframes.
- Look for accumulation or distribution that agrees with the directional narrative.
- Mark possible first- and second-stage formations without assuming either must appear.
- Journal and annotate examples, including cases that fail to follow the expected path.
- Use simulation or paper study while learning rather than rushing into live exposure.
ICT closes at 29:34 by emphasising discipline rather than trading every timeframe simply because the fractal allows it, and at 30:16 by treating a failed exercise or paper trade as a growth pain rather than a failure. His claims about the framework reflect his own market interpretation; the lecture supplies no controlled performance evidence or assurance that its proposed objectives will be reached.
Watch the original recording
The video mapped to this article is ICT Charter Price Action Model 6 — Algorithmic Theory, a public upload on the channel The Inner Circle Trader dated 29 January 2024 and running 1,832 seconds. Every timestamp link above points into that recording. The transcript used for this guide was produced by local automatic speech recognition of the complete original audio rather than from YouTube captions, so its wording should be treated as automated, not human-verified. The recording’s charts and on-screen annotations were not examined by this review.
Reference sources and provenance
These references support specific points in the guide above. None of them is an ICT publication, none endorses or tests the approach, and none is offered as evidence for the statements shown in the recording.
Why the worked example is an illustration, not an audited result
The lecture’s examples are retrospective chart walkthroughs and a stated contract pyramid rather than a disclosed track record, and 17 CFR 4.41 explains why a performance presentation needs care: the regulation’s prescribed statement notes that “these results are based on simulated or hypothetical performance results that have certain inherent limitations,” and adds that “simulated or hypothetical trading programs in general are also subject to the fact that they are designed with the benefit of hindsight.”[2] The recording does not present its example in that form, so no outcome on this page should be read as an audited or independently verified result.
Why the contract figures are not position-sizing guidance
The instructor’s ten-five-three contract sequence is a teaching illustration of pyramiding, not a sizing rule, and the lecture supplies no sample size, win rate or transaction-cost assumptions. The U.S. Commodity Futures Trading Commission states on its Forex Frauds page that “two out of three retail foreign exchange traders lose money each quarter.”[3] That figure is quoted as general context for retail participation across leveraged markets and says nothing about this speaker, his method or the example in the recording.
Why a self-reported example is not independent evidence
The lecture describes charts said to have been posted on Twitter the same morning and repeatedly cites social-media commentary as corroboration. The CFTC’s own investor material advises readers to “learn how to spot and avoid the scams” and to research before acting, and it warns that bad actors exploit social media and mobile platforms in particular.[4] That guidance is cited only as a reason to treat self-reported examples on social platforms as claims rather than verification; it makes no allegation about this speaker or this channel.
Why the player above is the check on every timestamp
The whole article rests on the mapped upload, so the reader’s own control is the embedded player. YouTube’s help documentation states that “you can add a YouTube video or playlist to a website or blog by embedding it” and that age-restricted videos cannot be watched on most third-party sites, redirecting viewers back to YouTube instead.[5] The upload used here is publicly listed and not age-restricted, and the embed was play-tested rather than assumed to work.
Sources
- [1] Primary source: ICT Charter Price Action Model 6 — Algorithmic Theory (The Inner Circle Trader)
- [2] 17 CFR 4.41: Advertising by commodity pool operators, commodity trading advisors, and the principals thereof
- [3] CFTC Learn & Protect: Forex Frauds
- [4] CFTC Learn & Protect: Advisories and articles
- [5] YouTube Help: Embed videos & playlists
Any ICT, SMC or third-party indicator, script, transcript, note set, spreadsheet or social summary circulating outside the publishing channel’s own upload page is unofficial and untested here. Market maker buy and sell models, premium and discount arrays, low-resistance liquidity run, accumulation and reaccumulation, first and second stage distribution, unrealized range, institutional order flow entry drill and the Model 13 entry are the speaker’s own framework and terminology. No win rate, drawdown figure, fill, position size or account result is claimed anywhere in this article.
Leveraged futures and foreign-exchange trading carries substantial risk. Pyramiding into an anticipated run, working only one side of a larger model, and treating a single reference as sufficient all change the distribution of outcomes, and none of them removes slippage or the possibility of loss. The contract quantities in the lesson are worked examples, not a recommendation. This article is educational commentary, does not provide individualised financial advice, and reports no outcome from any session or account.
