
Key takeaways
ICT Charter Price Action Model 6.3 is a short supplementary lesson that applies the existing Market Maker Buy Model to a weekly chart for long-term position trading rather than teaching a new pattern.
Read the full summary
ICT Charter Price Action Model 6.3 is a short supplementary lesson that applies the existing Market Maker Buy Model to a weekly chart for long-term position trading rather than teaching a new pattern. The stated premise is that the model is fractal: the same accumulation, distribution, liquidity and imbalance criteria are sought on one timeframe and the next. Working on weekly gold, ICT labels equal highs above a range as buy-side liquidity, describes two separate accumulation areas inside a broad band, and then drops to the daily chart to read order blocks and fair value gaps as the internal delivery of that larger structure. He then compares gold with the US Dollar Index, argues the two are usually inversely correlated but can diverge while one of them consolidates, and states a conditional 2019 view that a dollar rally above 98.40 would be bearish for gold while explicitly calling the longer-term conclusion conjecture. A further section contrasts the futures chart with the cash chart, where an area he calls a volume imbalance on futures appears as a fair value gap on cash. The lesson closes by naming nothing new: Model 6 simply applied to a weekly chart, with an invitation to compare the same areas against the Dollar Index using SMT and seasonal tendencies. No performance record, fill, position size or outcome is claimed here, and the charts were not examined by this review.
How we researched this article
BestProps used document-based research from primary firm sources, checked September 24, 2026. The complete source list, scope, limitations, and commercial-state record appear near the end of this article.
In ICT Charter Price Action Model 6.3 – Supplementary Lesson, ICT extends his Market Maker Buy Model from shorter-term trading into weekly-chart position analysis. The central message is that the model is intended to be fractal: its underlying sequence does not change when the chart timeframe changes.
The lesson uses gold and the US Dollar Index as its principal examples. It is spoken as a recording made on July 31, 2019, which he states at 0:44 (“we are on the 31st of July 2019”); the YouTube upload date is January 26, 2024. The two dates describe different events — when the session was delivered and when the file was published — so the material is a retrospective recording of a 2019 market discussion, not a current forecast. Because the transcript is speech only, the discussion below explains ICT’s stated framework without independently confirming the marked levels or any subsequent market outcome.
Apply the ICT Model to Weekly Price Action
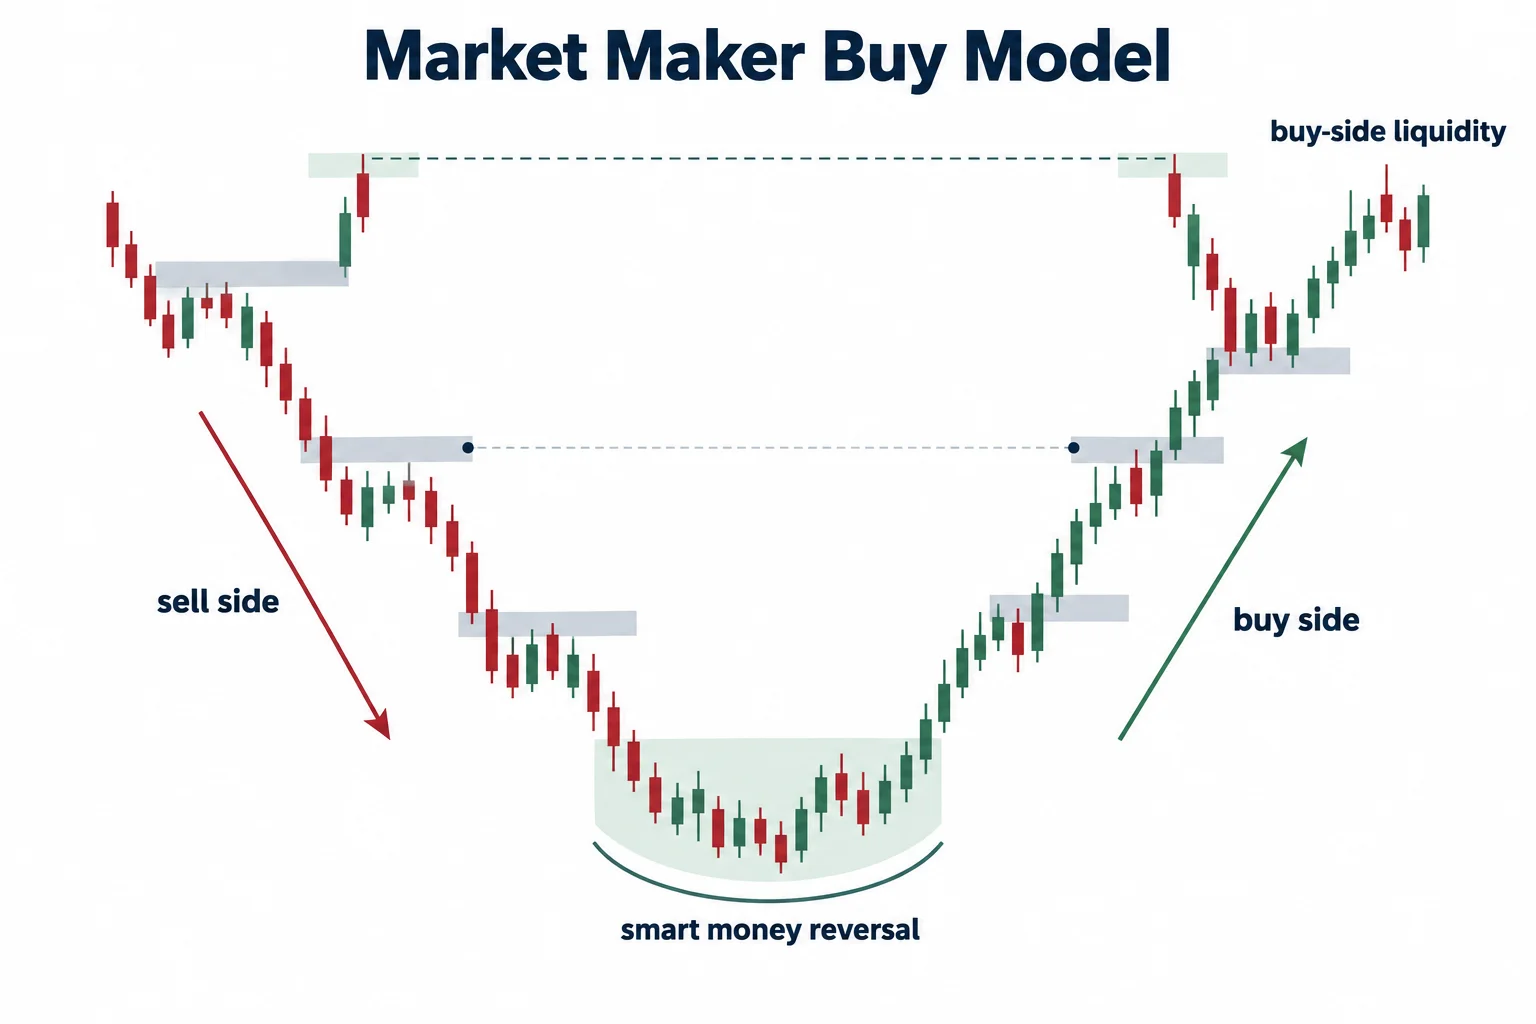
ICT opens by distinguishing this lesson from the model’s usual application to scalping, day trading and shorter swing trades. At 2:34, he says that understanding the Market Maker Buy Model is necessary before any understanding of higher-timeframe long-term position trades. From 2:53 he characterizes the buy and sell models as fractal: the things looked for on one timeframe are the same things sought on other timeframes, so nothing wholly new is being introduced.
In his terminology, the illustrated structure has a sell side to the left of the curve and a buy side to the right of the smart money reversal. He maps points of reference from the earlier decline or distribution into later areas where he interprets price as accumulating and rebalancing. Equal highs above the structure are labelled buy-side liquidity and become a prospective draw for price, as he states at 5:17.
He also pre-empts a common misreading. From 3:54 he says untrained observers quickly conclude they are looking at Wyckoff, and at 4:15 he states plainly that this “is not Wyckoff” and that what he teaches is beyond its scope. At 4:56 he adds that he is not working with supply and demand zones but with “specific criteria relative to a model of accumulation and distribution.” That distinction is his own framing of the method rather than a settled classification, and the transcript supplies no independent test of it.
Gold in the ICT Weekly Buy Model
Beginning around 5:17, ICT identifies equal highs as buy-side liquidity and discusses a move from an accumulation area toward an earlier distribution area. At 6:32 he points to how much time price spent inside the range and calls that accumulation. Because each candle represented one week, the setup illustrates the patience he associates with position trading.
He then moves from the weekly chart to a daily chart at 8:19. Within the larger weekly area, he describes:
- a rally away from support;
- a return to what he calls a bullish order block, at 8:55;
- a small fair value gap;
- further accumulation followed by upside expansion; and
- additional pullbacks that, within his framework, could refine a higher-timeframe entry area.
At 9:26 the automatic transcription returns a number that reads as “130.29.6” and states that price went one point into the fair value gap under what he calls the institutional order flow entry drill. The transcription does not produce a coherent price value there, so the figure is flagged as an unresolved ambiguity rather than repeated as a level, and this review did not examine the charts to settle it. Equally, the fair value gap comparison in the cash-market section is reported by the recording at 19:36 using a value this review did not verify against a chart. The durable educational point is not any number but the top-down process: define the weekly model first, then use daily imbalances or order blocks to study the internal delivery of price.
Compare Gold and Dollar Price Action in the ICT Model
A second part of the lesson considers gold alongside the US Dollar Index. ICT notes that the two markets are commonly viewed as inversely related — at 17:19 he says they are “diametrically opposed” — but he argues that consolidation can complicate that relationship. In his reading, the dollar could remain inside a broad range while gold still rallied.
At 12:08, ICT gives a conditional 2019 scenario: a stronger dollar move above a level he states as 98.40 would, in his view at that time, be bearish for gold. At 13:06 he explicitly calls the longer-term conclusion conjecture and says he does not know it for certain. This matters for how the passage should be read: it records a contemporaneous market interpretation delivered in July 2019, not a verified rule, a tested signal or a current forecast. No follow-through on that level is established anywhere in the recording.
Later, at 17:15 and 17:43, he emphasizes the need to wait when directional evidence is incomplete, saying he has “no shame” in stating that he does not know and has to wait for more information. His stated process is to identify specific criteria, observe whether they occur, and only then form a stronger bias. At 15:42 he makes the same point about not forcing a model when its expected elements are absent. That restraint is one of the lesson’s most generally useful educational ideas.
Compare Futures and Cash Price Action in the ICT Model
ICT briefly compares the August and October gold futures contracts. He says nearby contracts should generally be examined, and at 13:58 explains that although October is later in the year, he would generally roll to it because October “generally has all the open interest,” while August is the nearby contract during May and June. The transcript supplies no exchange open-interest data with which to verify that observation, and contract specifications define the listed months rather than which one carries the most open interest on a given date.
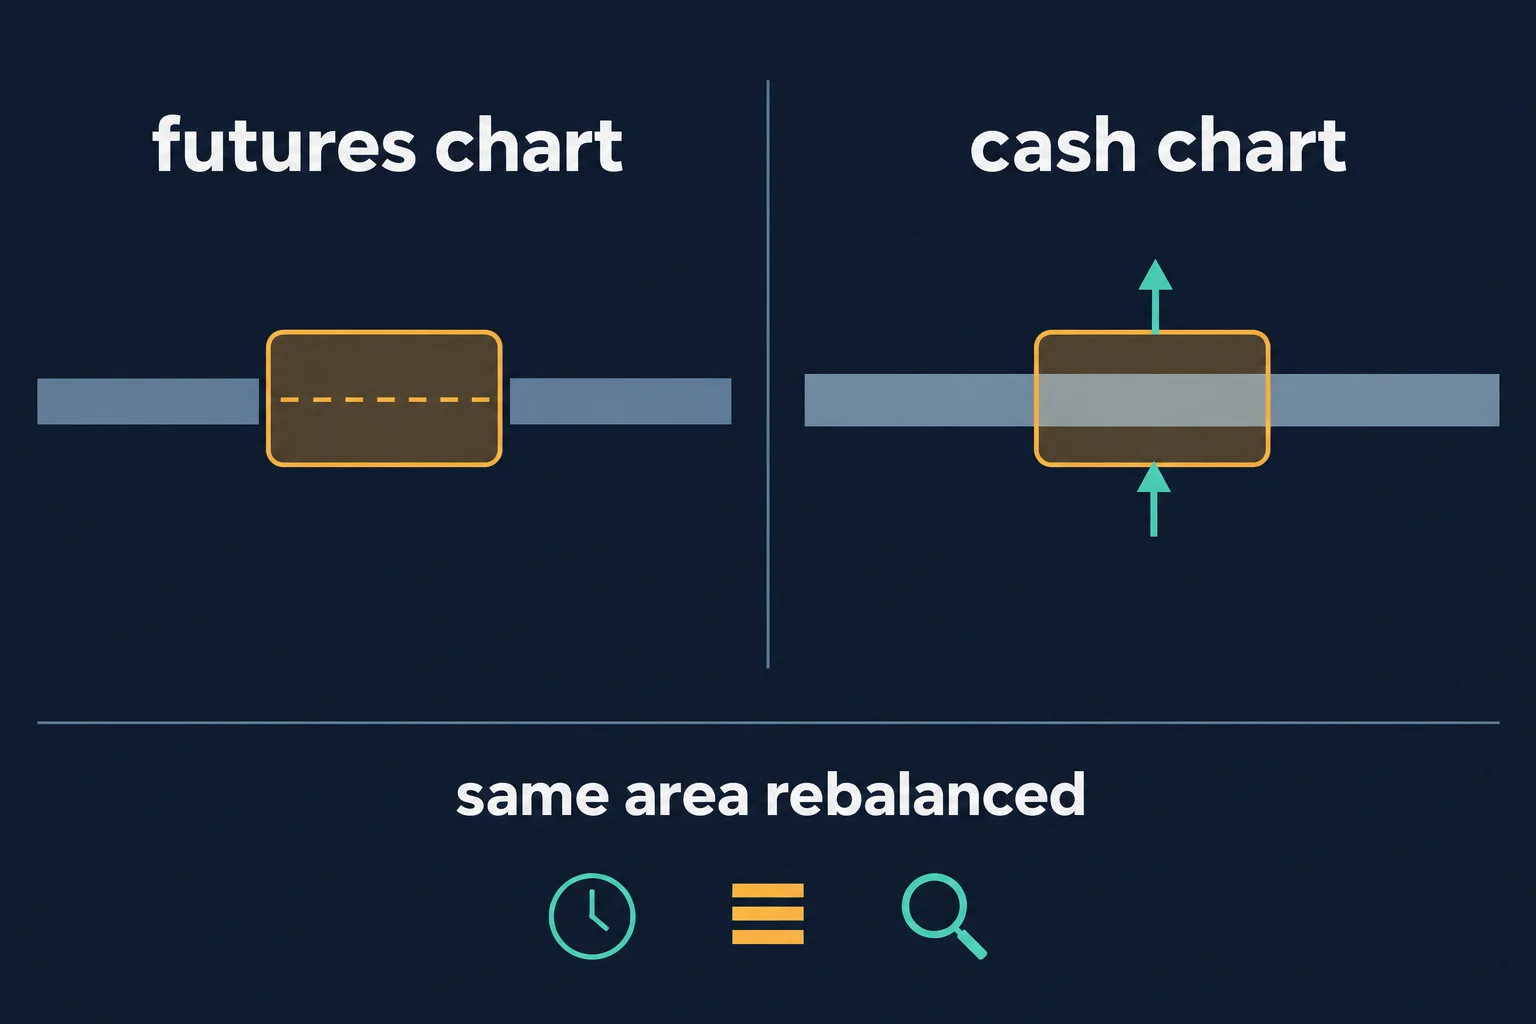
At 18:35, he switches to the cash gold market. From 18:49 he says an area displayed as a volume imbalance on the futures chart appears as a fair value gap on the cash chart, and at 19:36 he describes the same structure as trading back to the same value on that candle’s high and low. In his interpretation, the cash chart shows that gap being rebalanced before consolidation and an upside move. The comparison demonstrates why instrument and contract selection can change the appearance of an otherwise similar price structure.
Study the ICT Weekly Price Action Lesson
ICT closes by reiterating that no new model is being introduced. At 20:42 he says “nothing new is needed” and describes the session as the original presentation applied to a weekly chart. A source-grounded study routine based on what is actually stated would be:
- Identify the broad weekly accumulation, reversal and expansion sequence he describes.
- Mark the earlier distribution references and the liquidity he identifies above equal highs.
- Move to the daily chart to examine order blocks, fair value gaps and consolidations within his terminology.
- Compare corresponding periods in gold and the Dollar Index rather than assuming a mechanically inverse relationship.
- Record uncertainty when the expected criteria are not aligned, as he does himself at 17:43.
Near 20:33, ICT summarizes the supplementary lesson directly: it is the existing Model 6 presentation applied to a weekly timeframe. At 21:14 he suggests further comparison with the Dollar Index using concepts he calls SMT and seasonal tendencies, but those topics are not developed in detail here.
Two limitations of the source itself should be stated plainly. First, the material here was produced by automatic speech recognition of the recording’s full audio rather than from human-verified captions; it carries no low-confidence segments, but automated transcription can still mishear terms and numbers, which is why the one clearly doubtful figure above is flagged rather than repeated as a level. Second, this review read the transcript, not the charts, so no on-screen annotation, marker or level described in the recording has been visually confirmed here.
Watch the original recording
The embedded player above is the same public upload used for every timestamp in this article, so each cited moment can be checked directly against it rather than taken on trust.
Reference sources and provenance
These references support specific points in the guide above. None of them is an ICT publication, none endorses or tests the approach, and none is offered as evidence for the statements made in the recording.
Why a conditional market call is an interpretation, not a tested signal
The lesson’s 98.40 dollar-index threshold is a stated conditional view delivered in July 2019 and called conjecture by the speaker himself, and 17 CFR 4.41 explains why performance-style presentations need care: the regulation’s prescribed statement notes that “these results are based on simulated or hypothetical performance results that have certain inherent limitations,” and adds that “simulated or hypothetical trading programs in general are also subject to the fact that they are designed with the benefit of hindsight.”[2] The recording presents no such statement and reports no outcome, so nothing on this page should be read as an audited or independently verified result.
Why retail leverage context matters for a position-sizing read
The lesson discusses accumulating longs on a weekly chart and rolling between contract months, but supplies no position size, account size, sample or transaction-cost assumptions. The US Commodity Futures Trading Commission states on its “Eight Things You Should Know Before Trading Forex” page that “Two out of three forex customers lose money” and warns that “this high degree of leverage amplifies both gains and losses.”[3] That is general context for leveraged retail participation; it says nothing about this speaker, his method or the gold example in the recording.
Why a reported framework is a claim rather than corroborated evidence
The lecture repeatedly refers to prior mentorship commentary as supporting what he had expected, and describes the weekly structure as “essentially really what it did” at 6:44. CFTC staff research on retail futures traders uses regulatory data on overnight positions and required margins and reports that “in general, we fnd that retail traders lose money in futures markets,” with the same study showing that traders “on average, lose more money the longer they trade.”[4] It is cited only as context for treating self-reported expectations on charts as claims rather than verification, and it makes no allegation about this speaker or this channel.
Why the player above is the check on every timestamp
The whole article rests on the mapped upload, so the reader’s own control is the embedded player. YouTube’s help documentation states that “You can add a YouTube video or playlist to a website or blog by embedding it” and notes that “Age-restricted videos can’t be watched on most 3rd party websites.”[5] The upload used here is publicly listed and not age-restricted, and the embed was play-tested rather than assumed to work.
Sources
- [1] Primary source: ICT Charter Price Action Model 6.3 — Supplementary Lesson (The Inner Circle Trader)
- [2] 17 CFR 4.41: Advertising by commodity pool operators, commodity trading advisors, and the principals thereof
- [3] CFTC: Eight Things You Should Know Before Trading Forex
- [4] CFTC Office of the Chief Economist: Retail Traders in Futures Markets
- [5] YouTube Help: Embed videos & playlists
Market maker buy and sell models, institutional order flow, fair value gaps, order blocks, buy-side liquidity, SMT, seasonal tendencies and the “one shot one kill” entry are the speaker’s own framework and terminology. Any ICT, SMC or third-party indicator, script, transcript, note set, spreadsheet or social summary circulating outside the publishing channel’s own upload page is unofficial and untested here, and no independent source was found that validates the method or reports a verified result for it.
Leveraged futures and foreign-exchange trading carries substantial risk. Accumulating a position on a weekly chart, rolling between contract months and holding through prolonged consolidation all change the distribution of outcomes, and none of them removes slippage, financing costs or the possibility of loss. This article is educational commentary, does not provide individualised financial advice, and reports no outcome from any session or account.
