
Key takeaways
The Inner Circle Trader reviews a September 2026 NQ high of day short using the prior Friday 21 August first qualifying one-minute fair value gap from the 9 thirty-one a.m.
Read the full summary
The Inner Circle Trader reviews a September 2026 NQ high of day short using the prior Friday 21 August first qualifying one-minute fair value gap from the 9 thirty-one a.m. candle, repeated body failures above its midpoint or consequent encroachment, relative equal highs, overnight expansion followed by a seven a.m. to nine a.m. premarket range, and converging wick-based and body-based projections. He defines the regular-hours day opening gap as the distance from the prior session’s four fourteen p.m. final one-minute print to the nine thirty a.m. open, labels an open above the prior close a premium gap, and claims a 70 percent likelihood of reaching its midpoint by ten a.m. without providing supporting data. After price probed equal highs into an opening-gap area, he shorted the move back down, added within the premium portion of a wick area while requiring bodies to remain below the wick midpoint, took a large first partial below an earlier low, and let the final contract stop out near the new-day opening gap before price reversed higher. He grades the high read favorably but calls exit precision his weakness and says a limit just above the gap would have been preferable. His chart-hygiene rule keeps only first presented fair value gaps from prior Mondays and Fridays on the execution chart while storing older new-week opening gaps separately. TradingView Bar Replay can test whether each condition was visible bar by bar, but the captions cannot verify annotations, fills, outcomes or profitability, and the event-week Jackson Hole context, opening-gap probability and single retrospective trade are untested speaker claims rather than a validated system.
How we researched this article
BestProps used document-based research from primary firm sources, checked September 25, 2026. The complete source list, scope, limitations, and commercial-state record appear near the end of this article.
In NQ High Of Day Short Review, ICT reviews an NQ short idea built from a prior Friday’s fair value gap, relative equal highs, and the shift from overnight expansion into a consolidated premarket range. He records it on what he calls his last trading day of that week, reviews that same morning’s session, and warns ahead of time that the Jackson Hole Symposium week can produce erratic, “highly manipulated” price action in his words.
What follows is drawn from the machine-generated captions of that recording, with timestamps. The captions describe the charts but do not show them, so they cannot verify the annotations, the orders, the fills or the outcome; every reference level, entry and exit below is presented as the speaker’s own account. Nothing here is a recommendation, and a single retrospective review cannot establish that the approach repeats.
Educational review only. Futures trading carries a substantial risk of loss, and this article describes one trader’s interpretation of one session, not a tested system.
ICT NQ Day Session Backdrop
After a note that it is his last trading day of the week (0:07), he opens on the daily chart of the September 2026 NQ contract. At 0:32 he marks what the captions render as a buy-side imbalance / sell-side inefficiency (his own grouping of a large range the market has to deal with intraday) and points out that price spent five days inside it (0:52).
He is also explicit that an earlier expectation did not deliver. Around 1:03 he describes wanting price to reach down into that imbalance area before the 6:00 p.m. Eastern restart, and notes that it came close and refused. That admission matters: the short case later in the video is a reset of the idea, not a continuation of a forecast that worked.
From 1:24 he frames the week itself, saying the symposium runs Thursday and Friday and brings unusual behaviour, and at 1:44 he calls the market “highly manipulated” during that window and tells viewers to write it in their journal. That is his characterization of event-week conditions, not something the captions establish.
ICT Fair Value Gap Reference
The lesson proper starts at 12:32, where he drops to the one-minute chart and goes back to Friday, 21 August 2026. He is precise about which candle he is using: the first presented fair value gap is taken from the 9:31 candle, not the 9:30 one (13:35), and he later returns to that point to say the 9:30 candle was deliberately skipped because it did not supply the structure he wanted (17:14).
He then projects that gap into the current session and reads the behaviour around its midpoint, which he calls consequent encroachment. The important detail is not that price touched the area but that the candle bodies repeatedly failed to establish themselves above it (16:12). That reading is what he says gave him confidence that the relative equal highs would only be probed, not broken with follow-through, “just to clear that,” as he puts it at 15:59.
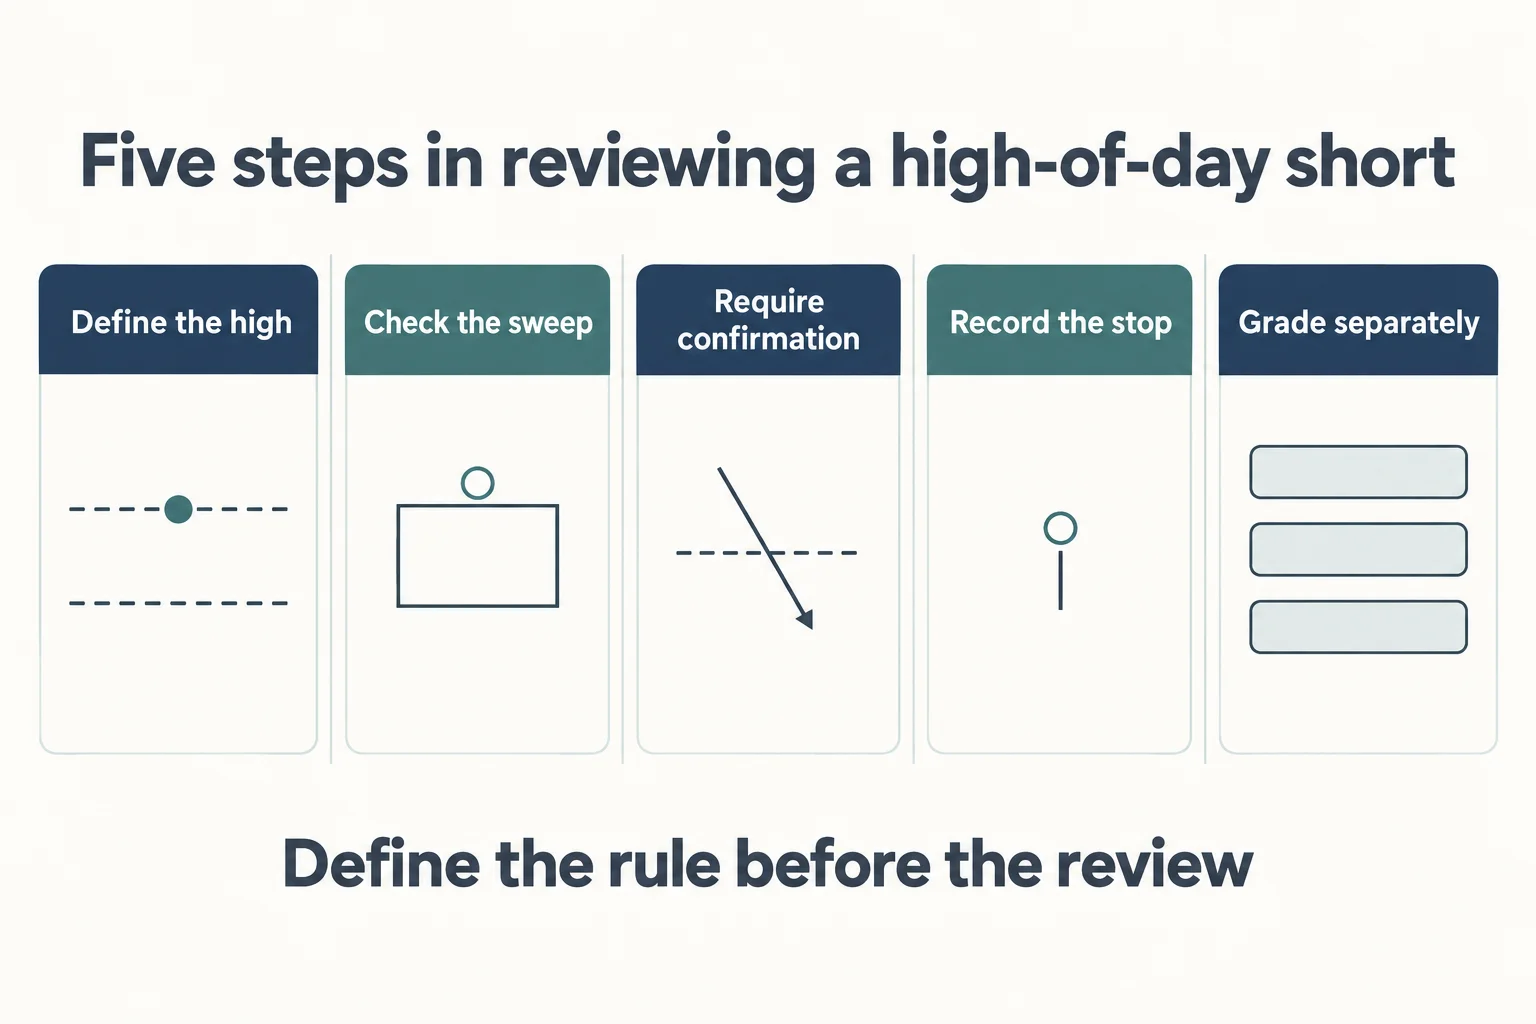
For study purposes, the sequence he asks viewers to track is:
- Mark the first qualifying fair value gap from the prior Friday.
- Carry that range forward into the current session.
- Divide it at its midpoint.
- Compare body closes against wick penetration around that midpoint.
- Read that behaviour alongside nearby liquidity rather than treating the gap as a signal by itself.
He also spends time on chart hygiene. At 28:42 he argues for a chart that holds only the first presented fair value gaps from the prior Mondays and Fridays, and at 43:09 for keeping older new-week opening gaps in a separate workspace instead of crowding the execution chart with every possible level.
ICT Overnight Expansion and Day Session Range
At 23:59 he adds a session-level argument: the market traded overnight and was permitted to trend (24:38), and then, from the 7:00 a.m. hour into his 9:00 a.m. premarket window, it started creating a range instead (28:13). Read through his framework, a session that has already trended makes a range or a reversal in the next window more likely. This is a contextual heuristic he states, not a finding: the video contains no dataset, sample or test result behind it.
He applies the same body-versus-wick logic to an earlier wick. At 31:57 he describes grading a wick with a fib drawn from the bodies’ high to the wick’s high: when his read is bearish, he wants bodies to stay below that midpoint, while accepting that the wick itself may do the damage. In this case he says the wick traded through the 9:31 21 August imbalance (32:16) and then closed well back underneath it.
ICT Day Opening Gap and the 70 Percent Claim
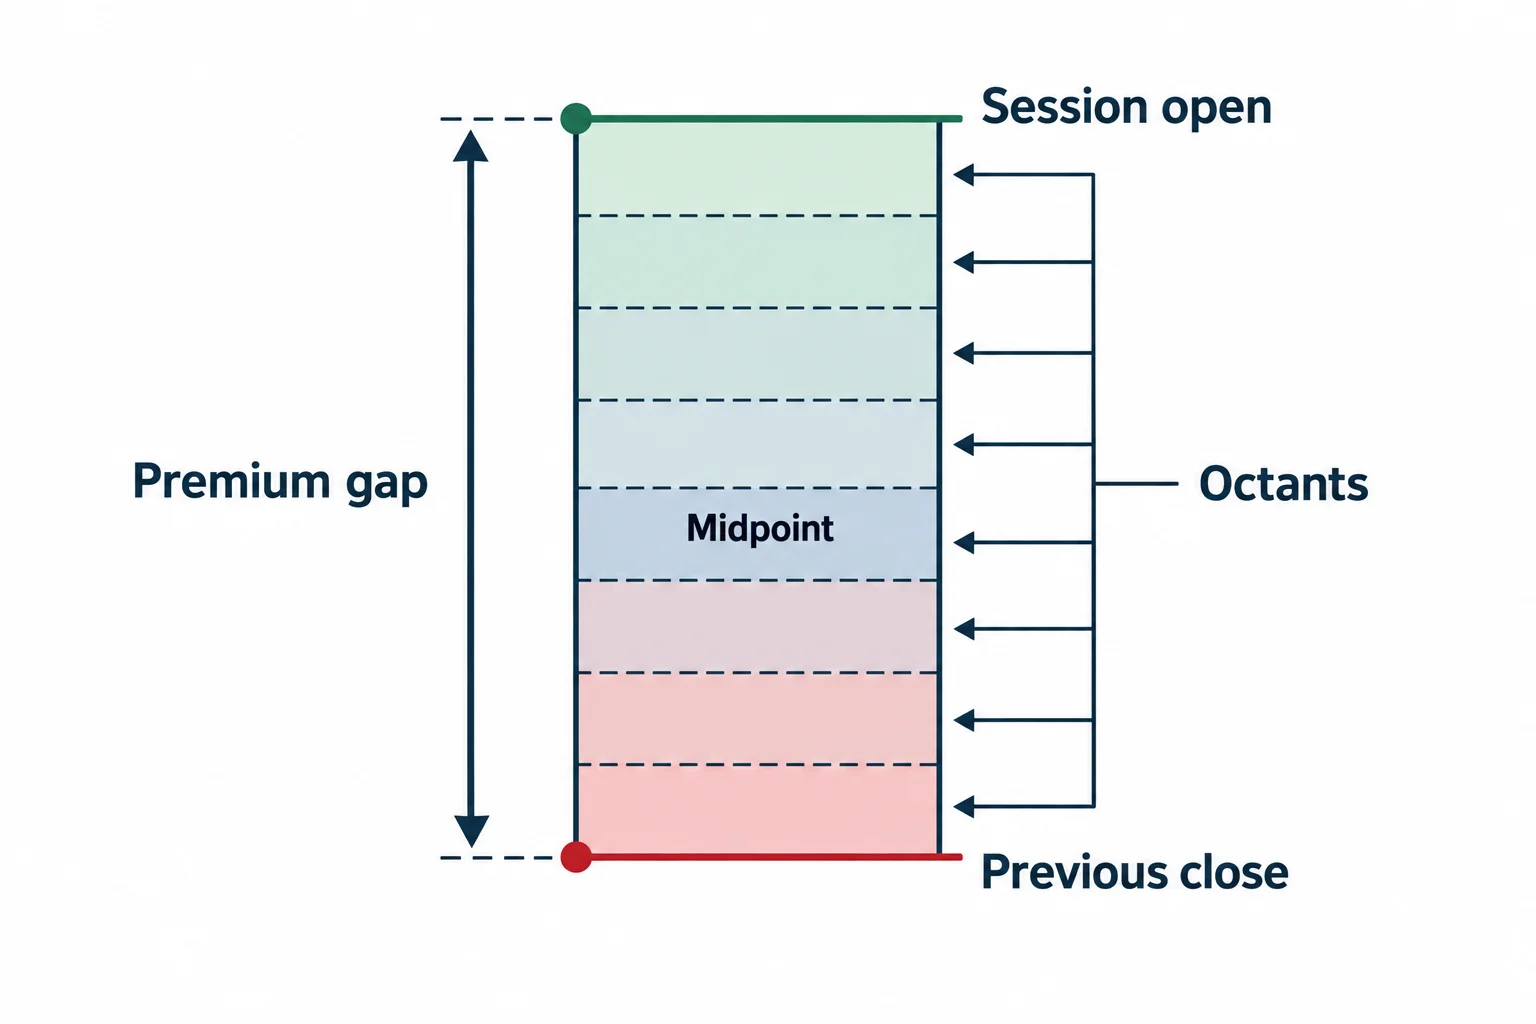
From 38:08 he introduces the regular-trading-hours opening-range gap, and at 38:59 defines it as the distance between the previous session’s final one-minute print at 4:14 p.m. Eastern and the 9:30 a.m. open. Because the new session opened above that close, he calls this one a premium gap. He then measures the gap with a fib so its octants and midpoint become usable references (39:20), and at 41:25 states the rule he attaches to it: a 70% likelihood of trading to the midpoint by 10:00 a.m. Eastern.
Treat that figure as the speaker's claim. No study, sample period or method is offered in the recording, and the midpoint of an opening-range gap is a descriptive geometric level rather than a tested probability. Later in the video he returns to the same level as half the gap (1:01:53) and describes a staged approach (take a first partial below an earlier low, then see whether the market will gravitate to mid-gap) while telling viewers not to demand a full gap closure (1:02:53).
ICT High of Day Short Setup
At 49:11 he sets up the trade context: a premarket consolidation, a Judas-style swing he discounts because it occurred before 9:30, then a run higher out of the 9:29–9:30 candles and into relative equal highs, with a new-week opening gap above. Rather than treating the equal highs as a preset sell zone, he says he wanted to see how price behaved if it ran above them and failed to reject inside the opening gap.
His case then rests on two measured projections. The first is read from the wick at 51:54, where he judges how far the wick could extend and notes that the projected level and the eventual high landed very close together. The second switches the measurement to the candle bodies at 53:33, where he finds bodies stopping at the same area. At 54:28 he calls the agreement between those two readings the confirmation that “that’s the high today,” and says he went short as price traded back down (54:39), aiming at the new-week opening gap.
He also describes adding to the position inside the premium part of a wick area, on the condition that no body closes above that wick’s midpoint (56:37). He frames that as an inversion fair value gap he did not need to draw because he already knew the level. All of the quantities, levels and fills in this section are his reported account; the captions cannot authenticate an order ticket, and the prices the captions do carry are partly garbled, which is why none are quoted here.
ICT Short Management Lesson
The exit discussion is the most useful part of the recording because he does not present it as clean. He reports taking a first partial below an earlier low (57:26), citing the event week and the whippy conditions as the reason to remove a large portion there. He then describes his final contract being stopped out as price reached the new-day opening-gap area and ripped higher (58:27), and says he had wanted the limit order placed just above that gap instead, which is where he says he would have exited.
His own assessment is blunt. Around 55:37 he acknowledges a wild spike he expected during the day and says his exits were not correct, calling exit precision his weak point; at 1:11:35 he explains that he saw the stop-out coming and let it happen rather than adjusting on the recording. Read as a lesson, the entry logic and the exit logic are graded separately: he defends the read on the high and criticizes the handling of the last contract.
ICT Opening Gap Review Takeaways
The transferable part is not “short equal highs.” In his own telling, several elements had to line up: an overnight session left free to trend, a premarket range after it, a prior Friday’s first presented fair value gap, bodies failing to hold above that gap’s midpoint, a probe of relative equal highs into an opening-gap area, and agreement between a wick-based and a body-based measurement before he engaged. Remove any of them and the argument in the video does not stand on its own.
A useful exercise is to rebuild the sequence on historical charts: mark the prior Friday gap, extend and halve it, record where bodies closed relative to the midpoint, and log whether each condition was actually visible bar by bar before the high formed. Then record the failures with the same care as the successes. Nothing in the recording (including the reported partial and the reported stop) constitutes evidence of profitability, and no broker statement, contract specification or independent price data is checked in this article.
ICT NQ High of Day Short Video
The mapped source lesson is NQ High Of Day Short Review from The Inner Circle Trader. This BestProps article is independent educational commentary grounded in that recording’s captions: it is not a transcript, not an official ICT lesson, and not evidence that any entry, exit or result described in the recording occurred as reported.
Watch the original lesson on YouTube
This recording cannot be played inside another website. A test run from a BestProps page on 13 September 2026 loaded the YouTube player for this video and the player itself returned “Playback on other websites has been disabled by the video owner,” with no playback position and no media data, so no player is embedded here and no owner restriction beyond that message is asserted. You can watch the full lesson directly on YouTube.
ICT Opening Gap Review References
Four references support the practical side of this article: the exchange page that defines Globex session hours, vendor documentation for replaying a session bar by bar, a user-published script that implements this style of logic, and an unofficial community summary of the same recording.
Confirm the ICT Session Clock
CME Group publishes holiday and trading-hour schedules for CME Globex and its other venues, states that the schedule is subject to change and that holiday hours are usually finalised about two weeks before the holiday, and provides downloadable holiday calendars covering the 2026 and 2027 calendar years.[1] The same page lists the 2026 dates, including Labor Day on Monday, 7 September 2026, and shows opening and closing times for different venues in the time zone each venue uses.
That matters here because “high of day” only means something once the session, the product and the time zone are fixed. The recording works in Eastern time and refers to a 4:14 p.m. close and a 9:30 a.m. open; a template built around another venue, contract or clock will not produce the same reference levels. Check the product, the venue and the time zone rather than trusting a saved layout.
Use Replay to Review the ICT Sequence
TradingView’s help page documents opening the Bar Replay panel from the chart, selecting a starting point, stepping forward one bar at a time, adjusting speed, restarting from a different point, running replay across a multi-chart layout, and jumping back to live data.[2] It also lists limits that matter for this workflow: server-side alerts keep firing on real-time data and new ones cannot be created during replay, trading orders are executed against real-time data, non-standard chart types are incompatible with replay, and spread and tick-based charts do not work in it.
Used honestly, replay is how you test whether the levels and the body-versus-wick behaviour described above were knowable at the moment of the decision rather than only in hindsight. It cannot recreate the live conditions of an event session.
Read the ICT Script as a User Publication
A public TradingView script targets a 9:45–10:15 a.m. New York window: NQ 9:45-10:15 ICT Strategy – Complete by the TradingView user uzair2join.[3] It is an openly published, open-source community script that describes a rules-based combination of a daily bias filter, a previous-day high or low sweep, a market-structure shift and order-block mitigation inside that 30-minute window, with one trade per day and a fixed risk-reward target. Its “high-probability” wording is the author’s own description.
It is a third-party indicator, not an official Inner Circle Trader product, and it is not the tool used in this recording. BestProps has not installed, tested or verified it, has not confirmed that its signals stay fixed after a bar closes, and makes no claim about its accuracy, profitability or suitability. Treat the window as a user-chosen parameter until you have validated it on your own data with realistic costs.
Treat the ICT Video Review as Unofficial
The ICT Archivist entry dated 2026-08-26 is a community recap of the same recording and links to the same video.[4] It is a community-run archive that summarises Inner Circle Trader recordings in its own words and is credited to a summarising account rather than to the instructor. It is not the original lesson, not an official ICT publication and not affiliated with BestProps, and it is not the source of any claim in this article. The captions of the recording are.
Its summary broadly matches themes in the recording: prior-Friday and Monday fair value gaps, wick midpoints as decision lines, opening-range-gap octants with a 70% reference toward mid-gap, relative equal highs as buy-side liquidity, keeping charts uncluttered, and a reported stop on a single contract. All of that is the summariser’s paraphrase of reported remarks and reported outcomes, not a verified result.
ICT Sources and Tool Documentation
- [1] CME Group: Holiday and Trading Hours (CME Globex)
- [2] TradingView Help: How do I turn Bar Replay on?
- [3] TradingView: NQ 9:45-10:15 ICT Strategy – Complete by uzair2join (unofficial community script)
- [4] ICT Archivist: NQ High Of Day Short Review (unofficial summary, 2026-08-26)
BestProps is not affiliated with CME Group, TradingView, ICT Archivist or the Inner Circle Trader, and no source listed here endorses this article or any setup. Liquidity sweep, market structure shift, fair value gap, opening-range gap and order block are used as descriptive study terms. Nothing on this page demonstrates a tested, repeatable or profitable result.