
Key takeaways
The Inner Circle Trader reviews a 13 minutes 30 seconds bearish NQ futures morning using four signals, buy-side liquidity swept above relative equal highs, displacement through a swing low, a return to the consequent encroachment of the first presented inversion fair value gap, and SMT divergence as NQ made a higher high while ES did…
Read the full summary
The Inner Circle Trader reviews a 13 minutes 30 seconds bearish NQ futures morning using four signals, buy-side liquidity swept above relative equal highs, displacement through a swing low, a return to the consequent encroachment of the first presented inversion fair value gap, and SMT divergence as NQ made a higher high while ES did not. ICT reports a short fill just below 687 even, roughly 11 handles of adverse movement, relative equal lows and a stated 30,496 sell-side level as targets, and a missed opportunity to capture more of the decline. His first presented fair value gap is not merely the first visible gap but the imbalance contextualized by the liquidity sweep and swing-low displacement. He marks the June 1 Monday daily high, defines the lunch macro as 11 30 a.m. to 1 30 p.m., discusses taking half off and adding it back hypothetically, and identifies a repeat sweep and inversion setup before another selloff. The public YouTube recording was published June 3, 2026 at 17 48 PDT, while the review notes that its charts, fills, drawdown, targets, order records and repeatability were not independently verified. ICT closes with a negative opinion on a Bitcoin daily setup while stating that he has never traded crypto and is not giving investment advice.
How we researched this article
BestProps used document-based research from primary firm sources, checked September 24, 2026. The complete source list, scope, limitations, and commercial-state record appear near the end of this article.
June 2026 ICT Futures Directional Flexibility
He opens on the Nasdaq daily chart with a mindset point rather than a setup (0:01). Markets go up and down, he says, so it is not enough to decide you are in a bull market and only look for buys (0:31, 0:38). His qualification matters more than the claim: he ties the licence to short a rising market to experience, control over emotions and not being trigger happy (0:46, 0:50). Read as a general rule, “you can fine shorts” is exactly the mistake the sentence is guarding against; read as his own discretionary practice, it describes the rest of the recording.
June 2026 ICT Futures Buy-Side Liquidity and Unused Gap
The technical part starts at the high and the gap above it (1:03). He picks one gap over another because it does two things at once: it formed as what the transcript renders as buy-side imbalance, sell-side inefficiency before the high was taken, and it never got its first use as an inversion fair value gap at that time (1:15, 1:22, 1:29). Because it was never utilised, he says it should work in inversion mode if price trades back below it (1:34, 1:45). He then notes that price fell short of it on the way in (1:52), that the high took out relative equal highs (1:59), and that on the way down there is nothing but a wick, so he prefers to use the gap rather than the wick (2:04). The other leg of the argument arrives immediately: Nasdaq made a higher high when ES was unwilling to do the same (2:10).
The transcript renders his opening term for that imbalance as “bicellabalance cell sign efficiency”. In context it is the phrase he uses elsewhere for buy-side imbalance and sell-side inefficiency, and this article normalises it on that basis rather than treating the audio as a clean quotation.
June 2026 ICT Futures Exit and Missed Run
He then shows his exit fill and exit prices (2:19) and adds a caveat that is easy to miss: the exit looks good, but he was not able to stay with the chart and work the first presentation of the setup, so he missed a much larger part of the move (2:37, 2:52). He says he would rather accept that than try to catch every part of a move that will repeat (2:58). That is a self-report about his own execution; no order record, statement or screen capture was inspected for this article.
June 2026 ICT Futures Entry and 11-Handle Drawdown
Walking forward, he points to a sell-side imbalance and buy-side inefficiency (3:16), says price ran above the high and then went back to the first utilisation of that area (3:22), and marks the consequent encroachment as the entry (3:28, 3:35). He pre-empts the obvious objection by stating his adverse movement: about 11 handles of drawdown before it sold off (3:40). Whether 11 handles is small depends entirely on the stop and position size behind it, neither of which the transcript records.
June 2026 ICT Futures First Presented Fair Value Gap
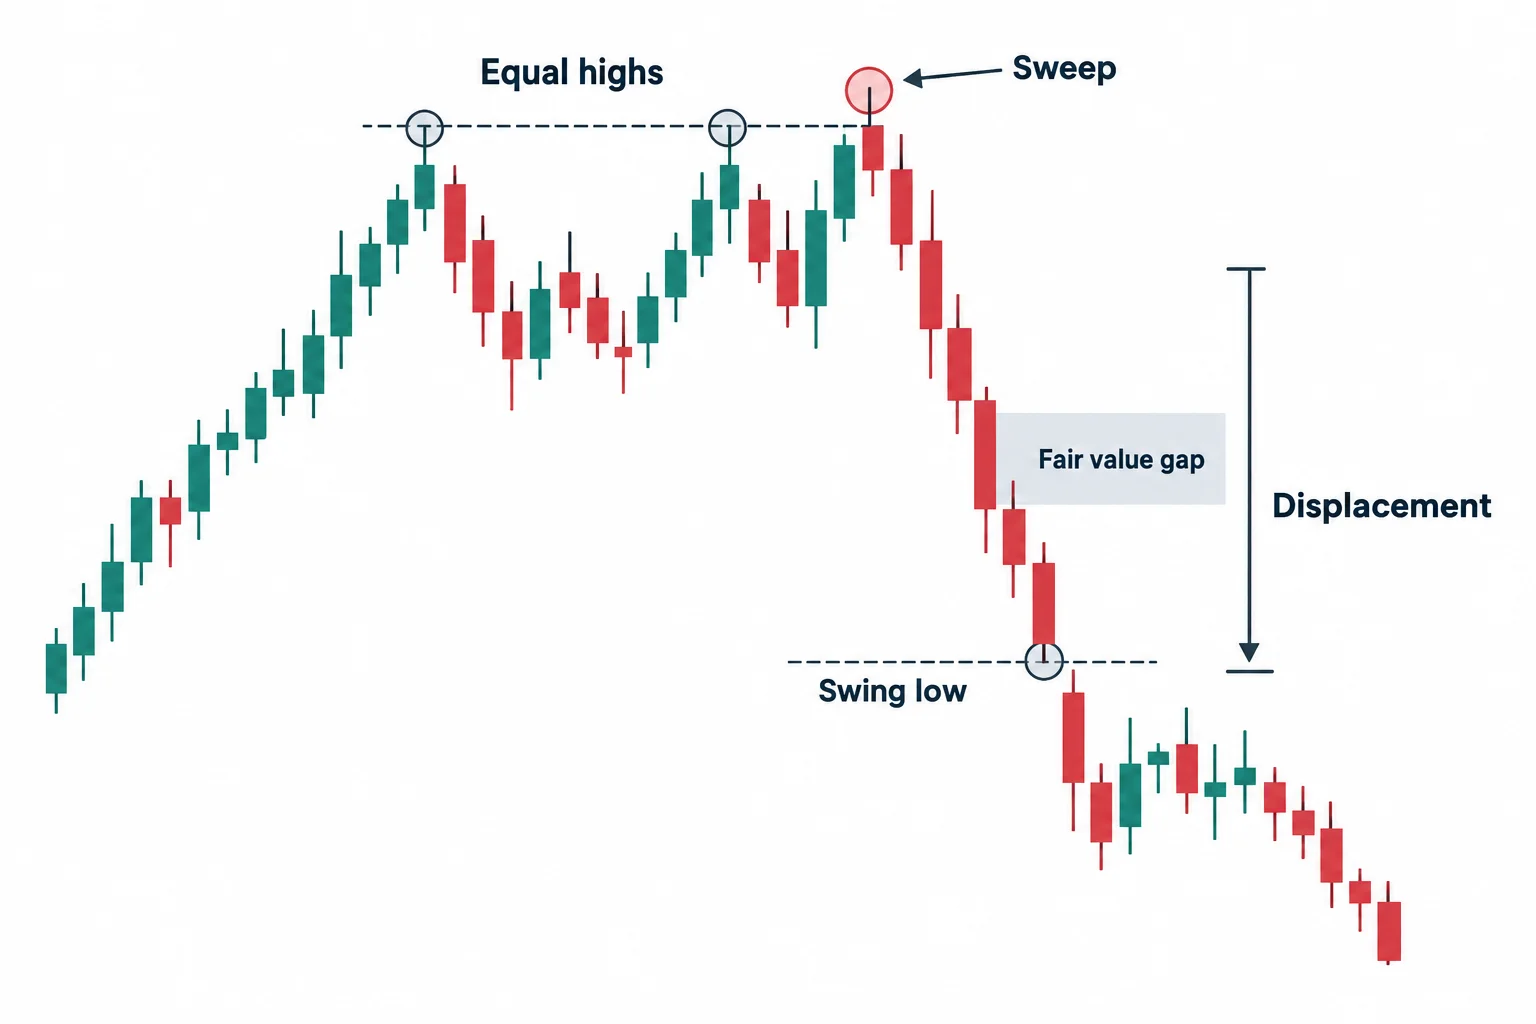
This is the teaching core of the clip. He calls a particular gap the first presented fair value gap and then answers his own question about why the other visible gaps do not qualify (3:59, 4:02). They are fair value gaps (he agrees), but the one he chose is attached to the swing low and the displacement that took out the buy side of those relative equal highs, which is what makes it the first presented gap within that context (4:09, 4:23, 4:33). He is explicit that this contextual judgement takes time to learn and cannot be rushed (4:40), and he criticises viewers who try to learn his material through other people's recaps instead of the recordings themselves (4:45, 5:00). That passage is also the reason this page cites the recording and not a summariser.
He then names the displacement: a sell-side imbalance and buy-side inefficiency that breaks through a swing low while the two indices diverge (5:10, 5:18, 5:26). His intended draw is the relative equal lows, and he marks a blue line as the June 1 Monday daily high (5:36, 5:44).
June 2026 ICT Futures Fill and Trade Management
He points to the line at “ 687 even” and says his fill sits just below it, at the consequent encroachment of the inversion fair value gap, inside a thesis that was looking for lower prices because of the SMT divergence and because price had traded above the old all-time high marked from that Monday (6:06, 6:15, 6:21, 6:27). He then describes what he would have done with screen time: take half off on the retrace, add the other half back, and hold for a deeper retracement (6:40, 6:46). That is a hypothetical management discussion, not a record of what was executed, and the contract counts in it are his illustration rather than verified position data.
June 2026 ICT Futures Lunch Macro and Judas Swing
He shifts to a later intraday sequence and identifies a low formed at the beginning of what the transcript renders as the 9:50–:10 macro, noting it has the longer wick of the two candidate lows (7:00, 7:08, 7:14). He says he would use that lunch macro low as a draw on liquidity (7:18) and describes the morning sequence he calls a Judas: the session runs up into the lunch macro and into the consequent encroachment of the first presented fair value gap, trades back above the June 1 daily high and taps it once more on the left side, then works lower (7:24, 7:33, 7:39). He removes the red line that was his short’s target (7:51), notes the failure to touch the June 1 high and calls it weakness (7:55), then says price worked down into the lunch macro low inside the first hour of that window (8:04, 8:17). He defines the lunch macro as 11:30 a.m. to 1:30 p.m., says a setup can form and deliver within its first hour, and suggests giving the trade until 12:30–:30 if it needs it (8:23, 8:35). All times in that paragraph are chart times he states on screen, not exchange documentation quoted here.
June 2026 ICT Futures Sweeps Wick and Liquidity Level
The repeat setup is shorter. Price works back up to the June 1 daily high after creating a minor buy-side liquidity pool, sweeps it, and breaks lower on the same premise (8:48, 8:54, 8:59). His reason for treating the next imbalance as an inversion fair value gap is stated with unusual bluntness: there is no fair value gap in that stretch other than this one, so it is the only candidate (9:06, 9:10), and when he asks why, his first answer is “because Michael said so” (9:13). Read plainly, that is a disclaimer: the classification in this recording rests on his judgement, not on a mechanical test that a reader can apply without interpretation.
He then describes the sell-off that followed: price rallies and fails to reach the consequent encroachment, fails to go higher than the previous wick, and dumps (9:19, 9:26), with consolidation into relative equal lows before a stated sell-side level at $30,496 is torn through (9:32, 9:37). The level is a speech-recognition rendering of what he reads off his chart; no price data was used to check it.
June 2026 ICT Futures NQ and ES SMT Divergence
The cross-market comparison becomes explicit near 11:03. ES had relative equal highs and its rallying high was lower than its 7:00 high, while the corresponding Nasdaq high was higher (11:10, 11:17). He labels that disagreement SMT divergence and defines SMT functionally as divergence between correlated markets, adding that he never settled on a final expansion of the acronym (11:47, 11:53, 12:04). He connects it to heavy distribution in the S&P while NQ lagged, and to the sell-off that followed. That link is his interpretation of charts he can see and readers cannot; the recording offers no count or sample of how often the pattern resolved the same way.
June 2026 ICT Futures Commentary on Bitcoin
The last minute turns to a Bitcoin daily chart, where he asks how viewers are doing, calls the setup bad, points to a first target and later ones, and jokes about a well-known holder (12:11, 12:27, 12:53). He states plainly that this is not investment advice, that it is his opinion, and that he has never traded crypto and never would (13:11, 13:16). His targets are opinions; the transcript cannot establish later price action.
June 2026 ICT Futures Observations Scenarios and Hindsight
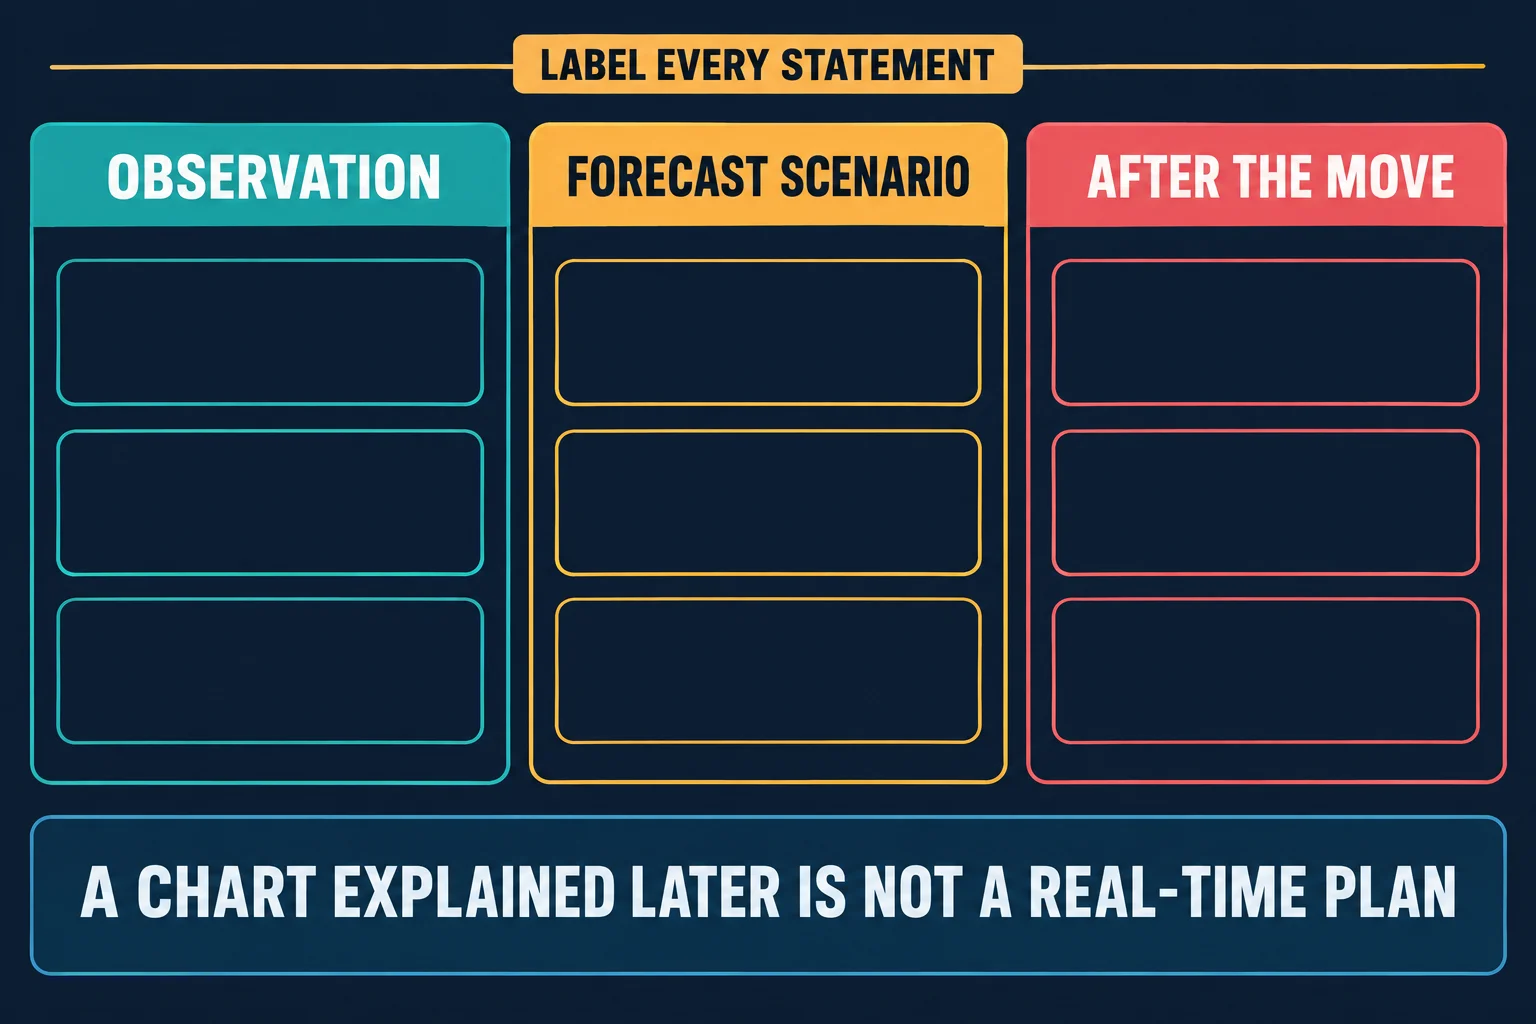
Because the clip runs after the move, it is worth sorting its statements into three kinds, and the schematic below is organised that way. Observations are things he can point at on the chart: the higher high above relative equal highs, the displacement through the swing low, the absent gap in the second sequence, the ES/NQ disagreement. Conditional scenarios are statements tied to a future condition, such as expecting the unused gap to operate in inversion mode if price traded back below it. Explanations offered after the move are the rest: the Judas framing of the morning rally, the lunch macro draw, and the reasons the sell-off continued. He flags the boundary himself at the end of the Nasdaq walk-through when he says “this is where we’re at at the time of this recording” (9:46). Keeping those three categories apart is the difference between studying a discretionary read and back-fitting a rule to a chart that already resolved.
June 2026 ICT Futures Dates and Trading Sessions
The title of the recording says June 03, 2026, and the watch page confirms publication at 17:48 PDT on 2026-06-03, which is 00:48 UTC on June 4. The calendar date and the publish timestamp are two different facts and are kept separate here (see the recording). Inside the clip the referenced dates are June 1, which he marks on the chart as the Monday high, and the current session he is reviewing. The session windows he names are the morning session, the lunch macro at 11:30 a.m. to 1:30 p.m., and an Asia reference he points to when showing the same pattern recurring overnight (10:20). The recording never speaks the calendar date of the session in words, so the title date is reported as the title’s, not as something the audio establishes.
June 2026 ICT Futures Review Questions
Is the June 3, 2026 NQ futures review available?
Yes. The mapped recording NQ Futures Review & Commentary | June 03, 2026 was read on 2026-09-14 from a live browser session: public, not private and not unlisted, credited to the channel The Inner Circle Trader, published 2026-06-03T17:48:27-07:00, runtime 13 minutes 30 seconds. Its own announcement post exists on X under the same channel and carries the same title, verified against the platform’s embed-endpoint record, a primary source, on 2026-09-14. An earlier version of this page described the recording as untranscribed and unverified; both statements are now false and were removed.
What is the first presented fair value gap?
In his usage here it is the first imbalance that appears in the sequence after buy-side liquidity is taken and price displaces through a swing low, not simply the first gap on the chart. He concedes that the other visible gaps are fair value gaps too, and says the difference is the surrounding context (4:09). The term is his own and is not defined in any external specification cited on this page.
Were the fill, drawdown and targets verified by any source?
No. The fill, the exit prices, the roughly 11 handles of drawdown, the partial-exit plan and the stated level all come from his narration over charts that are not part of the source. No order record, statement or screen recording was inspected, and the reported target being reached is not evidence that the approach reproduces.
Is this SMT definition the standard one?
He presents it as divergence between correlated markets and says he never settled on the acronym’s final expansion, so this page uses his functional description and does not attribute a formal definition to him or to anyone else (11:53).
June 2026 ICT NQ Futures Source Video
The recording reviewed above is NQ Futures Review & Commentary | June 03, 2026 on the channel The Inner Circle Trader. Its watch page was read on 2026-09-14 and reported an upload date of 2026-06-03 and a runtime of 13:30. Every attributed statement and every timestamp link on this page comes from the automatic speech-recognition transcript of that recording’s full audio.
Watch the original recording on YouTube
This recording cannot be played inside another website. A playback test of the embed markup used on this page, run on 2026-09-14 from a BestProps page origin, returned the player’s own message “Playback on other websites has been disabled by the video owner” and the embedded player never advanced past zero seconds. That is a setting on the video, not a fault of the reader’s browser, so no player area is reserved here and no blank embed is left behind. The recording itself remains public on YouTube.
Watch NQ Futures Review & Commentary | June 03, 2026 on YouTube ↗
June 2026 ICT Futures Sources and Risk Limits
Four references support this article: the recording itself, the database that defines time-zone history, the page that states what the Nasdaq-100 Index is, and this site’s RuleWatch page on drawdown rules. None of them states a price level, reports a result for any decision described above, or endorses this page.
Start With the Original ICT Recording
The mapped upload NQ Futures Review & Commentary | June 03, 2026 was read on 2026-09-14: public, credited to The Inner Circle Trader, published 2026-06-03, runtime 13:30, and its watch page reported that external playback is not permitted.[1] That settles attribution, date and playability. What it says is taken from its automatic transcript, which is the source of every timestamp link above; no chart shown in it was inspected.
Verify the ICT Recording Time Zone
The recording leans on session windows and a lunch macro, and any level taken from one window has to be dated before it can be compared with another. The reference for that is the time-zone database rather than a table copied from a blog: it “contains code and data that represent the history of local time for many representative locations worldwide” and “is updated periodically to reflect changes made by political bodies to time zone boundaries, UTC offsets, and daylight-saving rules”.[2] Nothing in the recording depends on a daylight-saving edge case, but the maintenance point is why this page states the session and the publish timestamp separately.
Check the NQ Futures Underlying Index
Nasdaq futures track an index, and the index owner defines it: Nasdaq describes the Nasdaq-100 Index® as “a globally recognized index of 100 of the most innovative large cap companies listed on the Nasdaq Stock Market®” and notes its “concentration on non-financial sectors”.[3] That is the instrument family the recording is discussing in shorthand, and it matters because a level quoted on an index chart and a level quoted on a futures contract are not the same object, especially across a rollover.
Check Your NQ Futures Account Limits
The drawdown he mentions is only meaningful against a specific account’s rules. This site’s RuleWatch page on drawdown opens with the reason: “Drawdown is the rule that decides how much room you really have”, and it explains that it “compares static, trailing, intraday, end-of-day, daily, and max loss rules across checked prop firm sources so you can spot the rows that can trip you up before you buy or size a trade”.[4] Read your own provider’s current wording and dashboard rather than any summary, including this one; nothing in the recording is a size, a limit or an instruction for your account.
One transparency note: an earlier version of this page linked two recaps at a third-party ICT archive. Both were removed. Neither was read first-hand for this article and neither is primary documentation; each restated the same video identifier and title. The only external affirmation kept here is the channel’s own announcement post, which was retrieved through the platform’s embed endpoint on 2026-09-14 and carries the same title as the recording.
On third-party ICT and smart-money indicators: any indicator, script or tool that claims to locate fair value gaps, inversion fair value gaps or SMT divergence on this article’s behalf is an unofficial third-party interpretation. No such tool is named, linked, tested or recommended here, no result is reported for one, and nothing here claims that any of them would have identified the gap he selected or the divergence he described.
BestProps is not affiliated with The Inner Circle Trader or with any charting provider, and no source listed here endorses this article, this site or any setup. First presented fair value gap, buy-side imbalance, sell-side inefficiency, inversion fair value gap, consequent encroachment, displacement, relative equal highs, relative equal lows, draw on liquidity, lunch macro, Judas swing, SMT divergence and distribution are used on this page only as descriptive study terms taken from the recording. Nothing here claims that any described pattern predicts price, that the reported fill or drawdown was profitable, or that the approach produces a reliable outcome on a live or funded account.
ICT Futures Sources
- [1] YouTube: NQ Futures Review & Commentary | June 03, 2026 – The Inner Circle Trader (source recording; watch page read and external playback tested 2026-09-14, automatic transcript used)
- [2] IANA: Time Zone Database (local-time history, periodic updates for boundary, offset and daylight-saving changes; quotes re-checked 2026-09-14)
- [3] Nasdaq: Nasdaq-100 Index (index definition and non-financial concentration; quotes re-checked 2026-09-14)
- [4] BestProps: Prop Firm Drawdown Rules by Calculation Method – RuleWatch (drawdown definitions and source checks; quotes re-checked 2026-09-14)