
Key takeaways
The Inner Circle Trader reviews the US Dollar Index, crude oil, E-mini S&P 500 futures and Nasdaq futures in a public YouTube recording published June 9, 2026 with a runtime of 24 minutes 36 seconds, centering the lesson on his inversion fair value gap rule that price must trade above the candidate area, leave no…
Read the full summary
The Inner Circle Trader reviews the US Dollar Index, crude oil, E-mini S&P 500 futures and Nasdaq futures in a public YouTube recording published June 9, 2026 with a runtime of 24 minutes 36 seconds, centering the lesson on his inversion fair value gap rule that price must trade above the candidate area, leave no candle body there and close back below it before the gap is validated. He cites a Nasdaq high of 29,848, low of 28,227.75 and morning range exceeding 1,600 handles, illustrates a volume imbalance with one candle closing at 905.0 and the next opening at 905.5, and says confirmation came when a wick crossed the midpoint while the body closed in the lower half of the inversion gap and outside a bearish gap, followed by immediate feedback from the next candle. He reports an unverified short filled about one tick below his level with minimal drawdown and a moved stop, says he does not trade prop accounts, and warns against trading while Nasdaq sits between two inversion fair value gaps. Other references include Dollar Index consequent encroachment near 99.676 and an objective near 100.58, crude sweeping the previous Friday low after reacting around an inversion gap, and ES breaking through an inversion gap after retracing higher. Levels must be tied to their specific new week opening gap, new day opening gap or regular trading hours opening range gap, while his risk message is to pack small and play big by keeping size and potential loss small, allowing winners room and avoiding reckless exposure during extreme volatility. The chart levels, range, fill, stop movement and execution were not independently verified and the geopolitical and volatility claims are presented as ICT opinion rather than recommendations or performance evidence.
How we researched this article
BestProps used document-based research from primary firm sources, checked September 24, 2026. The complete source list, scope, limitations, and commercial-state record appear near the end of this article.
What the ICT Futures Commentary Covers
He opens by saying he will run through all of the markets and that viewers who missed the weekend analysis will find some of it less timely (0:10). The four markets he actually reviews are the Dollar Index on a daily chart, crude oil, ES and Nasdaq, with a lower-timeframe pass on crude and several on Nasdaq. There is no new indicator, no settings list and no subscription pitch; the teaching value is concentrated in the Nasdaq section and in the final risk passage.
ICT Futures Commentary on the Dollar Index Low
On the daily chart he notes that the market opened and traded out into what the transcript renders as buy-side imbalance and sell-side inefficiency (0:26), then goes straight to the Fibonacci levels for the consequent encroachment, which he puts at a level the transcript renders as 99.676 (0:40). He then says the day’s low came in at “six seven nine” and so failed to touch that midpoint (0:47), reads the miss as “actually kind of bullish”, and says he wants to see whether the next day creates another higher low and starts running toward the buy side (0:54). He also identifies a cleaner objective he is only “cleaning up” for now, at a level the transcript renders as 100.58 (1:41). Those are spoken numbers read off a chart that is not part of the source; the digits near 99.68 are close enough that transcription may not have separated them reliably.
ICT Futures Commentary on Crude Oil Inversion
Crude is where he shows the inversion logic in its simplest form. He recalls saying the volume imbalance there would be used as an inversion fair value gap (1:54), says price traded up into the consequent encroachment on the Monday (2:00), and notes the first target he had given was the previous Friday’s low, which a continuation lower then swept (2:07). He then argues the market was highly manipulated, citing one side saying a deal was close and the other saying there were no discussions at all (2:21). That causal claim is his opinion about headlines; the recording offers no evidence for who moved price or why, and this article takes no position on it.
On the lower timeframes he points to gap levels he calls new week opening gaps, to the 29 May daily low being used as a launching level, and to a gap that was filled (3:19, 3:31). By roughly 3:49 he calls crude “no man’s land” between reference areas rather than presenting a fresh setup.
ICT Futures Commentary on ES Expansion
The ES section starts near 4:30. He says price had moved up into an area highlighted in his weekend analysis and then traded down into a lower-level imbalance he treats as an inversion fair value gap (5:02). He uses the section less as a lesson than as an example of range: he says he had told viewers that price was likely to trade back up before a new short would be considered, and that it did so on the Tuesday before slamming through that inversion fair value gap (5:55, 6:16).
He adds a caveat about his own social posts: he says that sometimes his comments on X do not appear on his account and that he only later discovers this, which is why he treats his YouTube recordings as the record (5:23). This article therefore relies on the recording rather than on any post attributed to him.
ICT Futures Commentary on Nasdaq Volatility
The Nasdaq daily chart opens at 7:45. He reports a session high of 29,848 and a low of 28,227 and three quarters, and describes that as an enormous daily range of more than 1,600 handles in the morning session alone (8:16, 8:43). Those figures are spoken while he looks at his own chart; they were not checked against exchange data or a price feed here, and no conclusion in this article depends on them. He also notes that price reached the low of an imbalance he had marked with a volume imbalance (8:54).
ICT Futures Rules for Inversion Gaps
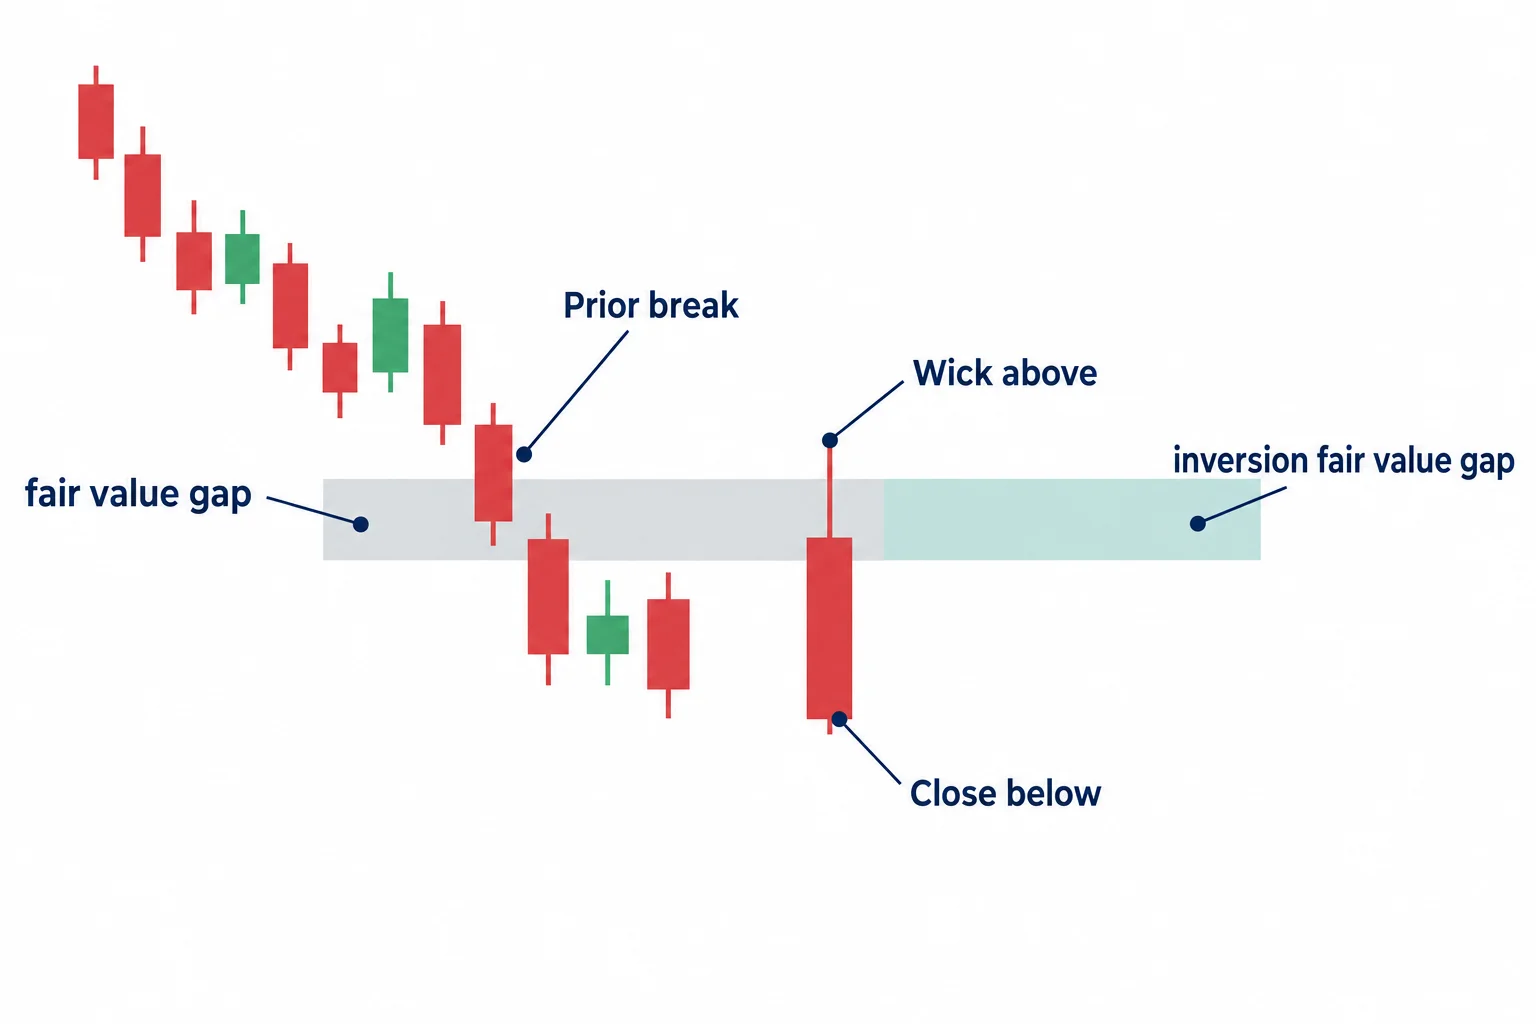
This is the teaching core of the recording, and it is checkable from the audio. On an hourly chart he identifies a volume imbalance by the same mechanical test he uses elsewhere: one candle closes at 905.0 and the next opens at 905.5, so the open is above the previous close (11:15, 11:29). He says price then traded down to the consequent encroachment and rallied (11:35), and that because price had already sliced through it he wanted to see whether it would act inversely, on the lower quadrant of that area (12:01).
The qualification rule he states is explicit: the area trades above, fails to leave a body up there, and closes down below it, and that close is what validates it as an inversion fair value gap (12:55, 13:00). He adds that anyone who labels an inversion fair value gap without that condition is guessing, and that if you are not good at forecasting price you may see a fair value gap that never behaves inversely (13:03, 13:14). He frames this as removing ambiguity rather than adding a rule, and says the context for going there has to exist (13:28).
He then criticises live streamers he says were excitedly calling the indices bullish that day, treating emotional adjective-heavy commentary as a signal in itself (13:30, 13:46). That is a comment about other people’s broadcasts, not a market claim, and no streamer or channel is identified here.
ICT Futures Gaps and Confirmation Closes
Later he describes two nested fair value gaps inside what the transcript renders as a breaker, and says this setup is the mirror image of one he had used a few days earlier (17:08, 17:24). He allows for some slack in the level because of the volatility he had warned about, and says he annotated that concession while the trade was open (17:49, 18:04).
The confirmation passage is the most precise sequence in the recording. He asks whether price gave confirmation and answers it himself: there was a wick up to and slightly through the midpoint, while the candle body closed inside the lower half of the inversion fair value gap and outside the bearish gap, and he says that distinction, wick versus body, is the important piece of information (18:46, 19:04). He adds that the next candle should give immediate feedback about whether you are on the right side, and says in his example it did (19:17).
ICT Futures Execution and Unverified Claims
He describes a short taken around that sequence, with a fill about one tick below his level, minimal drawdown in his words “about a happy meal’s worth”, a stop he then moved, and the same account used for an earlier trade on the Monday (14:04, 14:37, 16:16). He says he does not trade prop accounts (16:24), and that he recorded the execution, the trade management and the stop move and posted it on X with music, while noting he is not monetised there (15:43, 16:00). No such video, fill, statement or account was inspected for this article: the execution is a report, not a verified result, and the article makes no claim about its profitability.
ICT Futures Price Levels to Avoid
He says he widened his objectives during the session, referencing the regular trading hours opening range gap and its consequent encroachment (19:30, 19:42). He then says price drew down into the other inversion fair value gap he had given at the weekend but failed to touch its low, leaving Nasdaq between two inversion fair value gaps (20:05, 20:09), and closes the section with the instruction not to touch that area at all (20:15).
ICT Futures Risk With Small Positions
He says he is done for the week, expects whatever comes next to be educational rather than a full review, and anticipates more of the same volatility through the summer, “don't go out there and get reckless with your accounts” (20:23, 20:41). The phrase he uses for the sizing argument is a magician's expression: pack small and play big, which he translates into keeping risk small, being content to let trades run, and exercising patience precisely because very little is lost if the idea turns against you (21:00, 21:22, 21:49). His stated reason is that at this level of volatility, emphasising the maximum possible profit means ignoring the maximum risk being assumed (21:57).
He also says he blocks viewers who blame him for their trades, and repeats that market conditions can hurt the unprepared badly enough that returning to the market takes a long time (22:13, 22:42). His claims that current volatility has never been seen before and will only grow are forecasts, not measurements; the 1,600-handle day he cites is his own figure (23:52).
June 2026 Futures Sessions and Gaps
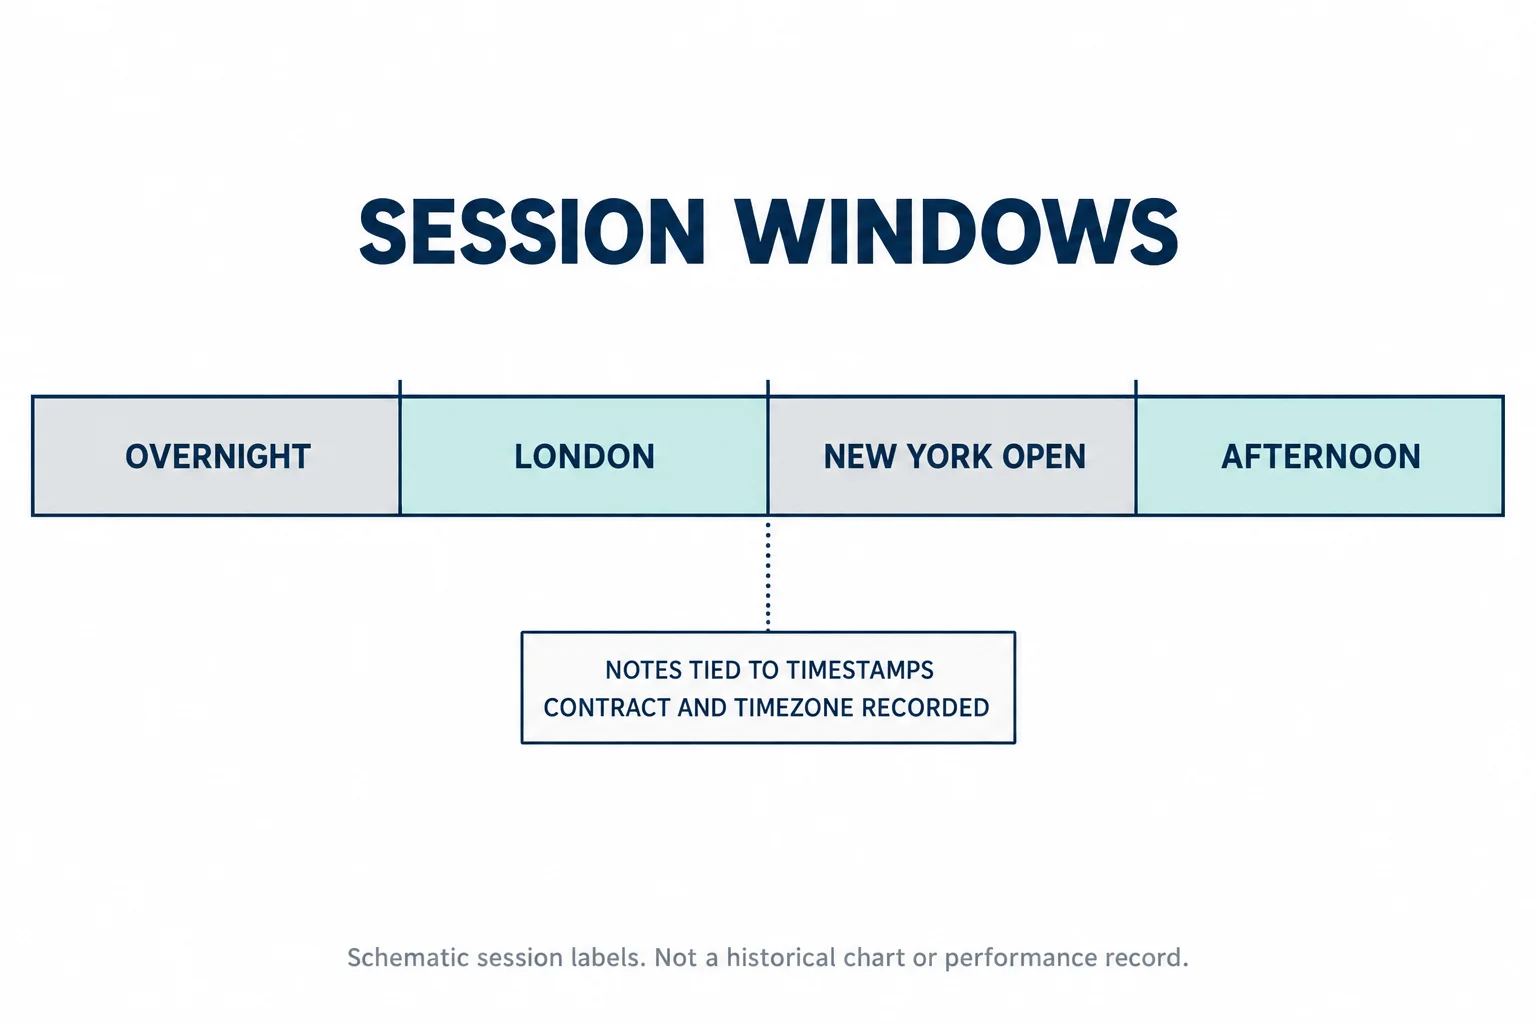
Three time-related details matter if you want to reuse anything here. First, the gaps he names belong to specific windows: a new week opening gap, a new day opening gap he calls “suspect”, and the regular trading hours opening range gap, so a level quoted from one window is not interchangeable with another (9:10, 3:19, 15:22). Second, he records in the evening and reviews the day that has already traded, including the morning New York session, so a level from this recap has to be dated, not just priced. Third, the title says June 09, 2026 and the watch page confirms publication at 17:08 PDT on that date, which is 00:08 UTC on June 10. Both are stated separately here rather than collapsed into one date, and the recording itself never speaks a calendar date.
How the ICT Futures Recording Was Checked
The checks are the same ones worth applying to any dated commentary before its contents are treated as fact, and they were run here on 2026-09-14. The canonical source is the recording itself, read from its own watch page rather than from a reupload or a summary.[1] The publication date is the one YouTube reports, not the date in the title alone. The markets and instruments are the four he actually names, without adding contracts he did not discuss. The session and timezone are recorded alongside each level quoted above. And every attributed statement carries a timestamp link into the transcript so a reader can go to the moment it was said.
ICT Futures Commentary Questions
Is the June 9, 2026 futures commentary available?
Yes. The mapped recording Futures Commentary | June 09, 2026 was read on 2026-09-14 from a live browser session: public, not private and not unlisted, credited to the channel The Inner Circle Trader, published 2026-06-09T17:08:47-07:00, runtime 24 minutes 36 seconds. An earlier version of this page treated the date as unverified; the recording is public and its full audio has a validated transcript.
What is an inversion fair value gap?
An imbalance that price has already traded through and that he then expects to be respected from the other side. In this recording he does not call it one until price trades above the area, fails to leave a candle body there, and closes back below it. The close is what he treats as validation (13:00). The definition is his; it is not a standardised term with an external specification, and no third-party definition is imported into this page.
Were the fill, stop move and profits verified by any source?
No. The recording describes a fill about one tick below his level, minimal drawdown, a moved stop and the same account as an earlier trade, and says a recording of the execution was posted to X. No order record, broker statement or such video was inspected for this article, so all of it stays a report. The only figures checked here are external facts such as the publication date and runtime.
Does ICT trade a prop account?
He says in the recording that he does not trade prop accounts (16:24). That is his own statement, made while describing his execution; nothing in this source verifies or refutes it, and it has no bearing on whether any described setup would work inside a funded account’s rules.
June 2026 ICT Futures Commentary Video
The recording reviewed above is Futures Commentary | June 09, 2026 on the channel The Inner Circle Trader. Its watch page was read on 2026-09-14 and reported an upload date of 2026-06-09 and a runtime of 24:36. Every attributed statement and every timestamp link on this page comes from the automatic speech-recognition transcript of that recording’s full audio.
Watch the original recording on YouTube
This recording cannot be played inside another website. A playback test of the embed markup used on this page, run on 2026-09-14 from a BestProps page origin, returned the player’s own message “Playback on other websites has been disabled by the video owner” and the embedded player never advanced past zero seconds. That is a setting on the video, not a fault of the reader’s browser, so no player area is reserved here and no blank embed is left behind. The recording itself remains public on YouTube.
ICT Futures Sources and Risk Limits
Four references support this article: the recording itself, YouTube’s own documentation on embedding, the Federal Reserve’s published FOMC calendar, and this site’s RuleWatch page on drawdown rules. None of them states a price level, reports a result for any decision described above, or endorses this page.
Start With the Original ICT Recording
The mapped upload Futures Commentary | June 09, 2026 was read on 2026-09-14: public, credited to The Inner Circle Trader, published 2026-06-09, runtime 24:36, and its watch page reported that external playback is not permitted.[1] That settles attribution, date and playability. What the recording says is taken from its automatic transcript, which is the source of every timestamp link above; no chart shown in it was inspected.
Why the Futures Video Uses a Card
Whether a video plays inside a third-party site is decided on YouTube's side, not by the site embedding it. YouTube documents that embedding is the supported way to place a video on a website or blog (“You can add a YouTube video or playlist to a website or blog by embedding it”), and it also documents that third-party playback can be restricted, for example that “Age-restricted videos can't be watched on most 3rd party websites” and will “redirect viewers back to YouTube when played”.[2] The restriction here was not inferred: the embed was loaded from a BestProps page origin and the player returned its own refusal message.
Check June Events With the Calendar Owner
This commentary attributes a large range day to headline flow rather than to a scheduled release, and it never mentions the Federal Reserve. If you are dating a session or testing a claim about scheduled events, the primary calendar is the one the publisher maintains: the Federal Reserve states that “The FOMC holds eight regularly scheduled meetings during the year” and publishes the dated 2026 meeting list, which is the version to check against rather than a summary.[3] The recording makes no FOMC-related claim, and nothing here asserts that any release or meeting caused the move he described.
Use Your Own Futures Risk Limits
His sizing argument only becomes concrete against an account’s own rules. This site’s RuleWatch page on drawdown opens with the reason: “Drawdown is the rule that decides how much room you really have”, and it explains that it “compares static, trailing, intraday, end-of-day, daily, and max loss rules across checked prop firm sources so you can spot the rows that can trip you up before you buy or size a trade”.[4] Read your own provider’s current wording and dashboard rather than any summary, including this one; nothing in the recording is a size, a limit or an instruction for your account.
One transparency note: an earlier version of this page linked an X post attributed to the channel. That post was retrieved through the platform’s own embed endpoint on 2026-09-14 and its text announces a “Futures Market Commentary | June 18, 2026” dated 18 June 2026, so it does not document this 9 June recording. The link and the source-denial wording around it were removed; the recording itself, which he says is his own record of what he gave viewers, is the source used above.
On third-party ICT and smart-money indicators: any indicator, script or tool that claims to locate inversion fair value gaps, volume imbalances or consequent encroachment on this article’s behalf is an unofficial third-party interpretation. No such tool is named, linked, tested or recommended here, no result is reported for one, and nothing here claims that any of them would have detected the levels he describes.
BestProps is not affiliated with The Inner Circle Trader or with any charting provider, and no source listed here endorses this article, this site or any setup. Inversion fair value gap, volume imbalance, consequent encroachment, opening range gap, new week opening gap, breaker, buy-side imbalance, sell-side inefficiency and liquidity are used on this page only as descriptive study terms taken from the recording. Nothing here claims that any described pattern predicts price, that the reported fill or management was profitable, or that the approach produces a reliable outcome on a live or funded account.
ICT Futures Commentary Sources
- [1] YouTube: Futures Commentary | June 09, 2026 – The Inner Circle Trader (source recording; watch page read and external playback tested 2026-09-14, automatic transcript used)
- [2] YouTube Help: Embed videos & playlists (embedding as the supported route, third-party playback restrictions; quotes re-checked 2026-09-14)
- [3] Federal Reserve: FOMC Meeting Calendars (eight regularly scheduled meetings a year and the dated 2026 list; quote re-checked 2026-09-14)
- [4] BestProps: Prop Firm Drawdown Rules by Calculation Method – RuleWatch (drawdown definitions and source checks; quotes re-checked 2026-09-14)