
Key takeaways
In the September 18, 2025 session “Trading Premarket and Regular Session Liquidity,” ICT walks through that day’s Nasdaq price action, starting from the daily chart and moving to a one-minute intraday view.
Read the full summary
In the September 18, 2025 session “Trading Premarket and Regular Session Liquidity,” ICT walks through that day’s Nasdaq price action, starting from the daily chart and moving to a one-minute intraday view. He marks the 7:00 a.m. premarket open, treats relatively equal premarket highs as a buy-side reference, and describes a rally ahead of the 8:30 a.m. news window as a sweep of those highs that failed to hold. He then reports shorting into a reclaimed bearish fair value gap and aiming for the premarket session sell-side pool, saying he deliberately kept the objective close because the idea ran against his bullish daily reading. He later reviews the regular session, the 10:00 a.m. “lunch macro” rule for finding the first prominent sell-side reference, and shorter looks at the U.S. Dollar Index and EUR/USD. The recording is a retrospective explanation of his own framework and a reported trade, not independently verified performance.
How we researched this article
BestProps used document-based research from primary firm sources, checked September 24, 2026. The complete source list, scope, limitations, and commercial-state record appear near the end of this article.
In Trading Premarket and Regular Session Liquidity, published September 18, 2025 by The Inner Circle Trader, ICT reviews that day’s Nasdaq price action alongside a daily chart. His central lesson is that liquidity formed before the regular session can remain relevant after the 9:30 a.m. open, but it should be interpreted within the higher-time-frame context.
The presentation is a retrospective explanation of ICT’s own framework, not independent evidence that the labels predict price. This article is grounded in an automated speech-to-text transcription of the full recording, not in human-verified captions; the precise chart markings, entries, fills and prices shown on screen were not independently inspected. Where a figure is quoted below it comes from the transcription of the speaker’s own words and is labelled as such.
Start with the daily context
ICT begins by discussing how he grades prominent daily candle wicks when the Nasdaq is trading at or near all-time highs. At 0:48, he says traders following his method should look back through the nearby run and mark relevant “premium” and “discount” wicks rather than stopping at the most recent candle. He describes the practice as cutting through intervening candles to reach the wick that matters.
He divides a selected wick into quadrant levels, emphasizing the 25%, 50% and 75% measurements. His stated reason for displaying only selected levels is practical: a cleaner chart makes it easier to focus on the reference points he considers salient. He also names two levels for the day at 3:55 and 4:20 — a dashed line transcribed as 24,647.25 and the upper quadrant of a wick transcribed as 24,619, the level he says will matter later in the session. Both figures come from speech recognition and were not verified against the chart.
ICT also urges viewers to annotate charts and keep written observations instead of watching passively, around 2:31. That recommendation does not depend on his terminology.
Mapping premarket liquidity
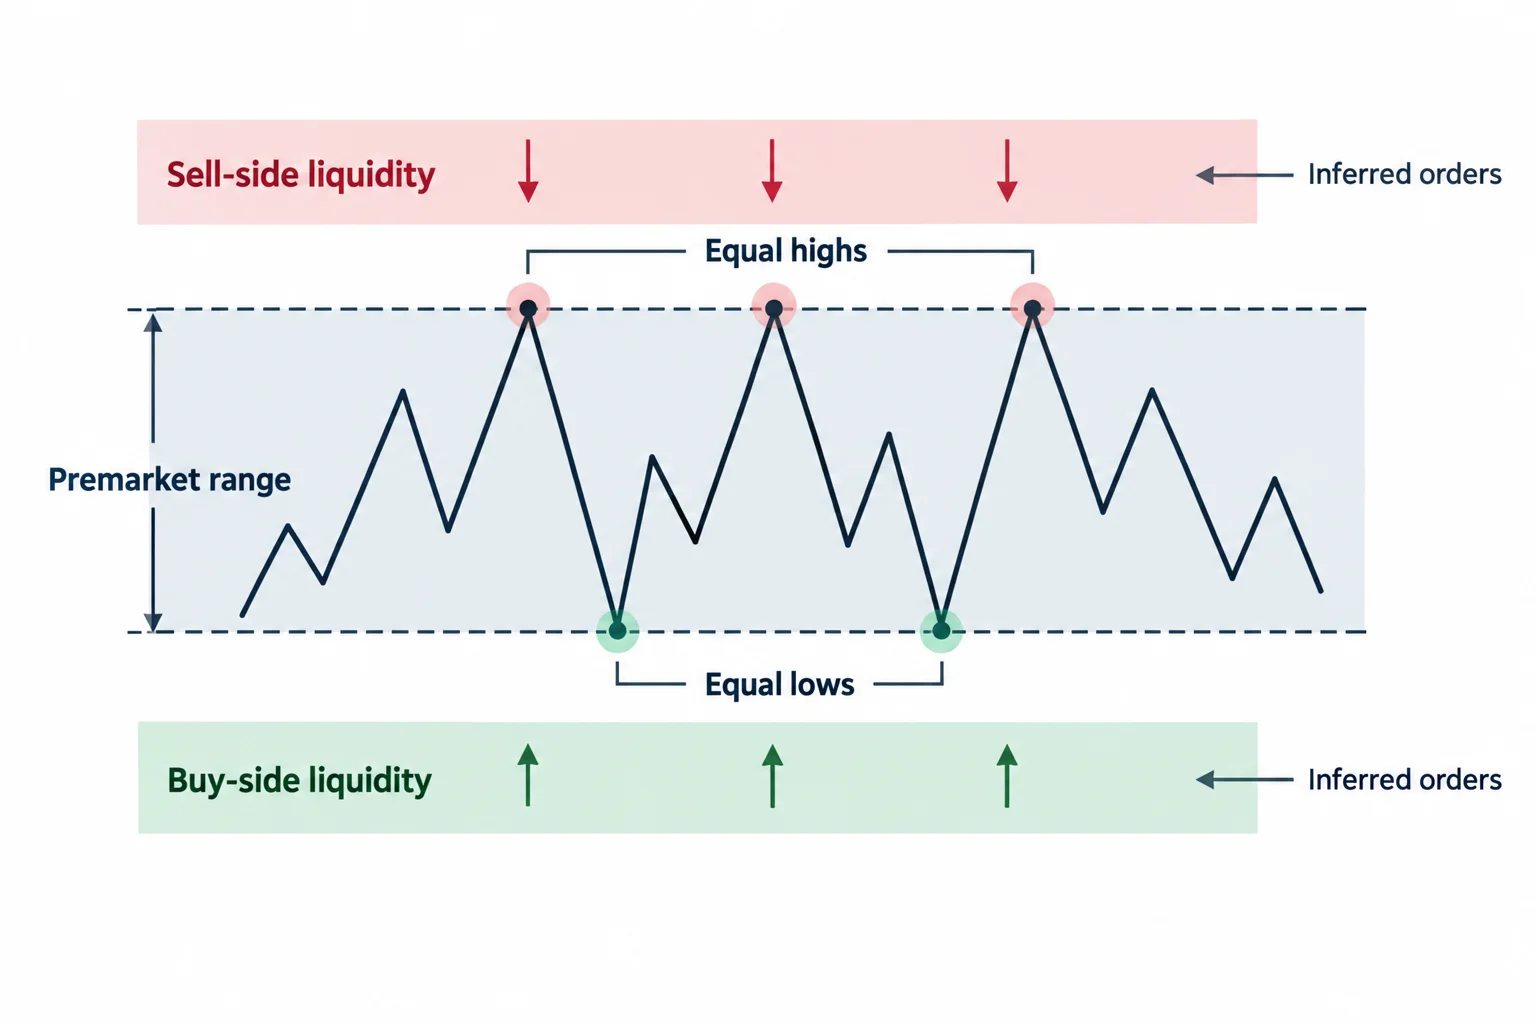
At 4:48, ICT marks 7:00 a.m. as the start of the premarket window used in this lesson. He points to relatively equal highs as a pool of buy-side liquidity and later treats lows formed in the same window as premarket sell-side liquidity.
In ICT’s vocabulary, buy-side liquidity generally refers to orders presumed to rest above visible highs, while sell-side liquidity refers to orders presumed to rest below visible lows. These are interpretive labels; the transcript provides no order-book evidence showing the identity or intent of market participants.
His reasoning for that day leaned on the calendar. At 5:24, he says a strongly bullish week tends either to form its high on a Thursday or to print a false high before price runs back and clears it — which is what he says happened. He then describes the run above those equal highs as retail traders being trapped offside, with the move used to gather stops before price was delivered lower.
His narrative for the session is:
- Price consolidated near premarket highs.
- A rally ahead of the 8:30 a.m. news window moved above short-term highs.
- Price then broke lower and reached a minor low followed by the more prominent premarket sell-side level.
- The larger daily context remained bullish, so ICT says he treated the decline as a counter-directional move with a nearby objective.
The sequence is summarized most clearly from 7:41. ICT places particular emphasis at 9:09 on combining time, price and liquidity rather than interpreting an equal high or low in isolation.
The 8:30 news window and the move lower
At 6:33, ICT explains that the 8:30 a.m. release window was part of his reasoning: volatility arriving at a scheduled time, in his reading, is when positioning is accumulated before distribution. He says he wanted to see price run above the earlier high before considering a short, and that being wrong there — stopped out by a further run higher — was an acceptable outcome given what the context suggested.
The delivery he describes runs from 8:39 onward: price consolidated, then gave way, traded through a first minor sell-side pool and continued to the premarket session sell-side pool he had identified in advance. He also flags a smaller pool nearby that he says he ignored because it sat too close to the main one.
The reclaimed bearish fair value gap and the reported short
At 9:20, ICT returns to an imbalance he had highlighted earlier and describes it as a reclaimed bearish fair value gap rather than an inversion fair value gap: in his words, it resumed its original character once price traded back below it. He says the consolidation into that area, and a smaller imbalance inside it, is where he reported entering short — adding to the position inside the reclaimed gap, with a limit order filled as price broke lower (10:44). He also says an earlier recording of that trade — which he calls an “Enigma” trade, entered and managed while he was making breakfast — was shared on X and uploaded to YouTube (2:52). This article reports what he says about that trade; it does not verify the entry, the size, the fill or the outcome.
Several ICT-specific concepts appear in this section:
- Fair value gap: a three-candle price imbalance in ICT’s framework.
- Reclaimed bearish fair value gap: a bearish imbalance that, in his interpretation, resumes its original resistance-like role after price trades back below it.
- Inversion fair value gap: an imbalance treated as changing its directional role after price passes through it.
- Premium and discount: relative positions within a measured range, commonly divided around its midpoint.
These definitions explain how the speaker uses the terms in this video; they should not be read as validated market mechanisms.
Why he describes the short as limited in scope
Around 10:56, ICT explains why he says he did not hold the described short for deeper daily targets. In his interpretation, the trade went against the grain of a bullish daily chart, so he selected the premarket sell-side pool as a nearer objective and characterized that decision as being “nimble.” He adds that he was not expecting price to reach the prior day’s high or the upper quadrant of a daily wick (11:24).
The distinction matters: a short-term bearish expectation does not necessarily imply a bearish daily outlook.
What changed after the 9:30 open?
ICT turns to regular-session behavior at 12:08. He describes price first dropping below nearby equal lows — a move he calls a fake-out — then driving up into what he calls an inversion fair value gap, which in his telling trapped breakout buyers before price returned to the sell-side liquidity and a daily wick reference. He identifies the objective of that move as the upper quadrant of the daily premium wick, the level transcribed as $24,619 (12:51), followed by a rejection away from it.
His warning here is not to assume that an early decline at elevated prices must mark the final top. At 13:05, he calls the pattern a classic bait and switch and repeats the advice from earlier in the week: at or near all-time highs, avoid trying to pick the top. He then tracks the recovery back through the old daily high and up into the lower quadrant of an inverted imbalance that he says acted as the opening-range high before price dropped into his stated objective (13:40).
The lunch-macro example
Beginning at 15:35, ICT introduces what he calls the “lunch macro.” For a bullish session, he looks forward from 10:00 a.m. for the first prominent swing low and treats it as a potential sell-side draw as the market approaches 11:30 a.m. In the sequence he reviews, price first cleared buy-side liquidity and then retraced toward that post-10:00 a.m. low, tapping an imbalance he had projected forward (16:33).
He then classifies the lower-time-frame movement as a fractal version of his “market maker sell model” — a sequence he lists as low, accumulation, reaccumulation, smart-money reversal, sell, distribution and redistribution, ending in a faster run toward orders presumed to rest below a low (17:35). After that move, he says the area lost his interest for the rest of the day.
The dollar index and EUR/USD portions
The recording ends with shorter reviews of the U.S. Dollar Index and EUR/USD. On the dollar index, from 18:09, ICT says the market needed to trade higher and then use an inversion fair value gap. He describes price rallying to the consequent encroachment of a range and then dropping to the lower quadrant, accumulating with candle bodies on that level, with the range measured between two volume imbalances. He counsels measuring the daily dollar index with the 25%, 50% and 75% levels (19:06) and notes a swing projection he describes as “kind of cute” rather than a forecast (19:32).
On EUR/USD, from 20:08, he refers back to a run into weekly relative equal highs and marks a gap with gradient levels — lower quadrant, consequent encroachment and upper quadrant. He says a premium wick he measured on that chart was included for later reference rather than as a current signal. He then describes a 2:00 a.m. run that created a sell-side liquidity pool, a purge of buy-side liquidity above the high, and what he calls a “Venom” setup before price sold off into an inversion fair value gap (21:04). He closes with an imbalance that broke lower after a consolidation and what he calls an institutional order-flow entry drill — a gap with a single small candle above it that never reached its halfway point (21:47).
What the speaker says the framework is not
At 19:45, ICT states plainly that the levels he marks are not pivots and that nothing in his presentation is Wyckoff, supply-and-demand analysis or Elliott Wave. He describes the exercise as locating inefficiencies and measuring them. That claim is his own characterization of his method; it is a useful reminder that the labels and the measurements are one practitioner’s framework rather than an established mechanism.
Sweep versus acceptance, and a general study discipline
Set beside the terms above, this session illustrates a general distinction that does not depend on ICT’s vocabulary. A reference level can be swept — traded through and then reclaimed — or it can be accepted, with price continuing in the direction of the break. In the recording, the premarket highs are traded above and then given back, while the premarket sell-side pool is reached and treated as the objective of a continued move lower; the speaker presents both as deliberate delivery, which is his interpretation rather than a demonstrated cause.
For study purposes, the following discipline is general risk practice rather than a claim made in the recording:
- The daily directional assumption and the wick used for quadrant measurements.
- Premarket relative highs and lows, and the regular-session open.
- The 8:30 a.m. event window as a time reference, not a signal in itself.
- Which reference price reaches first, and whether it is reclaimed or accepted.
- Whether a move is aligned with or opposed to the higher-time-frame context.
- An invalidation point written down before entry, plus displacement, a structure break and a failed reclaim as evidence requirements.
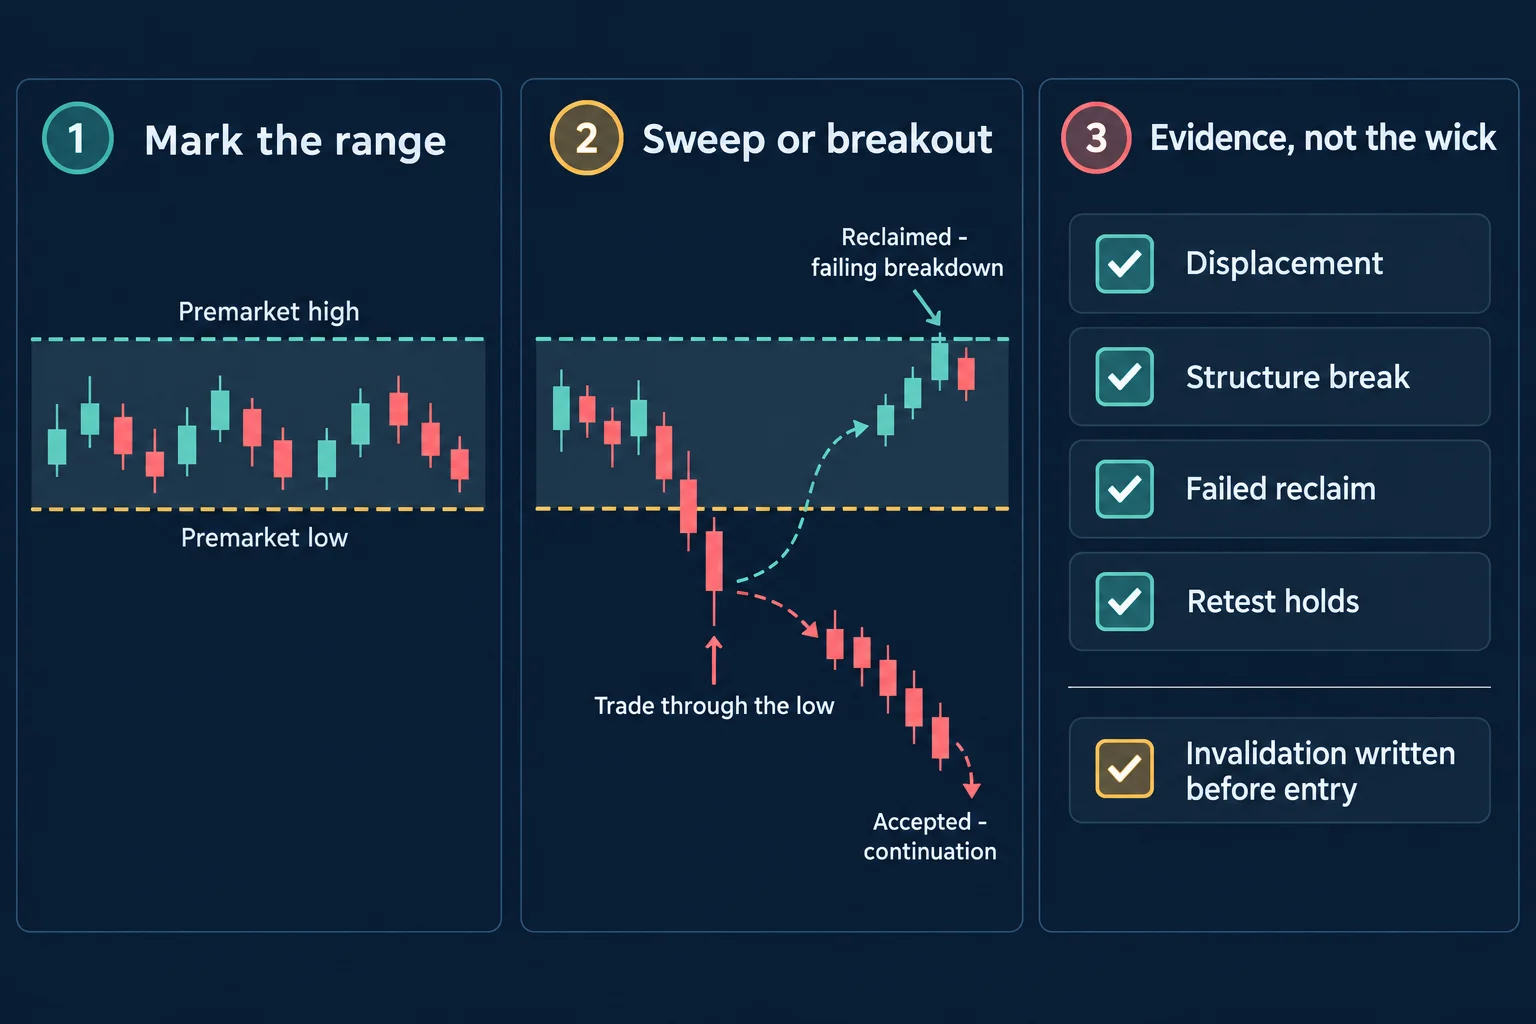
This separates observable sequence from ICT’s interpretation. It also makes the lesson testable in personal chart study without assuming that terms such as “smart money,” “manipulation” or “algorithmic delivery” identify proven causes.
Watch the original recording
This article draws on an automated transcription of the full recording. The transcript is the source for the speaker’s words and for the timestamps used above; it is not independent proof that the chart markings appeared as described. The recording’s visuals remain the primary reference when following the annotations.
Watch the original recording on YouTube
This video cannot be played inside another website: when its embedded player was opened from a BestProps page and clicked on 14 September 2026, the player itself reported “Playback on other websites has been disabled by the video owner.” and settled on a “Watch on YouTube” prompt, with no duration and no playback progress reported. That message is why no player is reserved or left blank here; the recording is available directly on YouTube.
Watch Trading Premarket and Regular Session Liquidity on YouTube ↗
Primary source and further reading
- Trading Premarket and Regular Session Liquidity (The Inner Circle Trader) — the primary source for this article; every timestamp link above points into this recording.
- NYSE market hours and calendars — the exchange’s own statement of regular and extended hours, which underpin the session windows referenced here.
- SEC investor bulletin on extended-hours trading — official context on how premarket and after-hours sessions differ from regular trading, including liquidity and pricing conditions.
- FINRA Rule 2265 — the disclosure rule for extended-hours trading that brokers apply to premarket and after-hours orders.
Editor’s note: this page reviews one speaker’s stated framework and a trade he reports having taken. It is not a verified trade record, and it is not investment advice or a promise of trading performance. Quoted levels and terminology come from the recording and its automated transcription; the charts were not independently inspected.
