
Key takeaways
YouTube at www.youtube.com hosts The Inner Circle Trader’s 34 minutes 51 seconds Nasdaq futures lesson, which defines a first presented fair value gap as the imbalance tied to a liquidity sweep, forceful displacement and market structure break, not necessarily the earliest visible gap.
Read the full summary
YouTube at www.youtube.com hosts The Inner Circle Trader’s 34 minutes 51 seconds Nasdaq futures lesson, which defines a first presented fair value gap as the imbalance tied to a liquidity sweep, forceful displacement and market structure break, not necessarily the earliest visible gap. The 30 minute opening ranges are London from one thirty a.m. to two a.m. Eastern, US equities from nine thirty a.m. to ten a.m., and New York from seven a.m. to seven thirty a.m. with six thirty a.m. activity as context. In a bearish sequence, price takes buy-side liquidity, displaces lower through a swing low, and makes the associated FVG the reference, with its midpoint or consequent encroachment watched for rejection. An earlier gap is ignored if it is not tethered to the structural break. Silver Bullet is treated separately as the first gap after ten a.m. within the ten a.m. to eleven a.m. hour. A crossed imbalance can become an inversion fair value gap, with the bearish midpoint expected to cap candle bodies even if a wick passes through. The presenter claims this inversion occurs 90% of the time when buy-side liquidity has been taken and the gap starts the 30 minute range, but provides no dataset or test method. TradingView’s protected-source ICT Opening Range Gap plus 1st Presented FVG indicator is unofficial and cannot confirm the lecture’s arithmetic or expectancy. The framework is a descriptive filter rather than a buy or sell signal, and traders should predefine the session window, liquidity references, three-candle FVG rule, displacement threshold, structural break and invalidation, then test losses and ambiguous cases before using it in a funded account.
How we researched this article
BestProps used document-based research from primary firm sources, checked September 25, 2026. The complete source list, scope, limitations, and commercial-state record appear near the end of this article.
In ICT Opening Range Theory \ 1st Presented FVG Logic, the presenter explains how he selects a fair value gap inside a 30-minute opening range. His central point is that “first presented” does not necessarily mean the first visible gap in chronological order. In his framework the relevant gap has to be attached to displacement, to a liquidity event and to a shift in market structure.
He opens by describing the recording as a December-contract mini Nasdaq futures review for November 11th at 1:19, and says he is limiting the session to the Nasdaq at 1:01. Everything attributed below is his stated interpretation as delivered in the lesson. The source used here is an automatic transcript of the complete audio track, so the charts themselves are not inspected on this page and no exact entry, exit or account result is reconstructed from them.
Important: A first-presented FVG is not inherently a buy or sell signal. It is a chart reference whose meaning depends on timing, liquidity, displacement and what price does afterwards.
ICT Opening Range Theory in Higher Time Frames
From about 1:40, he walks through a weekly chart, pointing to a volume imbalance, bullish fair value gaps and a large down-closing candle that he labels a bullish order block. He then describes price dropping into a discounted area before returning up into the highlighted imbalance.
At 3:46 he calls the exercise a study of the “price continuum”, working from higher-time-frame reference points down to lower-time-frame behaviour. Rather than treating every old support or resistance level the same way, he says he measures what he calls premium and discount sensitivity: how deeply price enters a designated area, and how quickly it leaves. In his words, it is not enough to say a level is “old support” or “old resistance”.
He then gives two daily reference levels aloud as his own approximations, around 7:11 and 7:30. They are spoken figures offered as a rough guide during a live review rather than settled levels, and the automatic transcript can misrender digits, so treat them as approximate and verify them against the recording if you use them at all.
For the rest of that week he says he would read price’s position inside the highlighted daily and weekly volume imbalance as a conditional bias: holding and defending the upper half would support his bullish reading, while breaking to the low and defending the lower half would support a bearish one (5:48). These are his interpretations for that session, not tested rules, and the discussion is framed as re-acclimatising to the market after time away.
ICT 30 Minute Opening Range Windows
The session-specific teaching begins near 8:39. He presents this style of analysis as using the time-and-price information available during the session instead of depending entirely on a daily or weekly bias. The windows he states are:
- London: 1:30 a.m. to 2:00 a.m. Eastern Time, stated at 10:12. He notes that relative equal highs had formed just before 1:30 (10:26).
- US equity-index range: 9:30 a.m. to 10:00 a.m., described at 16:48.
- New York open range: 7:00 a.m. to 7:30 a.m., with the 6:30 a.m. activity used as context, explained at 20:56 and 19:48. He says he uses 7:00 rather than 6:30 because it covers forex, metals, energies and indices in one treatment.
He stresses that these ranges are 30 minutes wide, not five and not fifteen, and dismisses the shorter window outright at 18:25. The times are part of his own framework and are not official exchange session definitions.
How First Presented FVG Logic Qualifies a Gap
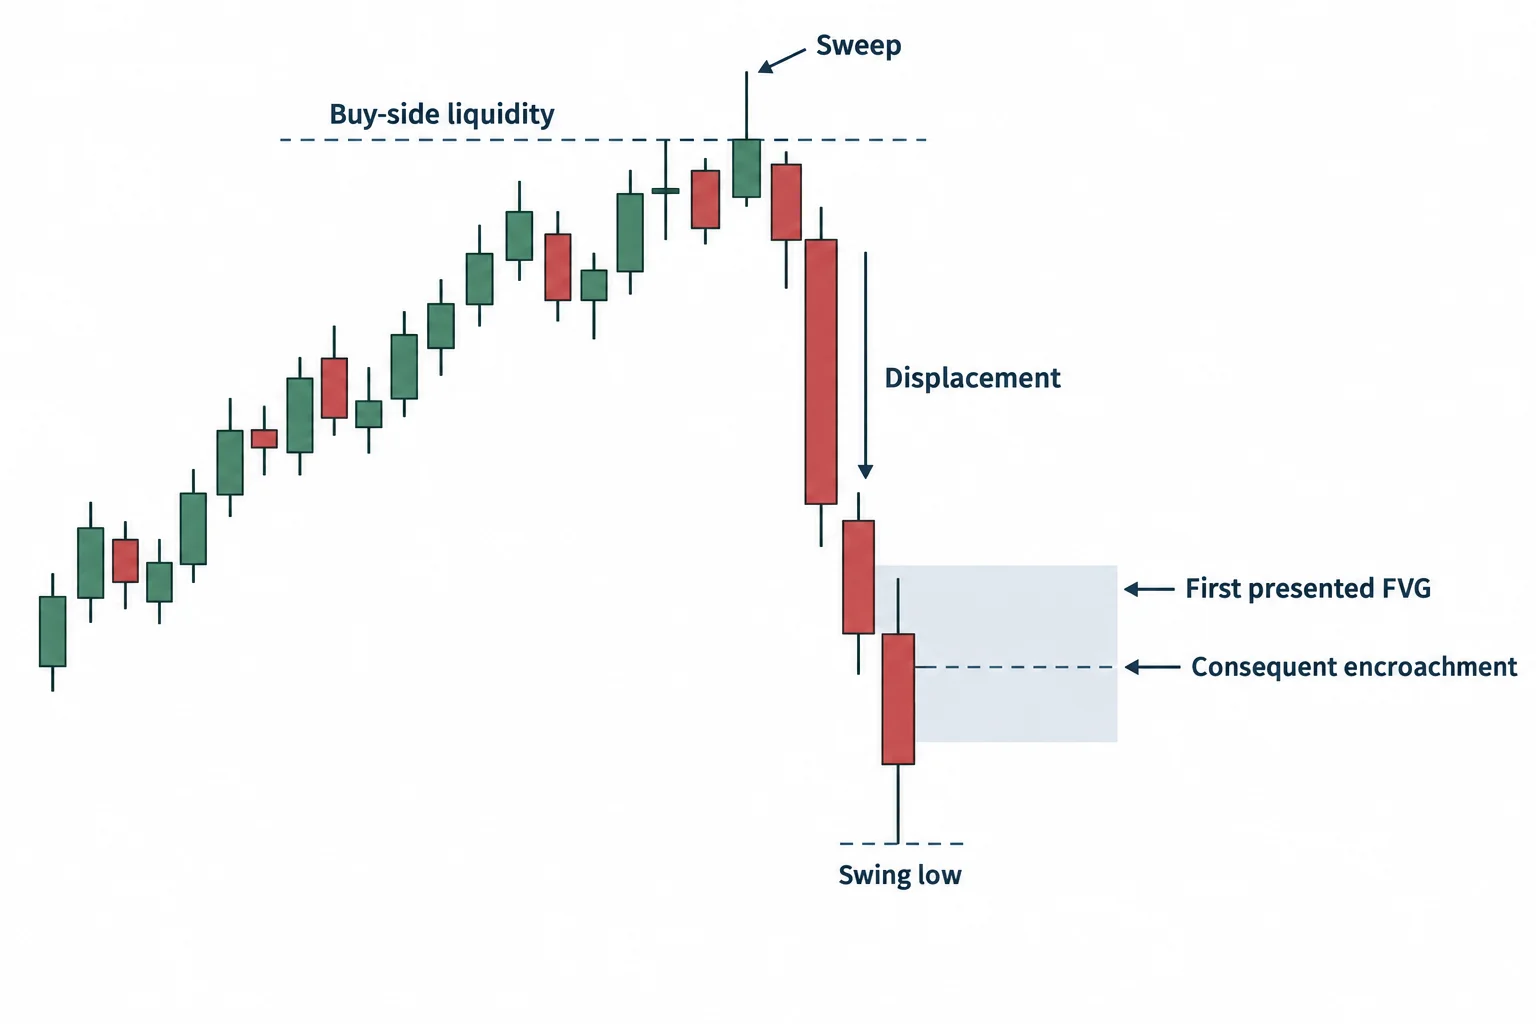
The qualification argument starts at 11:19, where he separates opening-range FVG logic from his “Silver Bullet” concept, which he describes as the first gap after 10:00 a.m. inside the 10:00 to 11:00 a.m. hour (11:26). For an opening range, he says he wants displacement first rather than simply taking the earliest imbalance on the chart.
His bearish London example runs in this order:
- Price trades above the nearby relative highs, which he describes as taking buy-side liquidity.
- A forceful move lower produces displacement.
- That move breaks the identified swing low, which he calls a bearish shift in market structure.
- The gap associated with that displacement becomes the relevant first presented FVG.
- Its midpoint (consequent encroachment in his vocabulary) is then watched as the reaction level.
At 13:19 he answers the obvious objection directly: the earlier gap he ignored had not engaged the swing low, while the gap he selected sat inside the proximity of that low and was “tethered” to the displacement that took it out, so structure (not chronological position) decides which imbalance matters. He calls the selected bearish inefficiency a “suspension block” at 13:38 and distinguishes it from a single-candle order block. That term is one the automatic transcript may have recognised imperfectly, so check the wording against the audio and chart around that timestamp.
He applies the same 30-minute logic to the 9:30 to 10:00 equity window and to the New York open range, describing a second example from about 22:18 in which buy-side liquidity is taken, a swing low gives way, and the gap tied to that break becomes the reference area whose midpoint he watches at 23:18.
He also links the idea to false breakouts, using the term “turtle soup” at about 24:13 while stating plainly that he did not invent false breakouts (24:28); what he claims as his own is how he locates the instances in which a false breakout is likely to matter, and he contrasts that with a fixed 20-day high or low rule.
FVG Inversion Logic and the Midpoint Test
He then describes an imbalance that price crosses and later approaches from the other side, and insists on the term inversion fair value gap rather than “inverse fair value gap” (19:03).
For his bearish example he expects the gap’s midpoint to cap price, with candle bodies staying below it even if a wick pokes through, and he notes the upper half of that particular imbalance was left untouched before price ran to the sell side. He attaches a frequency claim to this pattern, that it acts as an inversion “90% of the time” when buy-side has been taken and the gap starts the 30-minute range (17:39). The recording supplies no dataset, sample or test method for that figure, so it is best read as the presenter’s own impression rather than a measured probability.
ICT Opening Range Warnings Near Market Close
The last few minutes of the lecture are about protecting a reader rather than about the opening-range rules. He refers back to a post he says he published on October 30th (29:49) and reads its wording as a suggestion that it might be time to take some profits in NQ, dated 4:35 a.m. Eastern on October 30th, 2025 (30:38). He says price then stopped exploring the upper half of the relevant wick (31:41) and describes a move down into the 24,700s (32:00). He adds that he said something similar about gold (32:34) and that he had also expected Bitcoin to trade below 100,000 (30:11).
Treat those passages as the presenter’s own account of what he posted and what he says followed. This page has not verified fills, position sizes, account results or the exact levels in those charts, and one of them is given only as a round figure recalled from memory. Nothing in that section should be read as a performance record or as a reason to copy a trade.
How to Study ICT FVG Logic Step by Step
Read as instruction, the lecture describes a filter rather than a signal. The steps below follow the order the lesson uses:
- Set the chart clock. Confirm the platform’s timestamps are showing the session timezone you think they are before you mark anything.
- Define the session anchor. Write down which window you are using (1:30 to 2:00 a.m., 9:30 to 10:00 a.m., or 7:00 to 7:30 a.m.). And do not change it after seeing the outcome.
- Mark pre-open references. Note the nearby relative highs or lows and the prior activity he uses as context, such as the 6:30 information for the New York range.
- Identify FVG candidates. Apply one consistent three-candle imbalance definition to every example.
- Evaluate displacement. Ask whether the move expanded away from the preceding range and whether it broke the swing he treats as structural.
- Define invalidation. Decide in advance what happens to your reading if price fills the gap or trades fully through it, and whether the gap then becomes an inversion.
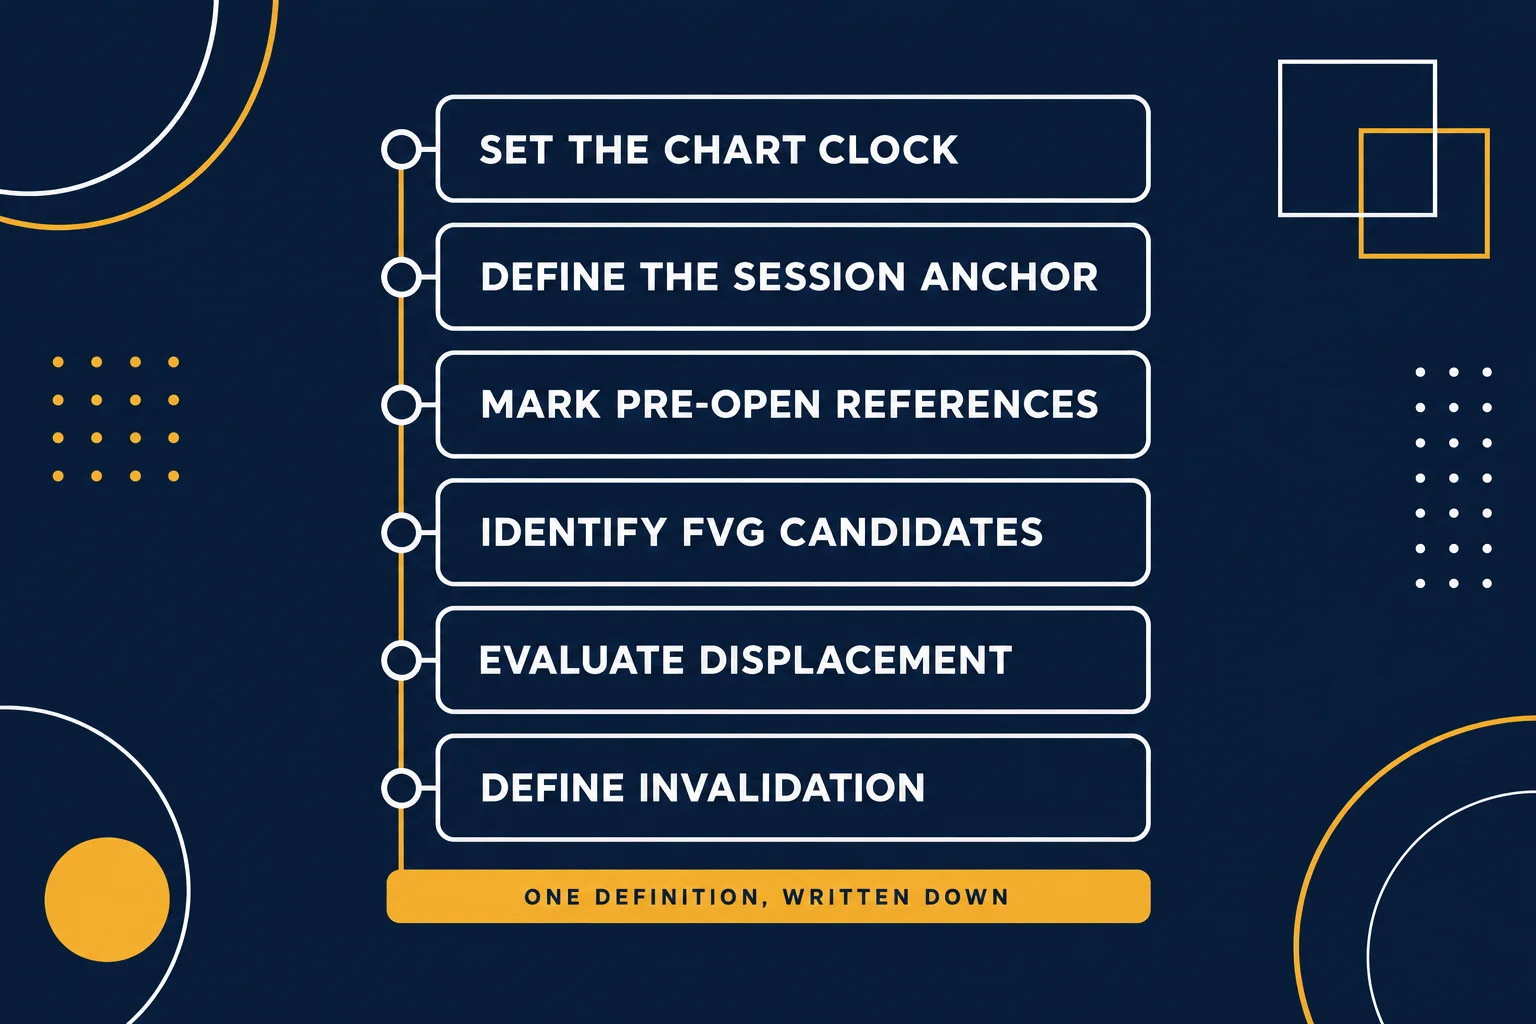
The value of the sequence is that it forces a written definition before the review. It does not establish that the model has positive expectancy; that requires a properly sampled test, and the lecture offers nothing of the kind.
ICT Opening Range Risks for Funded Traders
Opening ranges, first presented gaps, inversion and consequent encroachment are descriptive vocabulary. They carry no guaranteed win rate, and the recording’s probability statements are unsupported by any evidence in the recording itself. Define one objective version of the rule, then test it across a sample that includes the losses and the ambiguous cases before you consider it for a funded account.
Funded traders should also confirm current provider requirements directly, because daily loss calculations, news restrictions, consistency rules and permitted strategies differ by programme and can change. A setup that looks clean on a chart can still be unsuitable if its stop distance, timing or volatility exposure conflicts with those rules.
Watch the original lesson on YouTube
This video cannot be played inside another website: the embedded player itself reports “Playback on other websites has been disabled by the video owner.” That response was read from the player on 2026-09-14, so no player is reserved here and no embed is left blank. The recording is available directly on YouTube.
Watch ICT Opening Range Theory \ 1st Presented FVG Logic on YouTube ↗
ICT Opening Range Theory Sources
Four references stand behind this page: the lecture mapped to it, the first-party post that announced that lecture, the unofficial community indicator this study framework overlaps with, and the exchange schedule behind the 9:30 a.m. New York clock. Each is used only for what it states, and all four were reachable when checked on 2026-09-14.
ICT Lecture and Announcement Post
The mapped recording, ICT Opening Range Theory \ 1st Presented FVG Logic, was read through its own timestamped automatic transcript of the complete audio track on 2026-09-14. The watch page is public and not unlisted, credited to the channel The Inner Circle Trader, with a publish and upload time of 2025-11-11, a runtime of 2,091 seconds and a visible count of about 216K views; the player reports that playback on other websites has been disabled by the video owner.[1] The first-party social post of Nov 11, 2025 from the same account carries this title with a youtu.be link to the same recording, which is how the article is tied to the right lesson.[2]
Two limits carry over from the source. The transcript is automatic, so specialist terms and spoken figures can be misrendered. The “suspension block” label is flagged in the body for that reason. And the transcript contains no visual chart data, no fills and no verified outcomes, so this article attributes the presenter’s market interpretations instead of restating them as facts.
What the FVG Indicator Can and Cannot Confirm
The TradingView community script named in the study notes combines the opening range gap with the first presented FVG.[3] It is an unofficial third-party indicator: published by an individual author, not affiliated with The Inner Circle Trader or with BestProps, and not tested here. Its page presents it as a protected-source script updated Jul 28 and describes the first presented FVG as the first meaningful Fair Value Gap inside the Opening Range, with optional replacement logic for a stronger displacement-based candidate. Because the source is protected, its arithmetic cannot be inspected, and its description is the author’s interpretation rather than the rule set the lecture sets out. The lecture’s requirement that the gap be tied to a liquidity event and a market-structure shift is stated by the presenter, not by the script.
Anchoring the 9.30 Opening Reference
The Holidays & Trading Hours page published by the exchange operator lists the core trading session for NYSE-listed equities as 9:30 a.m. to 4:00 p.m. Eastern Time.[4] Read the scope carefully: that anchors the clock the 9:30 reference refers to, and it is an equities session for listed tapes. It is not the presenter’s definition of an opening range, and it says nothing about index futures or forex, whose sessions are set by other venues and products.
ICT Opening Range Sources
- [1] YouTube: ICT Opening Range Theory \ 1st Presented FVG Logic – The Inner Circle Trader (source recording; page metadata read 2026-09-13: public, not unlisted, publish and upload time 2025-11-11, runtime 2,091 seconds, about 216K views; audio transcript read 2026-09-14; embed playback reported as disabled by the owner, re-read 2026-09-14)
- [2] X: The Inner Circle Trader (@I_Am_The_ICT), Nov 11, 2025 (first-party post carrying the recording’s title and a youtu.be link to the same video)
- [3] TradingView: ICT Opening Range Gap + 1st Presented FVG (tristanlee85) – unofficial third-party, protected-source indicator; description read 2026-09-13, page reachable 2026-09-14; no performance or repainting claims made here
- [4] NYSE: Holidays & Trading Hours – core trading session for NYSE-listed equities quoted as 9:30 a.m. to 4:00 p.m. ET (read 2026-09-13; reachable 2026-09-14)
BestProps is not affiliated with The Inner Circle Trader, X, TradingView or NYSE, and none of the sources listed here endorses this article, this site or any setup. Opening range, opening range gap, first presented FVG, displacement, consequent encroachment, inversion and liquidity are used here as the lecture uses them, not as standardised industry definitions.