
How we researched this article
BestProps used document-based research from primary firm sources, checked September 24, 2026. The complete source list, scope, limitations, and commercial-state record appear near the end of this article.
In ICT Forex & Futures Market Review October 4, 2025, published on 4 October 2025 at 12:02 p.m. Pacific time and running 16 minutes 57 seconds, ICT works through the US dollar, EUR/USD and GBP/USD, then spends most of the recording on December mini Nasdaq futures and shows how he maps the same references onto a US 100 CFD. He opens by saying “Today is October 4th, 2025” (0:09), refers throughout to Friday’s trading and points viewers back to his October 3 commentary (8:32), so the session being reviewed is Friday 3 October 2025 and the recording was published the following day, a Saturday.
The organising idea is selectivity. He calls the currency pairs compressed and low-quality, says he is not interested in them under those conditions, and moves the discussion to futures, where he carries a prior session’s opening-range gap forward, divides ranges into quadrants, and re-reads a level as an inversion after price trades through it. The terminology, levels and interpretations below are his, as spoken in the recording; the transcript does not establish entries, fills, size, results, or what happened after publication.
Source note: this page is grounded in the timestamped transcript of the recording linked below — automated speech recognition of its full audio (local Whisper large-v3-turbo), not YouTube captions. The recording is a chart-by-chart screen review, and no chart imagery was available to the reviewer, so the timestamp links point to what the speaker says, not to independently verified candle boundaries, quadrant markings or levels.
The forex review: a holding pattern in the dollar, EUR/USD and cable
US dollar
ICT begins with the dollar index and says price is trapped between two areas he characterises as inefficiencies (0:37). On the five-minute chart he points to a volume imbalance, with a dashed line marking its consequent encroachment between two candlestick bodies (1:07). He describes price reaching into that imbalance at the start of trading, displacing, and trading back out to the consequent encroachment (1:38), before breaking lower into what he calls a bullish fair value gap (1:41). He says the move then fell short of the consequent encroachment of a buy-side imbalance / sell-side inefficiency level he marks on the chart (1:57); the automatic transcript renders that figure as “97.58.2”, most plausibly 97.58 on the dollar index, and it should be checked against the recording before being reused.
His conclusion on the dollar is that it is “kind of like doing nothing” (2:10). He argues that a market like this is harder for a student to navigate because it is not highly liquid and offers high-resistance rather than low-resistance liquidity runs (2:33), and he says that is why he steers attention to other markets such as futures (2:46).
EUR/USD
He treats EUR/USD as a similar picture (2:49). The levels he quotes are 1.17562, which he describes as the consequent encroachment of a premium wick and colours purple so it is not confused with the neighbouring object, and 1.17449, which he describes as the quadrant of that wick (3:00). He says Friday’s trade pushed up into the 1.17562 level and that the ranges were very small, adding that a move in the region of 20 handles or 20 pips is not worth paying attention to (3:43). The transcript renders the term inconsistently as “consequent encouragement” in places; the intended term is consequent encroachment.
GBP/USD (cable)
Cable gets more attention because he says it had better structure (3:57). He marks the upper quadrant of a discount wick at 1.34302 as the level that defined the low (4:28), then describes a shift in market structure at what the transcript renders as a “buy-side balance, sell-side efficiency” level, the high of that discount wick being left behind as price rallied (4:39). From there he carries forward a breaker and treats the sequence as a breakaway gap and a measuring gap (4:59) before price traded up into the quadrant at 1.34864, the lower quadrant of a premium wick (5:13).
His teaching point here is how to handle nested or closely printed wick measurements: one quadrant can become the working reference, and if price passes through it the next quadrant becomes the level to watch (5:30). He estimates the resulting run at “about 45 handles or so maybe 50 handles” and says the pair did not do much beyond that (5:50).
December mini Nasdaq futures
The futures section starts at 6:06 with December mini Nasdaq futures. He notes that he had posted his views on X the previous day rather than livestreaming, and works from a five-minute chart, carrying forward Thursday’s regular trading hours opening range gap (6:35). He says price closed that gap and came back to it, came down to the consequent encroachment, rallied to a level he treats as incidental, and then fell and took out a sell-side liquidity pool he had mentioned in Thursday’s commentary (6:56). The labels he assigns in that block are Thursday’s regular trading hours closing price, the opening range gap’s lower quadrant and consequent encroachment, and the upper quadrant, which he ties to the opening price based on Thursday’s trading (7:16). He says wide gaps like that should be carried forward because they will be used the next day, particularly when the next session is trading inside the range the gap defines (7:40).
He then drops from the five-minute chart to a one-minute chart and looks only at Friday’s trading (8:06). Price traded up into Thursday’s opening range gap high and broke down (8:30), and he points viewers to his October 3, 2025 commentary and Telegram notes rather than re-explaining the “suspension blocks” he had introduced there (8:32). From there he tracks price down to the consequent encroachment of a discount wick carried forward, up into a “first presented fair value gap”, through the quadrant levels, and lower again, with a bullish fair value gap becoming an inversion fair value gap (8:45).
At 9:13 he pauses to answer viewers who said he had marked a level incorrectly. He insists he knew what he was describing when he posted it, says he will make mistakes but wants to be challenged on substance, and refers to having removed those commenters from his X view. That is his response to the disagreement; because the transcript does not include the chart, the question of which level was correct cannot be settled from this recording.
He goes on to describe price selling off into the lower quadrant and returning up to a higher suspension block, which he now shades differently from the previous day and treats as an inversion level, or a premium array, with the consequent encroachment holding and price selling off a second time from inside it (9:35). He then answers a question asked on X about whether the level had been highlighted and graded on his daily chart, saying price reached the upper quadrant at 24,955 and came very close to the consequent encroachment before reversing (10:16).
Next come the weekly range measurements (10:45):
- High of the week: 25,196.50
- Low of the week: 24,633.25
- 20% of the weekly range: 25,083.75
- 30% of the weekly range: 25,027.50
- 40% of the weekly range: 24,971.25
He notes that these levels were drawn shortened rather than extended to the hard right edge of the chart (11:23) and says the decline almost reached half of the weekly range before the session closed (11:33). In the afternoon segment he describes the same suspension block acting as an inversion level, a gap he says was too small to annotate, bodies respecting the upper quadrant, and price then hammering between the 40% and 30% weekly levels and Thursday’s regular trading hours closing price, which is where he says the range into the close was defined (12:20). He does not state an entry, a stop, a position size, a fill or a result anywhere in this section, so none of it can be read as a documented trade.
Applying the same references to a US 100 CFD
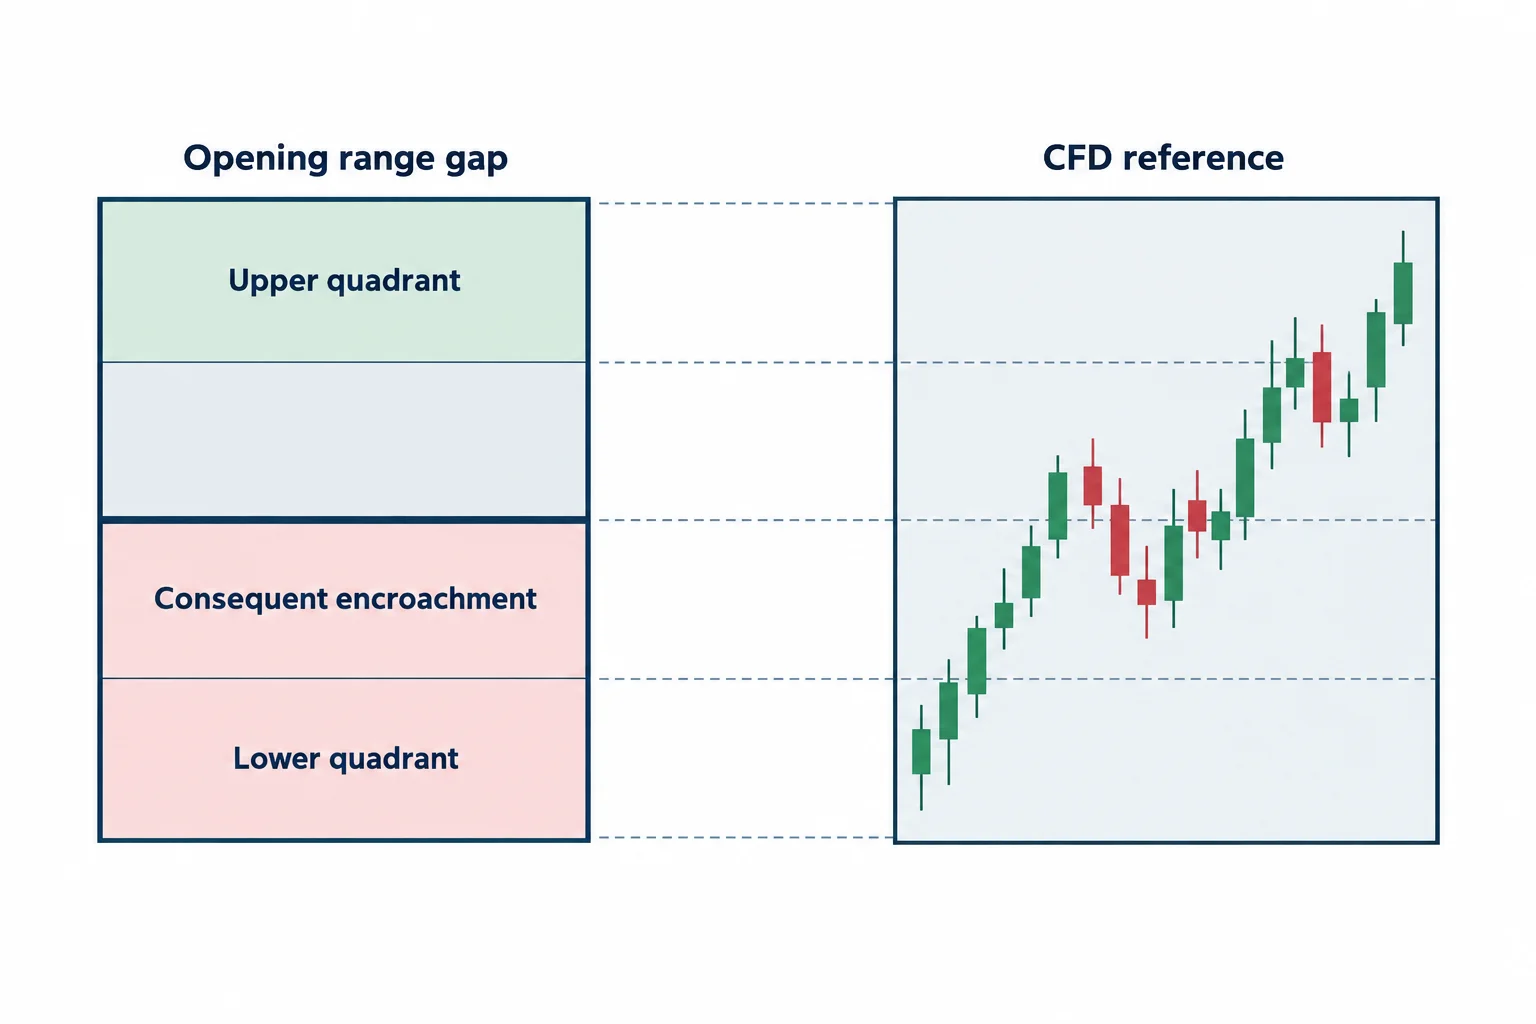
From 12:32 he addresses viewers who trade CFDs or forex outside the United States. He argues they can follow the Nasdaq work on a US 100 CFD, names the broker platform he uses for the demonstration, and says explicitly that he is not suggesting anyone open an account or trade with that firm (12:54). He describes the instrument as the CFD version of the Nasdaq futures contract and acknowledges it will not mark to market perfectly (13:08). On its daily chart he repeats the same reading: the week’s high and low, the 40% and 20% retracement levels, a first presented fair value gap, and the quadrants and consequent encroachment of Thursday’s regular trading hours opening range gap, down to its lower quadrant and the low of the gap itself (14:03).
His stated reason for doing this is that a CFD has no regular trading hours, so the references have to be constructed by hand (14:32). The method he describes is short:
- Take the price on the one-minute chart at 4:14 p.m. Eastern time, mark it with a ray, and label it the regular trading hours closing price for that day (14:51).
- Treat that annotation as belonging to the next trading day (15:13).
- Take the one-minute price at 9:30 a.m. Eastern time on that next day as the second reference point (15:26).
- Use the two prices as the high and low of a synthetic regular trading hours opening range gap, then grade that interval the same way he grades the futures gap (15:34).
He says the approach delivers the same information he is showing on the futures chart (15:47), that the CFD delivered down into the upper quadrant as he had called on X on Friday afternoon (15:59), and that previous days’ opening range gaps should not be discarded because he believes the algorithm keeps using them (16:23). Two qualifications belong with this section. First, the claim that a prior gap is still being used is his interpretation of the chart, not a demonstrated property of CFD or futures pricing. Second, because a CFD has its own session, feed and spreads, a gap built from its own one-minute prices will not necessarily line up with the same reference on the futures contract.
How to study a review like this
Nothing in the recording is presented as a completed trade: there is no stated entry, stop, size, fill or result. That makes the useful question not “did this work?” but “what exactly is being claimed, and where does the claim come from?” The four checks below are the ones this article applied while reading the transcript.
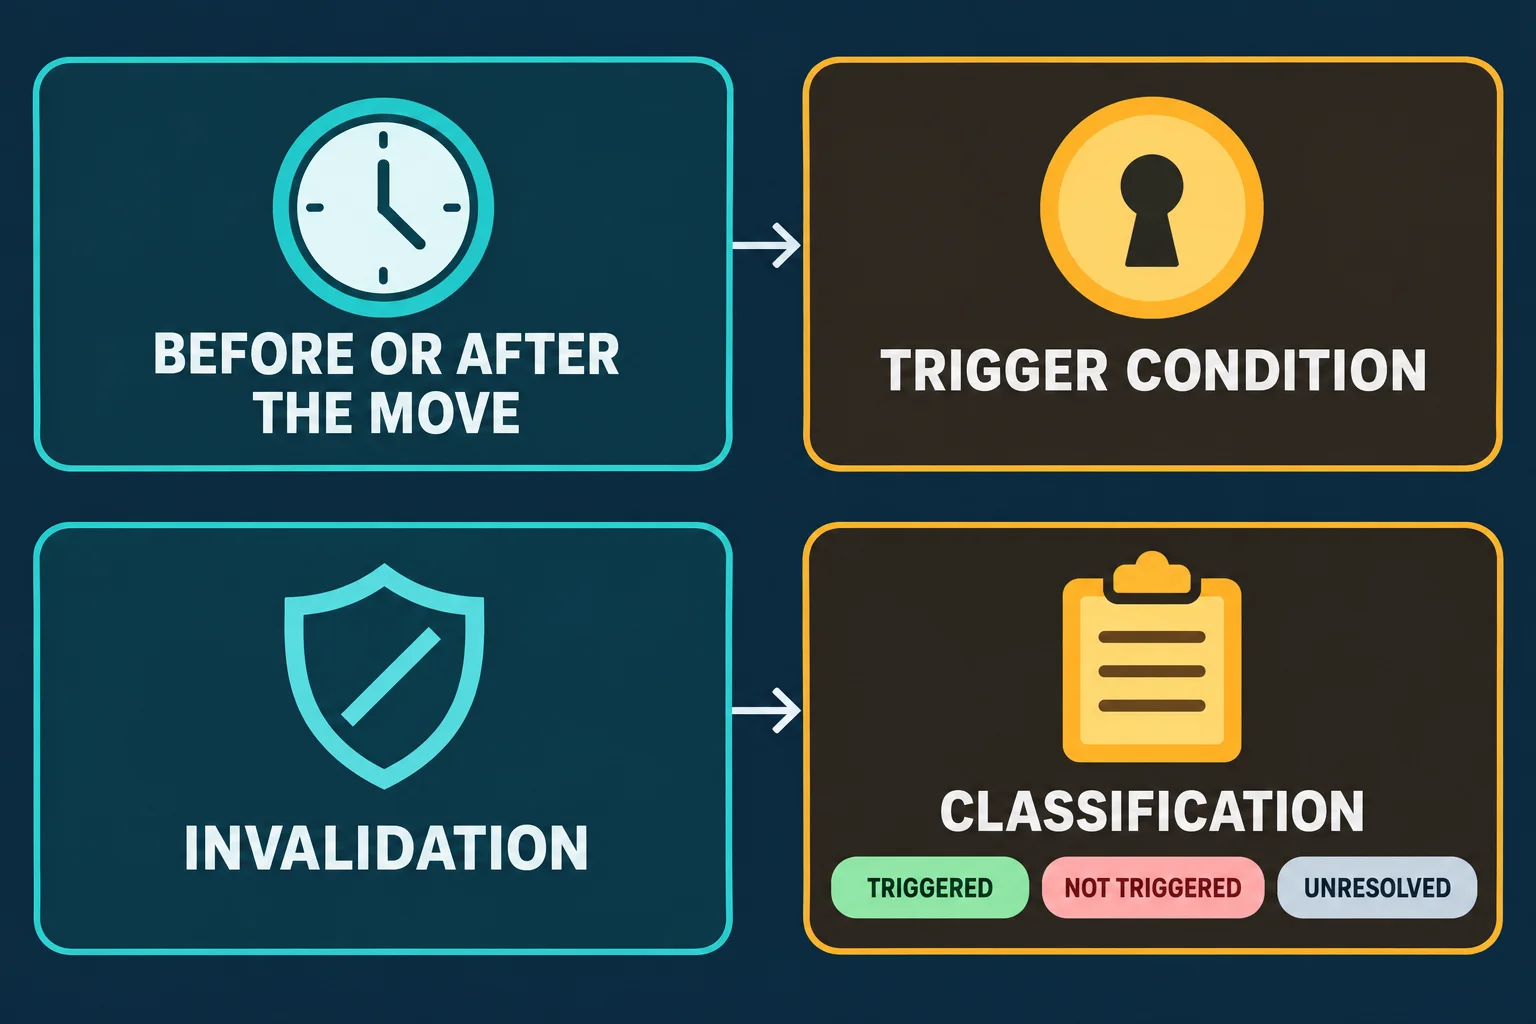
- Timing. This recording was published on Saturday 4 October 2025, after the Friday session it reviews, and the speaker refers back to his Friday X posts and Telegram notes. Commentary delivered after a move is a retrospective explanation, which is a different class of evidence from a call made in advance.
- Trigger. The working condition he describes is price reacting at a carried-forward reference — a prior session’s opening range gap quadrant, a wick quadrant or an imbalance — rather than an unconditional directional call.
- Invalidation. He describes levels failing and being re-read as inversion levels once price trades through them, which is a change in how the level is treated rather than a stated stop. No stop level is quoted in this recording.
- Classification. Because no position is described, nothing here can be labelled triggered, not triggered, invalidated or profitable on the recording alone. Only the chart work can be checked, and only against the video.
The broader lesson he draws is selectivity: he declines to manufacture a forex setup from a compressed week and concentrates on the market where he sees defined, carried-forward structure. That is a statement about his own process, not evidence that the process produces a repeatable edge.
Watch the original lesson
This article draws on the automatically transcribed English audio of ICT Forex & Futures Market Review October 4, 2025 (1,017 seconds, 16:57). The transcript is a source for the speaker’s words, not independent proof of the chart work, the levels, or any result.
Watch the original lesson on YouTube
The video cannot be played inside another website: when its embedded player was opened and clicked on 14 September 2026, the player itself reported “Playback on other websites has been disabled by the video owner.” and settled on a “Watch on YouTube” prompt, with no duration and no playback progress reported. That message is the reason no embed is left blank here; the recording itself is available directly on YouTube.
Watch ICT Forex & Futures Market Review October 4, 2025 on YouTube ↗
Primary source and further reading
- ICT Forex & Futures Market Review October 4, 2025: the primary source, on the channel The Inner Circle Trader. Its watch page was re-read on 14 September 2026 and reported a publish and upload time of 2025-10-04T12:02:42-07:00, a runtime of 1,017 seconds, a view count of 80,467, and public, non-unlisted availability. The timestamp links above jump to the passages they summarise.
- NinjaTrader Support: Trading Hours Templates — Desktop (article created 19 September 2024, updated 14 August 2026; read 14 September 2026): the charting documentation states that trading hours templates “dictate the session start and end times for an instrument displayed on a Chart”, that each instrument is assigned a default template, and that a template’s time zone, session start and end times and holiday hours are editable. It is cited for why a 9:30 a.m. or 4:14 p.m. Eastern reference is a chart setting rather than a shared fact, not for any level discussed above.
- YouTube Help: Restrict embedding (platform documentation, read 14 September 2026): the page documents the owner-side embedding control and states that “Block on all domains” means no embedding of videos on any website. It is cited to explain why this page carries a watch card instead of a player, and it describes a control held by the video’s owner, not a restriction chosen by BestProps.
- IANA: Time Zones — The Time Zone Database (read 14 September 2026; current release 2026d, dated 11 September 2026): the database records local time, UTC offsets and daylight-saving rules and is “updated periodically to reflect changes made by political bodies to time zone boundaries, UTC offsets, and daylight-saving rules”. It is cited only for why a clock time in a review is not reproducible without its time zone.
Method note: captions were not available for this upload, so this article was written from the automatically transcribed English audio of the full recording (local speech-to-text, Whisper large-v3-turbo). That transcript is a rendering of speech, not a verified document, and it garbles some specialist terms: it writes “consequent encouragement” for consequent encroachment, “suspension block” (a term used without definition here, explained by the speaker in his 3 October notes), “buy-side balance, sell-side efficiency” for what is most likely buy-side imbalance and sell-side inefficiency, “EGIF” for TGIF, and “river trading hours” for regular trading hours. It also does not distinguish whether “December mini Nasdaq futures” refers to the E-mini or the Micro contract, so this article uses the speaker’s own wording rather than assigning a contract code. All levels and clock times above are quoted as spoken and were not visible to the reviewer on the chart.
This is independent educational commentary on one dated market review. It is not official ICT material, not a transcript, not a tested trading system, not investment advice, and not evidence that the approach described produces the results the speaker reports. BestProps is not affiliated with The Inner Circle Trader, YouTube, Google, NinjaTrader Group or IANA, and no source listed here endorses this article or any setup. Terms such as liquidity, displacement, market structure, fair value gap, opening range gap, consequent encroachment and suspension block are used on this page only as descriptive study terms from the general ICT vocabulary; none is presented as official, tested or free of repainting, and nothing here has been replayed, backtested or measured.