
Key takeaways
In the June 5, 2025 Storytellers episode, ICT walks the dollar index and EUR/USD from the weekly chart down to the five-minute chart.
Read the full summary
In the June 5, 2025 Storytellers episode, ICT walks the dollar index and EUR/USD from the weekly chart down to the five-minute chart. His stated opinion is a softer dollar that pulls toward a nearby low and then a lower pool of sell-side liquidity, with EUR/USD firmer instead — but he says repeatedly that he is not actively trading forex, that he does not have the confidence here that he claims in index futures, and that the lesson is not an invitation to trade. The concrete chart technique in the episode is his rule for discarding an indecisive candle when measuring a fair value gap (14:22), and the concrete risk fact is that non-farm payroll was due the following morning.
How we researched this article
BestProps used document-based research from primary firm sources, checked September 24, 2026. The complete source list, scope, limitations, and commercial-state record appear near the end of this article.
Educational note: This is a source-led recap of a recorded teaching session, not financial advice and not a signal. The lesson contains chart commentary and conditional scenarios, not a trade record: no entry, exit, size or result for the dollar index or EUR/USD is stated in it, and nothing here recommends a position in either market.
What the recording is, and how this recap is sourced
The recording mapped to this article is 2025 Storytellers Series – Dollar & EurUsd June 05, 2025, a first-party upload on the channel The Inner Circle Trader with an upload and publish timestamp of 2025-06-05T15:53:47 (UTC-07:00) and a runtime of 1,157 seconds (19:17). ICT opens by confirming the date himself, saying it is June 5, 2025, and that he has been on the go all day (0:52).
This recap is grounded in a timestamped transcript of the complete audio, produced by automatic speech recognition rather than human-checked captions. The recognizer mangles ICT’s shorthand in places — fair value gap comes through as "fair bank gap", consequent encroachment as "consequent encouragement", and some segment boundaries merge words — so the terms below are given as the surrounding discussion supports them and every timestamp link is a pointer to the passage it describes. No chart, candle or annotation in the video was inspected for this article, and no price is measured here.
Scope: the dollar index and EUR/USD only, and not his active market
Two framing statements govern the whole lesson. First, ICT says he is keeping his forex work separate from his index-futures work because forex is not the asset class he is actively trading at that moment (0:31). Second, he says he will not cover every pair or exotic, and will restrict himself to the most heavily traded forex pair, EUR/USD, which he also calls fiber (1:08, 1:16). He also mentions having shared London-session Nasdaq commentary earlier the same day (1:04); a same-day, same-series first-party lesson on Nasdaq futures exists and is listed in the sources below.
The weekly dollar-index map, and why he distrusts the fundamentals
The analysis starts on the weekly dollar-index chart (1:44). Before any level is drawn, ICT sets out an argument about method: tariffs switching on and off, and the resulting global trade uncertainty, make fundamental narratives unstable to trade from, so in his view the work has to be technical — reading how price is being delivered rather than what the news says (1:50 to 2:30). He then states the bias plainly: nothing in the current environment is good for the dollar index, a firmer dollar is not what large participants want right now, and softer dollar prices would be beneficial (2:37, 2:55).
The chart reference he names on that timeframe is a buy-side imbalance / sell-side inefficiency that price traded down through a few weeks earlier (3:05, 3:23). He also claims that the whole move was called in advance, first as a market maker buy model and then as a market maker sell model, and points viewers to his public posts and student live streams as the record (3:31 to 3:50). That is a claim about his own record, not something this transcript can check, and it is attributed as such here.
How he reads the rally into the inversion gap
The passage from 3:50 to 4:16 is the clearest technical explanation in the episode. An imbalance that price had already traded through became, in his reading, an inversion fair value gap: price rallied back into it, candle bodies filled the inefficiency and respected its consequent encroachment, while a wick was allowed to trade up through the inversion. He then describes a volume imbalance carrying price straight up into a level that was touched the previous week. The distinction he keeps returning to is the same one he uses elsewhere: bodies show where price was accepted, wicks show where it was probed.
He then states his objective and immediately qualifies the timing. He likes the idea of price eventually trading down to the nearby low, and if it accelerates there, he expects the sell-side liquidity below to be the draw (5:42, 5:48). He also concedes the range involved is not large. Most importantly, he says he does not know how soon or how fast the move would arrive because of what he calls the current level of manipulation (4:16, 4:23).
On the same timeframe he gives the counter-case against himself: the market traded below relative equal lows, and a reader could reasonably call that a fake break and expect a rally instead. His answer is that he is happy to be proven wrong but does not see higher dollar prices in the cards (6:00 to 6:26). He then lists what would have to change for him to turn bullish on the dollar — de-escalation across several named geopolitical conflicts, which he says is not happening (8:38 to 9:12). Treat that list as his stated condition rather than as analysis: it is unfalsifiable in the short run and cannot be scored.
The event horizon term, and his answer to the sceptics
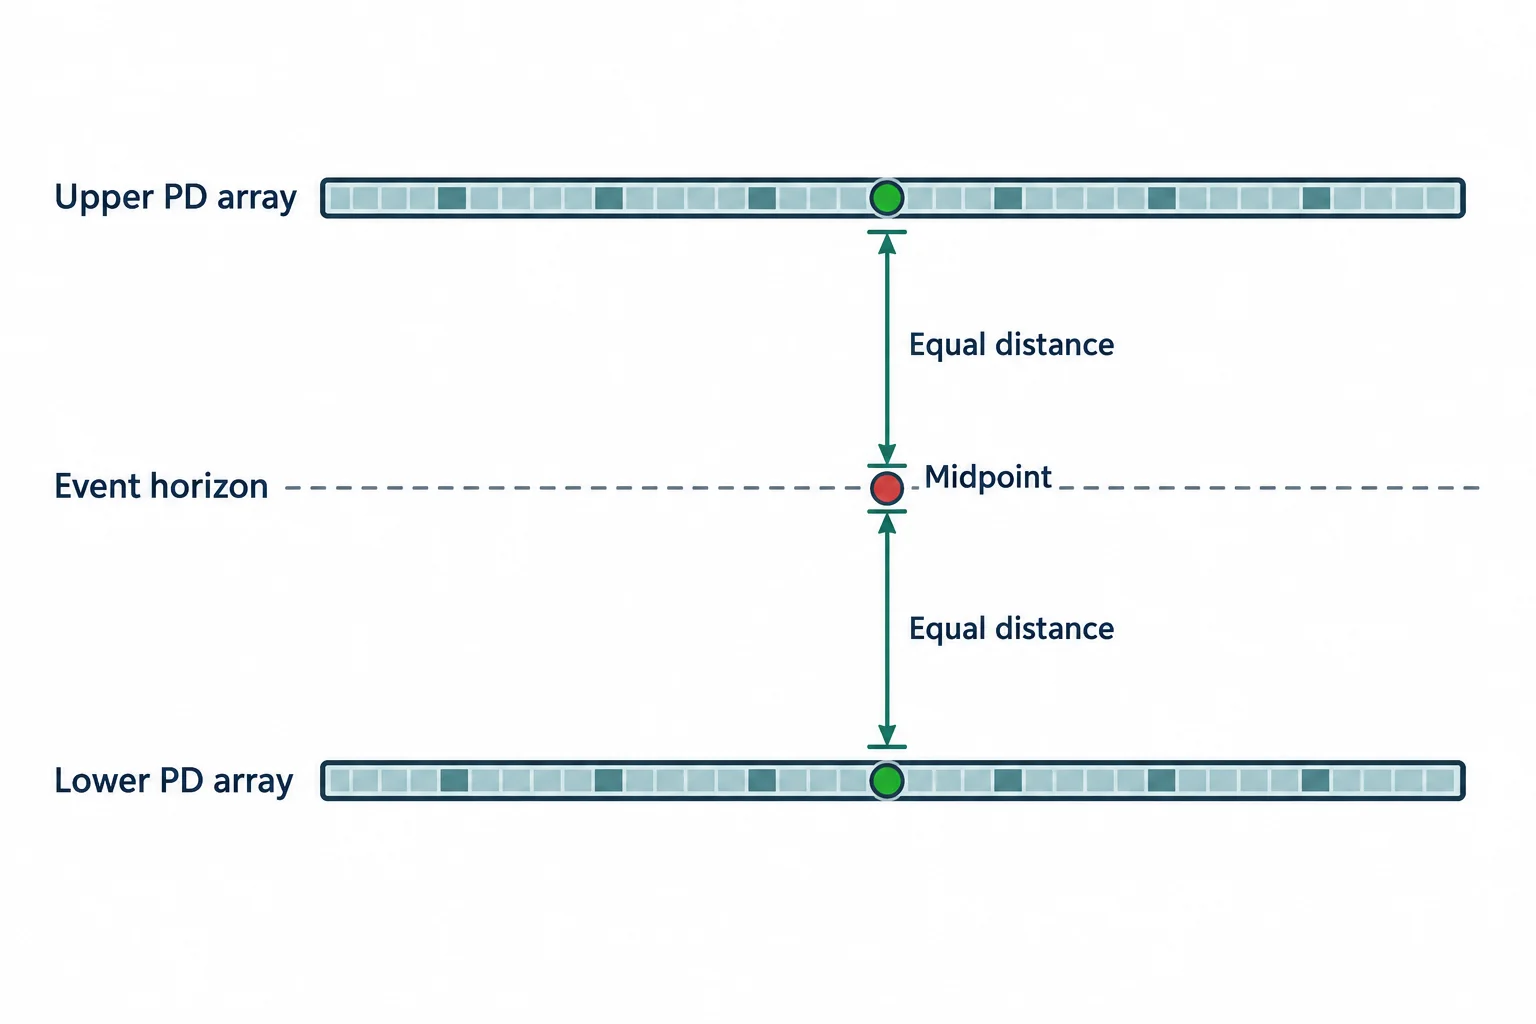
One piece of vocabulary in the lesson is specific to ICT and easily misread. He says any PD array he annotates, when two of them have a respectable amount of range between them, has a midpoint between them that he calls the event horizon (7:22 to 7:47). It is not an indicator, a volatility measure or an economic calendar event; it is half of a chosen range.
He also anticipates the objection that a chart with many lines will eventually be touched somewhere. His stated response is that the relevant point is which levels he calls salient in advance, not how many lines exist (7:52 to 8:17, and 8:29). A reader who wants to test that claim should timestamp the levels before the session rather than judge them afterwards, which is also the structure this article recommends at the end.
Dropping to the hourly, 15-minute and five-minute charts on the dollar
On the hourly dollar-index chart (9:12) he identifies a further imbalance that acted as an inversion fair value gap when price traded down through it, and says he is watching whether bodies stay contained inside it and whether price rolls back outside (9:27, 9:33). If the dollar index instead trades above that area, his stated conclusion is sideways drift for longer rather than an immediate bullish reversal (9:41 to 9:49). Longer term he still expects lower prices.
The 15-minute work begins at 9:57. He notes that the drop that day came on employment data, identifies another imbalance that he wants to use as an inversion fair value gap, and adds the quadrants inside it to his list of levels. He then sets the sequence he would need to see: price rolling out of the area, coming back up to hit it as a low, and trading down into the inefficiency (10:07 to 10:40). If the break lower comes, he says that small area should act as the catalyst for the move into the higher-timeframe weekly sell-side liquidity pool, and he calls that a probable trigger for a run into the nearby low and then further weakness (11:00 to 11:31).
EUR/USD: the level audit and the invalidation point
Back on the dollar weekly chart he adds one more downside reference: the weekly premium wick, with its lower quadrant, consequent encroachment and upper quadrant, plus the next buy-side liquidity pool above (11:36 to 12:16). He then transposes those same weekly levels onto the EUR/USD daily chart and immediately says the picture there is problematic and leaves him unexcited. What he wants is a sustained run that takes out a prior high without returning into the weekly bullish fair value gap he has marked (12:16 to 12:49).
The bullish detail he does point to is a reaction that stopped just shy of a consequent encroachment, which he reads as a sign of strength (12:59 to 13:07). He then says he wants the next morning’s non-farm payroll release to facilitate continuation, and that unless it does he will keep his specific key levels to himself and simply expect a lower dollar and a higher euro (13:15 to 13:34). That is worth flagging as a sourcing limit: the levels he says he would mention later are not in this recording.
The indecisive-candle rule, and the propulsion block
The most transferable technique in the episode comes while he defines a fair value gap on the EUR/USD one-hour chart (13:42). His rule is to delete indecisive candles from the construction: when a candle closes where it opened and both it and its neighbour traded the same range, he treats that candle as if it were not there, and measures the gap from the low of the range to the high of the remaining down-close candle (14:22 to 14:54). He says the resulting gap was then respected by candle bodies.
From there he describes price working a propulsion block — a bullish order block that, in his definition, may trade down into a previous order block but must not trade below half of its body, which he calls the mean threshold (15:07 to 15:20). He says the condition held, that price then traded to the low of that weekly wick, and that from there the acceleration higher followed. The invalidation he accepts for this read is explicit: if price melts down overnight below the referenced low, then, in his words, all bets are off and he wants to see what the following week brings (15:30 to 15:47).
He repeats that reference on the 15-minute chart and adds the reading he expects retail to have if it fails — that a rejection means lower prices — before saying that a lower dollar index makes that reading wrong (16:13 to 16:45). On the five-minute chart he watches relative equal lows that had already been broken before he started recording, and asks whether price can work back up through those levels as a bullish inversion fair value gap (17:14 to 17:41).
Event risk: employment data today, payrolls tomorrow
Two data references frame the timing. The earlier move he discusses happened on employment data released that day, which he calls a decaffeinated version of the week’s numbers (10:03, 17:00). The main event was the next morning: he says the real show is tomorrow at 8:30 Eastern, that a non-farm payroll release can undo what happened on the Thursday of payroll week, and that payroll was the main reason all of his scenarios were conditional (16:45 to 17:11, and 17:53). The date checks out: the Bureau of Labor Statistics published the May 2025 Employment Situation report on Friday, 6 June 2025 at 8:30 a.m. ET, which is the release he is describing.
His stated confidence limits in this market
The episode is unusual among trading videos for how far the presenter goes in limiting his own claims, and it is worth quoting the substance rather than summarising it away. He says trading forex right now is very difficult, that a brand-new, undercapitalised and impulsive trader without a model has next to no chance of being profitable in it, and that the favourable conditions he expects — the big ranges and extended price runs — are still ahead rather than present (4:41 to 5:35).
He then separates his two roles explicitly: in index futures he says he comes out with conviction, whereas in forex he does not have that same confidence, and he says he is telling viewers so they can calibrate (18:02 to 18:14). He adds the plain warning against over-leveraging on his opinion, notes that he can very well be wrong, and points out that a sudden European political collapse or a dollar spike is possible at any time (18:17 to 18:36).
One more provenance note belongs here. The video’s own description carries the CFTC Rule 4.41 disclaimer, which states that simulated or hypothetical results do not represent actual trading. The lesson itself reports no trade, so there is no result in it to evaluate either way.
How to study this recording
Because the episode is a live opinion rather than a scored call, the useful exercise is structural rather than directional:
- Separate the two halves. List what he says before each level is tested and keep it apart from what he says afterwards, so hindsight cannot be mistaken for foresight.
- Timestamp the levels. Write down the levels and conditions he names with the timestamps above, then check later whether the condition, not the opinion, held.
- Record the false breaks. He names one himself, the move below relative equal lows that could be read as a fake break — that is the kind of observation a journal is for.
- Note where he declines to be specific. He explicitly withholds key EUR/USD levels until payroll has passed, which is information about the confidence behind the scenario.
None of this is a strategy. It is the same distinction the lesson keeps drawing: a bias is a hypothesis, and the condition attached to it is what makes it testable.
Sources and further reading
Four references sit behind this article, and each is used only for what it states.
[1] The recording — 2025 Storytellers Series – Dollar & EurUsd June 05, 2025. Read on 2026-09-14: the watch page returned that title, the channel The Inner Circle Trader, a publish and upload time of 2025-06-05T15:53:47-07:00, a runtime of 1,157 seconds and a visible view count of 49,314. The runtime matches the 1,156.9-second audio transcribed for this recap, which supports source identity. Everything attributed to ICT above comes from this recording, through a machine transcript of its audio rather than its captions.
[2] The same-day Nasdaq lesson in the same series — 2025 Storytellers Series – NQ Futures June 05, 2025. Read on 2026-09-14: first-party upload on the same channel, published 2025-06-05T17:15:00-07:00, runtime 658 seconds, 58,491 views. It is listed here only because ICT refers in this recording to the Nasdaq commentary he had shared earlier the same day; this article does not summarise or interpret that lesson, and its own mapped article covers it.
[3] BLS Employment Situation release, 6 June 2025 — archived release page. Read on 2026-09-14 through the Internet Archive snapshot: the release carries the identifier USDL-25-0927, is dated Friday, June 6, 2025 at 8:30 a.m. ET and reports the May 2025 Employment Situation. It is used only to confirm the payroll release the lesson says it is waiting for.
[4] ICE US Dollar Index futures — product page. Read on 2026-09-14 and live at that time: the exchange’s page for the US Dollar Index futures contract, which is the instrument the "dollar index" chart in this episode refers to. It is here to identify the market, not to support anything ICT says about it.
Watch the full 19-minute lesson on YouTube
The lesson is a first-party upload on the channel The Inner Circle Trader and is public. It cannot be played inside another website — when its embedded player was opened and clicked on 13 September 2026 the player itself reported, "Playback on other websites has been disabled by the video owner" — so no blank player is left here. The recording is available directly on YouTube.
Watch 2025 Storytellers Series – Dollar & EurUsd June 05, 2025 on YouTube ↗