
Key takeaways
The Inner Circle Trader’s public YouTube lecture is a 32 minutes 36 seconds live demonstration of an unnamed intraday short, not a reproducible or statistically validated system, with 143,020 views as of 13 September 2026 and a platform upload time of 28 January 2025 at 2 59 02 p.m.
Read the full summary
The Inner Circle Trader’s public YouTube lecture is a 32 minutes 36 seconds live demonstration of an unnamed intraday short, not a reproducible or statistically validated system, with 143,020 views as of 13 September 2026 and a platform upload time of 28 January 2025 at 2 59 02 p.m. Pacific. The speaker shorts inside an inversion fair value gap, adds near its upper range and consequent encroachment midpoint to reach ten contracts, places a fixed stop above the gap, permits wicks above it but treats candle bodies above it as invalidation, and targets sell-side liquidity below a pre-3 10 p.m. swing low and a blue discount array. He later describes limit exits of three contracts inside a fair value gap and five below minor sell-side liquidity, another add, and a possible increase to sixteen contracts, then reports taking a first partial and moving the stop to cover costs. His only spoken price level is 21,411.75. He defines the market on close macro as 3 45 p.m. to 4 00 p.m., expecting fast bearish expansion toward liquidity, while NYSE separately defines its Closing Imbalance Period as 3 50 p.m. to 4 00 p.m. ET. The instrument, timeframe, fills, slippage, account result, risk relative to equity, daily loss limit, maximum adds and full trade outcome are not shown, and claims that an algorithmic script controls delivery, the regular-hours daily high was already final and volume-based explanations are irrelevant remain unverified interpretations rather than demonstrated market mechanics.
How we researched this article
BestProps used document-based research from primary firm sources, checked September 24, 2026. The complete source list, scope, limitations, and commercial-state record appear near the end of this article.
2025 Lecture Series: SMC Algorithmic Market On Close Macro is a public first-party upload on the YouTube channel The Inner Circle Trader. The watch page read on 13 September 2026 reports 143,020 views, a Pacific upload timestamp of 2025-01-28T14:59:02-08:00 (22:59:02 UTC on 28 January) and a runtime of 1,956 seconds, or 32:36, with normal playability and no unlisted flag. Third-party indexes label the same page 29 January 2025; 22:59 UTC on 28 January does fall on 29 January in timezones at or east of UTC+2, but the causes of such indexing differences are not asserted here. This article is transcript-based educational commentary on the recording, not an ICT publication.
ICT 2025 Lecture Goals
The recording opens with the speaker naming the session “Smart Money Concept, Algorithmic Market on Close Macro” and stating that he is going to show something he says other mentors cannot duplicate (0:13). He is already short when the recording starts and builds the example from there.
Two framing points matter for reading the piece. First, he says repeatedly that the material is a demonstration he does not intend to teach in full: “these are some of the things that I’m never going to teach you” (32:05). Second, the instrument and timeframe are never named. He refers to a regular-trading-hours daily high, contracts, lots and a 3:10 p.m. swing low, which is consistent with a US index futures session, but he does not identify the market and no price scale is readable from the transcript, so no instrument is asserted here.
SMC Market Short Setup
He describes establishing a short inside an inversion fair value gap (a gap that begins as a buy-side or sell-side imbalance and then reverses its role) and adds to it in the upper end of that range (0:35). His stop sits above the gap, and he states he does not move it higher. His stated objective is a short-term low that contains a fair value gap, which he shades blue and calls a discount array (1:09).
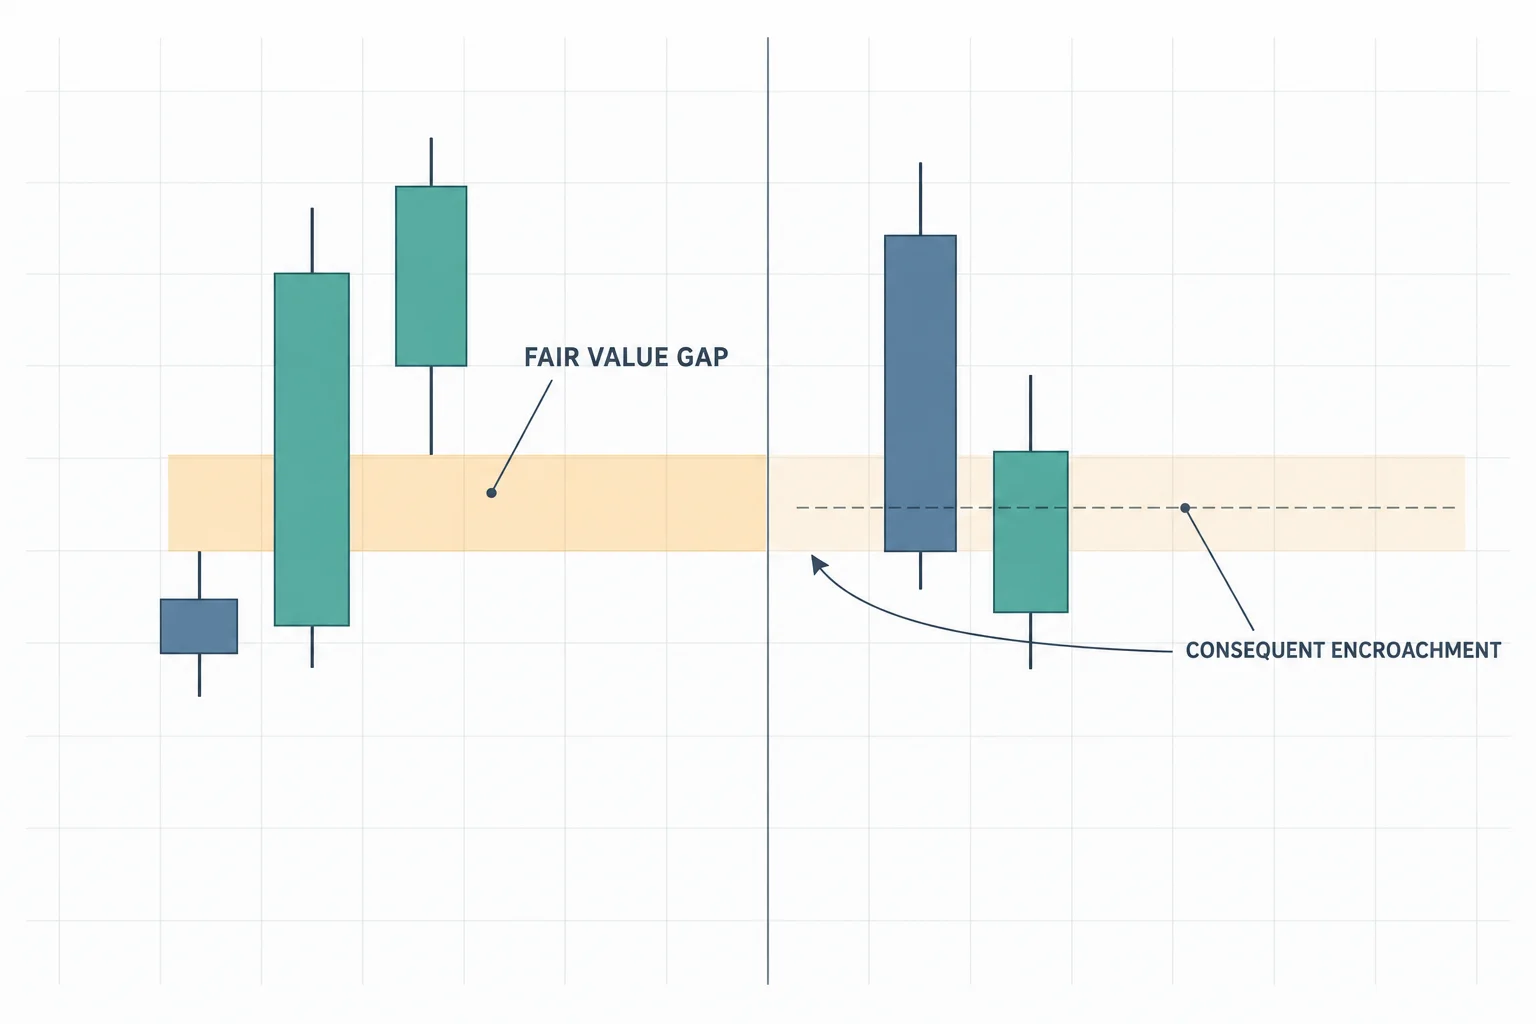
He then adds again at the midpoint of the inversion gap, using the term consequent encroachment, and reports the position as an even ten lots (1:44). The sequence is worth separating from the rhetoric: what he describes is scaling into a short at successive levels of a marked range with a fixed stop above it, which is a position-management pattern, not evidence that the range causes the move.
The liquidity reference he gives is a swing low that formed before 3:10 p.m., below which he says sell-side orders are resting (1:52). He also states that the daily high on regular trading hours has already printed and cannot be exceeded, describing it as “set”, meaning he does not expect a higher high (2:19). That second statement is the strongest claim in the recording and the least defensible from the recording itself: nothing in a narrated chart makes a session high final before the session closes.
Algorithmic Market Candle Bodies and Wicks
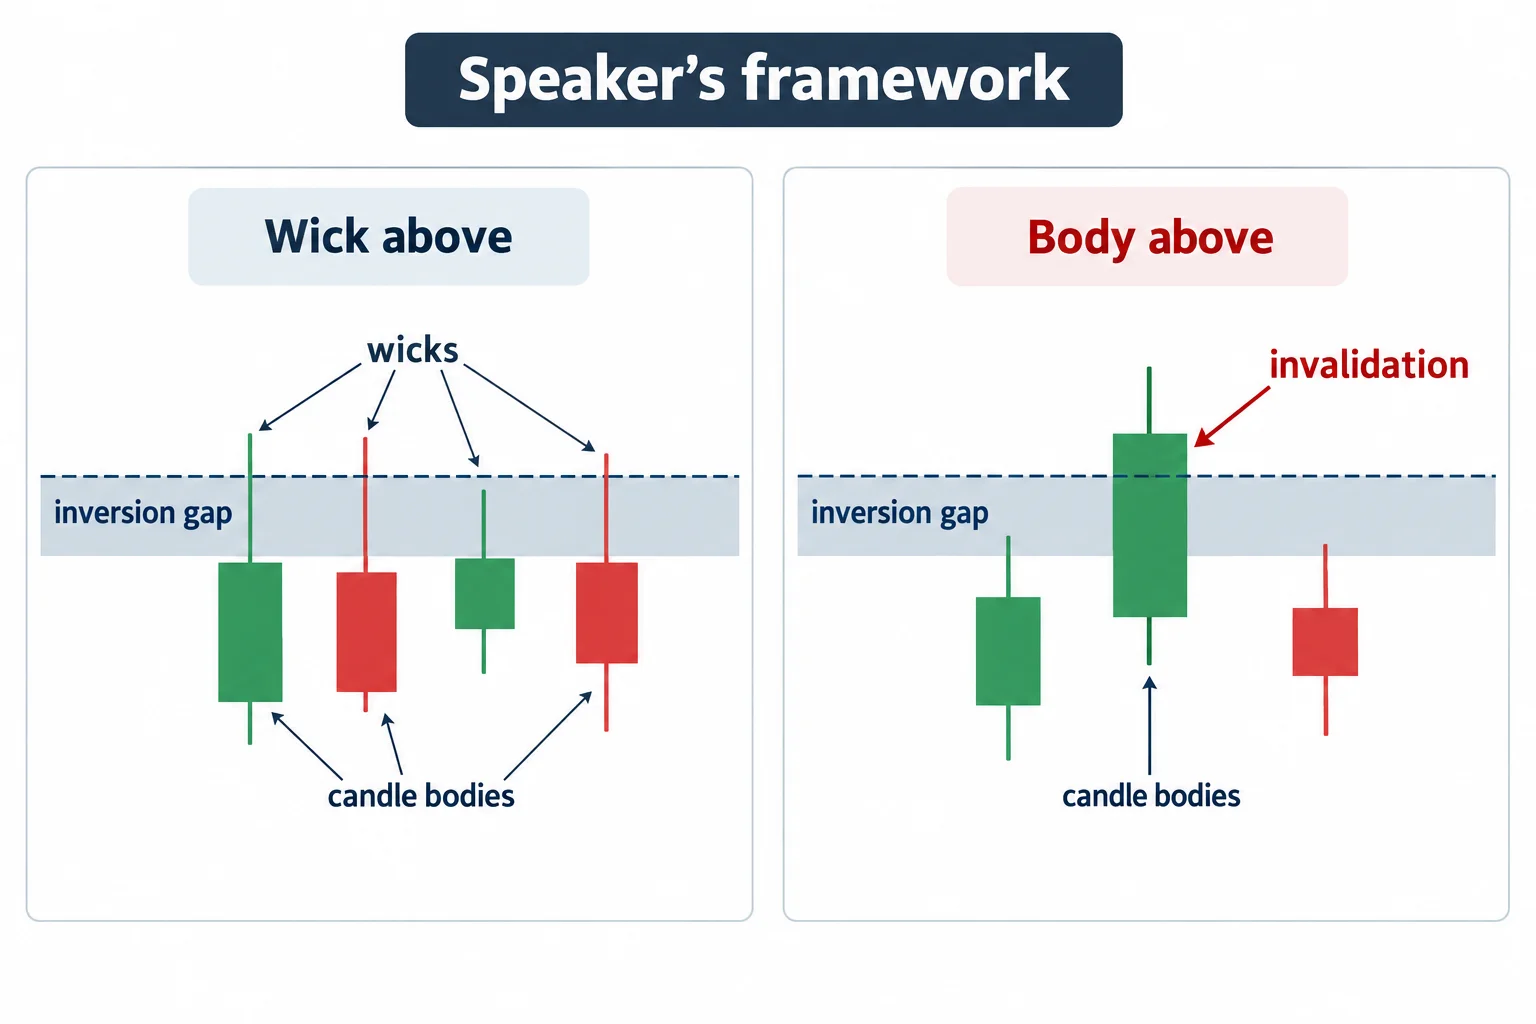
The trade-management idea he returns to most often is the difference between candle bodies and wicks. He allows wicks above the inversion gap and treats bodies trading above it as the invalidation signal. His phrasing is that bodies “shall not pass” (4:49), while small wicks above the gap are “permissible” (5:11). He narrates the moment price approaches his stop and holds, then returns to the same idea repeatedly as the position stays open.
He calls the pattern one of his reversal patterns and attributes it to “an algorithmic script that price runs on” (6:26). As a worst case he says price could return to a rejection block, which he defines as the highest up-close candle before the move (9:27), and he argues that even that return would not invalidate the placement of his stop.
The recording also carries audience-size claims: that about 44,000 people watched him “today and yesterday” and roughly 36,000 are in his Telegram channel (6:42), plus repeated assertions that the commentary is unedited and that he never deletes posts (20:09). The mapped watch page separately displays 143,020 views for this upload, which is a platform figure. None of these numbers is checkable from the transcript, and a recording published after the event cannot establish that its annotations were never revisited, so they are reported as his statements.
SMC Market Scaling Limits and First Partial
He describes working limit orders rather than a single exit: three contracts inside a fair value gap and five below what he calls the minor sell-side liquidity pool (11:00). He adds a further contract as price re-enters the inverted gap (12:44), and at one point says he would sell one more there to make it sixteen contracts short (13:15). Those counts are his narration of what he was doing, not broker records.
He then reports taking a first partial and moving his stop so that it covers costs, which he describes as the reason he is no longer concerned about being stopped (23:42). The only price-like figure he speaks in the whole recording is a midpoint level for the retracement he is willing to accept, which he gives as 21,411.75 (23:10). That number is a transcription of speech, not a chart value this review could read: no price feed, screen recording or chart image was available, so it is reported as what he said rather than as a verified level. Position sizes are likewise only what he narrates.
Market On Close Macro Window
The timing claim is the part of the lecture that can be examined independently. He defines the market on close macro as 3:45 p.m. to 4:00 p.m. and describes it as a script in which price starts “ripping for liquidity” (28:32). For the move he expects, he says he wants to see “speed and magnitude,” elongating bearish candles rather than a gradual drift (29:36).
He marks the arrival of 3:45 p.m. and narrates price moving toward the blue-shaded area he had identified in advance (30:02), closing with the remark that delivery began “right at the beginning of that macro at 345” (32:15).
One clarification is worth keeping separate from his claim. The speaker’s window is his own definition, not the exchange’s session structure: NYSE documents its Core Trading Session as 9:30 a.m. to 4:00 p.m. ET and a Closing Imbalance Period of 3:50 p.m. to 4:00 p.m. ET, which is a different ten-minute interval on a different market than the fifteen minutes he names. The two are not the same window and one does not confirm the other.
He also argues against volume-based explanations of the close, saying that whatever buy-side and sell-side counts a website or channel quotes, the move “absolutely has nothing to do” with them (18:30). That is a claim about market mechanics, not a demonstrated result, and it sits in a recording that elsewhere gives no independent evidence for its own causal account.
ICT Lecture Claims and Limits
The recording shows one narrated instance that the speaker frames as successful because price moved toward the area he had marked. It does not show the outcome of the full position, the fills actually achieved, slippage, spread, or the account result, and it does not compare the setup against the many cases where the same reading would fail. The strongest assertions (that a script controls delivery to these areas, that the daily high was final when he said so, and that order-flow metrics are irrelevant) are the speaker's model of the market, presented with certainty but not evidenced in the source.
Nothing in the lecture states position size relative to account equity, a daily loss limit, a maximum number of adds, or how to handle a session where the window passes without the expected expansion. Those are the constraints that decide whether a funded trader can act on any of this at all, and current prop-firm rules must be checked with the firm directly rather than inferred from a demonstration.
ICT 2025 Lecture FAQs
What is the market on close macro in this lecture?
It is the speaker’s own label for the 3:45–:00 p.m. window, which he describes as a period when price is delivered aggressively toward liquidity (28:32). It is not an exchange-defined session phase, and the recording offers no statistical test of it.
Why were wicks allowed above the gap but not candle bodies?
He treats the inversion fair value gap as resistance his stop sits above, so wicks that spike into or above the gap are tolerable while a candle body trading above it would show the level failing (4:49). That is his stated convention for this trade, not a general rule about wicks or closes.
Which market was traded?
The recording never names it. The references to a regular-trading-hours daily high, contracts, lots and a 3:10 p.m. swing low are consistent with a US index futures session, but no instrument, contract month or price scale is asserted here because the source does not provide them.
Is the January 29, 2025 date correct?
The mapped upload’s platform timestamp is 28 January 2025 at 14:59:02 Pacific, which is 22:59:02 UTC the same day and 29 January in timezones at or east of UTC+2. The platform date is used here; the indexing basis of third-party pages is not asserted.
ICT 2025 Lecture Series Source Video
The recording mapped to this article is 2025 Lecture Series: SMC Algorithmic Market On Close Macro, a public upload on the channel The Inner Circle Trader: 143,020 views, 2025-01-28T14:59:02-08:00, 1,956 seconds. Every timestamp link above points into that recording. The transcript used for this guide was produced by automatic speech recognition of the complete original audio rather than from YouTube captions, which is why specialised terms and the one spoken price may be misrecognised.
Watch the original lesson on YouTube
The owner has disabled playback of this video inside other websites, so it is shown as a watch card rather than an embedded player. The full 32-minute recording plays directly on YouTube.
Watch 2025 Lecture Series – SMC Algorithmic Market On Close Macro on YouTube ↗
ICT Lecture Sources and Provenance
These references support specific claims in the guide above. None of them is an ICT publication, none endorses or tests the methodology, and none is offered as evidence for the lecture’s account of how the close is governed.
How the Market Exchange Defines the Close
The speaker’s 3:45–:00 p.m. window is his own. NYSE’s Holidays & Trading Hours page states the Core Trading Session as 9:30 a.m. to 4:00 p.m. ET and lists a Closing Imbalance Period of 3:50 p.m. to 4:00 p.m. ET, followed by the 4:00 p.m. ET Closing Auction.[1] That is a documented exchange timetable for a cash equities market, not for the futures session the lecture appears to reference, so it is included to separate the two rather than to corroborate either.
Why This ICT Lecture Uses a Watch Card
YouTube’s own help documentation describes the uploader control behind the message this video returns: unchecking Allow embedding prevents a video from playing inside other websites.[2] When the embedded player was opened and clicked from a bestprops.com page origin on 14 September 2026, it reported “Playback on other websites has been disabled by the video owner” with no duration and no progress, which is why a visible watch card is used and no iframe is present.
Market Session Clocks and Daylight Saving
Any discussion of a late-session window depends on which clock is being read. The IANA Time Zone Database documents that it holds the history of local time for representative locations worldwide and is updated as political bodies change time zone boundaries, UTC offsets and daylight-saving rules.[3] The lecture states chart times in the afternoon without naming a timezone basis, so its window is quoted as spoken rather than converted.
ICT Lecture Method and Limits
This article is grounded in the full timestamped transcript of the mapped upload. The transcript was produced by local automatic speech recognition of the complete original audio, not human-reviewed captions, and the recording's charts were not examined by this review, so no price, level, fill, size or result is asserted. The single spoken level (21,411.75) and the position sizes are the speaker's own narration and are flagged as such wherever they appear. The terminology the automatic transcription mangles (including the SIBI phrasing and the inversion-gap wording) is described in the words the surrounding discussion supports rather than silently corrected.
