
Key takeaways
In the June 11, 2025 lecture, ICT keeps a higher-price bias on September Nasdaq futures, marks levels off a February 24, 2025 daily imbalance, warns that the day’s CPI release and the next day’s PPI release are unforecastable for him, and says he has no open position in that market.
Read the full summary
In the June 11, 2025 lecture, ICT keeps a higher-price bias on September Nasdaq futures, marks levels off a February 24, 2025 daily imbalance, warns that the day’s CPI release and the next day’s PPI release are unforecastable for him, and says he has no open position in that market. On the euro he reports a 70-handle result from a re-tested imbalance and says the week’s failure to hold a referenced gap leaves consolidation as the more likely immediate path. He closes by saying none of it should be used as a reason to put on real monetary risk.
How we researched this article
BestProps used document-based research from primary firm sources, checked September 24, 2026. The complete source list, scope, limitations, and commercial-state record appear near the end of this article.
Educational note: This is a source-led recap of a recorded teaching session, not financial advice and not a signal. The lecture is a first-party recording, but everything in it is the presenter’s own commentary and self-reported trading. Nothing here recommends a position in Nasdaq futures, euro FX, metals or any other market.
What the recording is, and how this recap is sourced
The recording mapped to this article is 2025 Lecture Series – EurUsd & NQ Futures June 11, 2025, a first-party upload on the channel The Inner Circle Trader with an upload timestamp of 2025-06-11T05:04:31 (UTC-07:00) and a runtime of 1,284 seconds (21:24). Its title and the presenter’s own remarks at 1:54 agree about the date: CPI was due that day and PPI the next, which matches the official release schedule for those two reports.
This recap is grounded in a timestamped transcript of the complete audio, produced by automatic speech recognition rather than human-checked captions. The recognizer renders ICT’s shorthand inconsistently, so the same imbalance is spelled SIBI, SIVI or SIPI in different places, and the midpoint term appears as consequent encroachment and consequent correction. No chart, frame or annotation in the video was inspected for this article: the levels below are the ones ICT names aloud, given as his descriptions rather than as measurements taken here. The numbers he reads off the screen carry that caveat explicitly wherever they appear.
Nasdaq: a higher-price bias and no position
ICT opens on the daily Nasdaq chart and restates a bias he says he has been carrying for weeks: higher prices, while resisting the urge to call a top (0:19, 0:39). The path he describes is a draw up through an imbalance, through the consequent encroachment of a wick, into a sell-side imbalance / buy-side inefficiency and eventually toward the prior high and all-time highs (0:57). He notes that these references have been on his charts for roughly two months and that they are built to survive a change of timeframe.
Two disclosures matter more than the levels. First, he says at 3:52 that he has no open position in the index at that moment. Second, at 4:03 he describes the environment as not conducive to low risk but to a high probability of being wrong, and says professionals do not push their edge in that kind of climate. The stronger price run, in other words, is presented as a map rather than as a trade he is holding.
How the levels are built: the February 24 imbalance and its quadrants
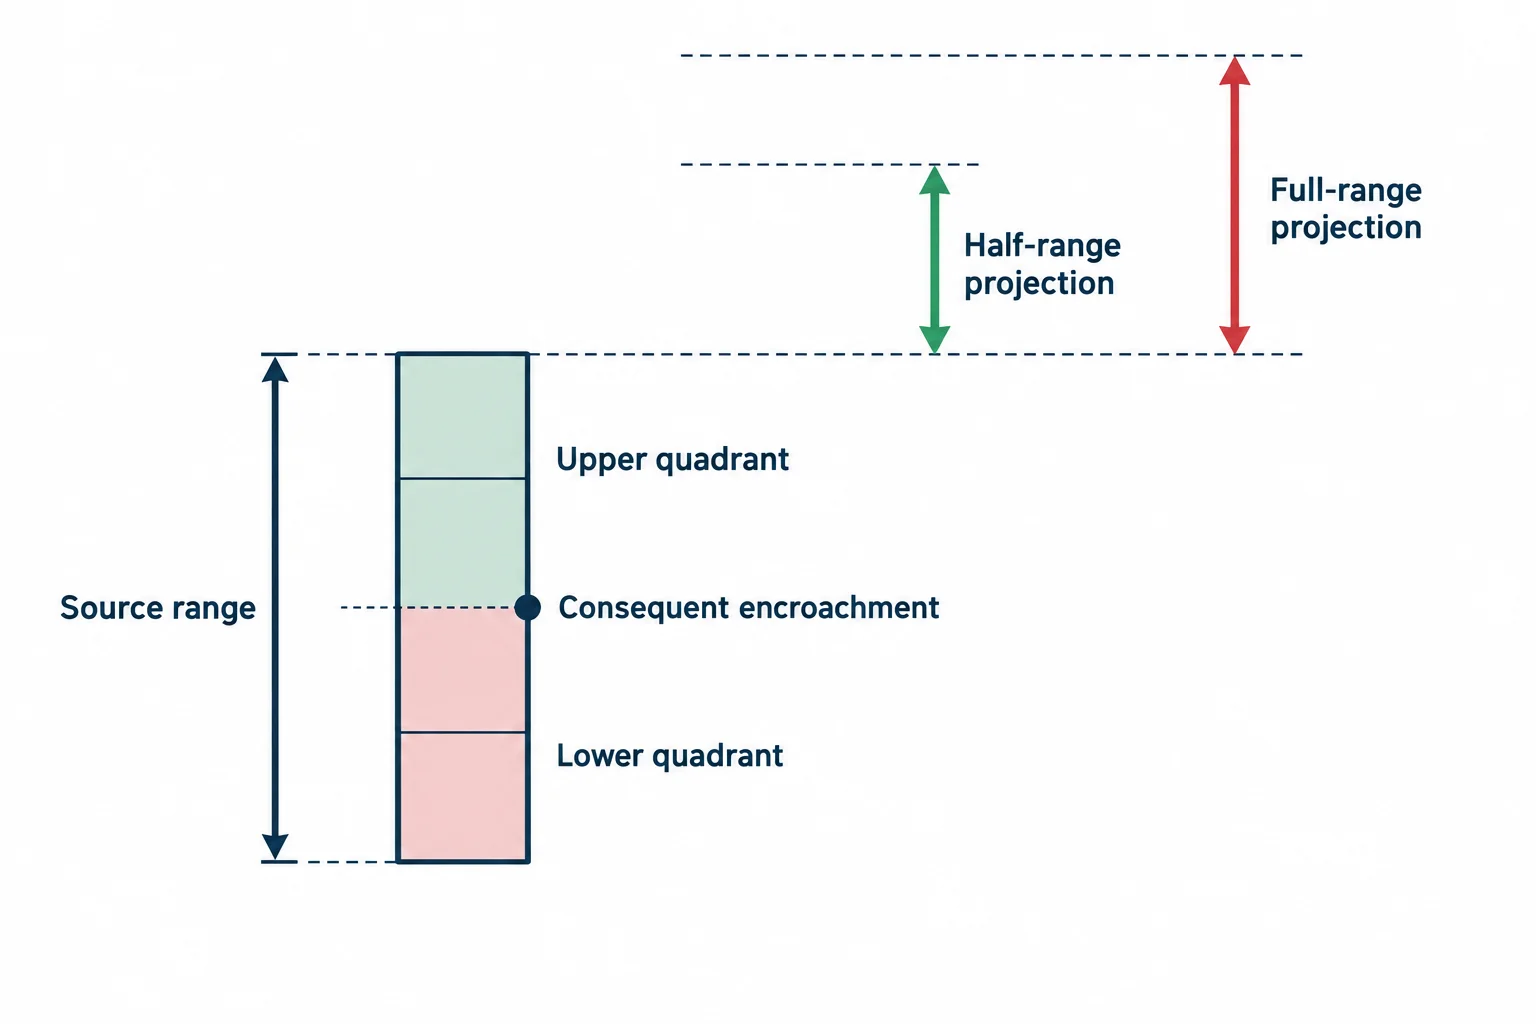
The technical core of the lecture is a single measurement routine applied to a daily imbalance dated February 24, 2025. ICT draws the range from that candle’s low to its high (4:59, 5:12) and then derives the references he trades from:
- The consequent encroachment, or midpoint, of the imbalance and of the wick that precedes it (5:34).
- Quadrant levels dividing that range, including an upper and a lower quadrant, plus what he calls an expansion boundary at which price may trade outside the range (5:51).
- A negative 0.5 projection of the same range, which he treats as equivalent to one half of a range, and a full-range projection he likens to a measured move (6:09).
He says the same half-range and full-range logic is what he teaches for opening range gaps, and calls it a universal principle rather than a setup that depends on this chart. At 5:46 he reads a level aloud as "981 even or thereabouts"; the recognizer may have dropped leading digits from a five-digit index price, so no exact price is asserted here.
Two further references come from his own annotations. He points to a buy-side imbalance / sell-side inefficiency dated June 3, 2025 that price has since reached up into, and to a down-close candle whose opening price he says was used as an order block that changed the state of delivery (2:41, 2:59). He adds that candle ranges have been overlapping for weeks, which he reads as time being spent in a range, and that from his seat retail keeps trying to short into the grind higher (3:35).
On the one-minute chart he walks the sequence back through those references: price reaching the lower quadrant and an order block, rallying to the high of the February 24 imbalance, returning to the order block, trading just outside the range and back to the upper quadrant, then arriving at the negative 0.5 level, which he says is also the consequent encroachment of the premium wick (7:31 to 8:23). He calls the opening rally a Judas swing, says he would not have traded it without the levels being drawn in advance, and notes that he misspoke once during the walkthrough, saying 2024 before correcting himself to February 24, 2025 (9:19, 9:30). He finishes the level tour at the high of the February 24 imbalance, which he says the London session used that morning (9:50). Because none of this was viewed, the overlaps he describes are his account of his chart, not a verified confluence.
Event risk: CPI today, PPI tomorrow
The lecture’s most concrete risk commentary concerns the two inflation releases. At 1:54 ICT says CPI lands that day and PPI the next, calls the combination a Molotov cocktail, and tells viewers not to trade aggressively (2:07). Both dates check out against the official releases: the Bureau of Labor Statistics published the Consumer Price Index for May 2025 on Wednesday, 11 June 2025 at 8:30 a.m. ET, and the Producer Price Index on Thursday, 12 June 2025 at 8:30 a.m. ET, which is what makes the lecture’s own framing of "today" and "tomorrow" internally consistent.
He then sets out two ways the CPI reaction could look: a one-way move that runs over everyone in a single direction, or a two-stage delivery in which price first drops to take the lows and then reverses higher (10:20, 10:31). He calls nearby lows suspect (10:14). Crucially, he states at 11:55 that the CPI and PPI figures are unknown to him and that in more than three decades he has never had enough confidence in forecasting them to put meaningful risk behind a view (12:04). His instruction is to study the scenario, not to copy it (12:21).
He also asks viewers in the United States to be careful over the coming weekend, saying unnamed parties were scheduling disruptions and that he wanted that in the front of their minds (2:29, 2:41). That is an unverified warning about events outside the market, and it is recorded here as the speaker’s statement, nothing more.
Dollar, gold and silver: the frame behind the bias
The macro layer he attaches to the charts is a weaker or consolidating dollar with higher non-dollar assets. He says he does not expect the dollar to go higher, expects gold to go higher, and says he told viewers in the previous year’s summer and autumn months to add metals exposure, adding that he does not think silver’s move is finished and that data centre construction is, in his reading, a demand driver for it (10:36 to 11:06).
He pushes the argument further than most educators would: he says commodities have a real supply-and-demand basis while everything outside that asset class, including holding a share of stock or a Nasdaq futures contract, is speculation (11:24, 11:32). That is his stated opinion and is labelled as such here; it is not a settled finding about market structure or about metals demand from data centre construction.
The euro: a reported 70-handle trade, then consolidation
ICT says he has had little time at the charts that week because of a family matter, and answers the obvious question directly: a single euro trade, entered around a re-tested imbalance, is what he has to show for it. His description is that he used the upper quadrant of a sell-side imbalance / buy-side inefficiency as a reclaimed level, that price moved below the sell side where he exited, and that the run was about 70 handles (12:46 to 13:43). He adds that he saw two other situations worth trading, one of which would have been a small loss stopped out around costs and the other about 40 handles, and that he was content to sit on his hands otherwise (14:06 to 14:17).
Those figures are self-reported. No statement, no fill, no account record and no contract size is shown or verifiable from the audio, so the 70-handle and 40-handle numbers should be read as the presenter’s own summary of his week, not as audited performance.
The more instructive part is what he does with the euro chart afterwards. He revisits a gap he had flagged before the weekend, notes that price has traded through the area in a way he calls sloppy, and says that his preferred outcome required holding above the level and continuing higher, while a break below it would imply sideways consolidation instead (14:32 to 15:09). He then says by any definition that is what the chart shows (15:18), and he points out that he told viewers in advance which condition would make him wrong (18:06).
Risk-on, risk-off, and what would change the view
Because the lecture leans on a dollar view, ICT defines his terms at 17:16: for him, risk-on means the euro advancing while the dollar falls or consolidates, and risk-off means the dollar index rallying while the euro falls or consolidates (17:37). He says he is primarily anticipating higher prices across the board except in the dollar (17:46).
He then marks the condition that would change the short-term read: he would like to see the euro make an attempt toward the nearby lows without taking them out, because they sit close to a larger low, and taking that larger low out would change the dynamic at least in the short term (19:48, 20:09). He explicitly says that is not a call of a top in the euro and not a forecast of an explosive dollar rally, that it is his opinion, and that none of it should be used as a trade idea or a reason to put on real monetary risk (20:26). What he wants from the level, he says, is to see it act as an inversion fair value gap before the week closes and then generate an attempt toward the highs (20:47 to 21:07).
The vocabulary the lecture assumes
Anyone watching this recording cold needs the shorthand it runs on. As used in this session:
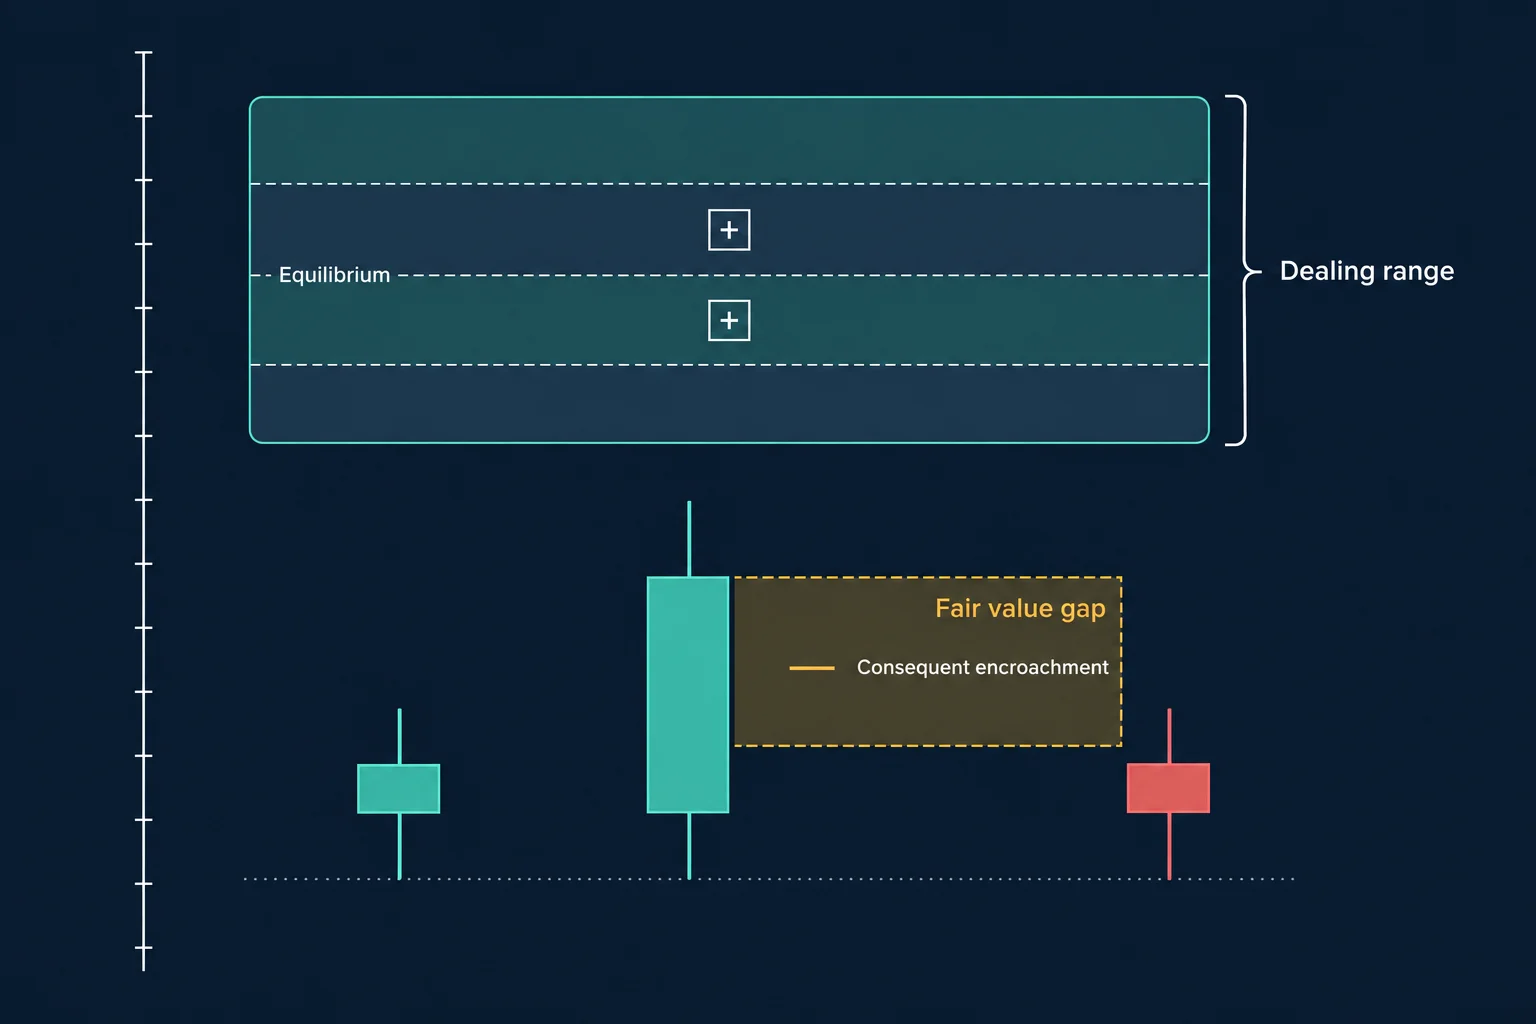
- Dealing range and quadrants. A selected high-to-low range, divided into four bands, with the midpoint used as a reference and an expansion boundary outside which price may travel.
- Fair value gap and inversion fair value gap. A three-candle imbalance; when price trades back through it against the original direction, he expects it to act as the opposite kind of reference, an inversion gap.
- Consequent encroachment. The midpoint of an imbalance or of a wick, used as a reference inside a broader setup.
- Order block. In this lecture, a down-close candle whose opening price he treats as the level that changed the state of delivery.
- SIBI and BISI. The two directions of imbalance he refers to. The transcript spells these inconsistently, so the label matters less than the chart it is attached to.
- Judas swing. His term for the opening move that runs one way before delivery the other way.
None of that vocabulary is a strategy on its own. The lecture’s own caution is that the levels are only as good as the context and the risk decision attached to them.
Journaling, consolidation and the discipline warning
The practice advice in this lecture is narrower than the chart work, and it is specific about why consolidation is the hard part. ICT argues that a new trader cannot know when a market will enter or leave consolidation, that this is the kind of thing experience supplies, and that journaling is the mechanism: if you do not journal, he says, you will never develop the skill of anticipating when consolidation is going to be there (15:25). He points viewers to his own free 2016 mentorship playlist for the vocabulary and says one of its early videos, Elements to a Trade Setup, covers the four major characteristics of a setup, consolidation being the first (15:58).
He also makes a point of transparency as a signal of experience: anyone sharing insights should be able to say plainly that there are times they do not know, and he says this is one of those times (16:49).
The closing warning is blunter than usual and is worth repeating as he framed it. He says that trading casually in an environment like this one — more trades than warranted, larger leverage than warranted, comparing results with strangers online while in drawdown — is a reliable way to lose an account, not to keep one, and that nobody else is to blame when it happens (18:31 to 19:13). That claim about failure rates is his assertion, not a measured statistic, but the behaviour it warns about — over-trading and over-leveraging during event risk — is the same risk this article’s own framing points at.
Sources and further reading
Four references sit behind this article, and each is used only for what it states.
[1] The recording — 2025 Lecture Series – EurUsd & NQ Futures June 11, 2025. The watch page was read on 2026-09-13 and returned that title, the channel The Inner Circle Trader, an upload and publish time of 2025-06-11T05:04:31-07:00, a runtime of 1,284 seconds, a visible view count of 68,195 and a playability status of OK. The runtime matches the 1,284-second audio that was transcribed for this recap, which supports source identity. Everything attributed to ICT above comes from this recording, through a machine transcript of its audio rather than its captions.
[2] BLS Consumer Price Index release, 11 June 2025 — archived release page. Re-read on 2026-09-14 through the Internet Archive snapshot: the release carries the USDL-25-0955 identifier and is dated Wednesday, June 11, 2025 for an 8:30 a.m. ET publication, and it states that the next CPI release was scheduled for July 15, 2025. It is used only to confirm that the CPI report ICT refers to as "today" was published on the date of the lecture.
[3] BLS Producer Price Index release, 12 June 2025 — archived release page. Re-read on 2026-09-14: the release carries the identifier USDL 25-0957, is timestamped 8:30 a.m. ET on Thursday, June 12, 2025, and reports the May 2025 Producer Price Index. It is used only to confirm the second of the two dates the lecture names.
[4] CME Group euro FX futures — product page. Read on 2026-09-13, when the page described CME’s listed euro FX futures as a way to take EUR/USD exposure with nearly 24-hour access. It is here to identify the instrument the euro section refers to. A re-read on 2026-09-14 was refused by the site’s automated-access block, so that statement stands on the 2026-09-13 read.
Watch the full 21-minute lecture on YouTube
The lecture is a first-party upload on the channel The Inner Circle Trader and is public. It cannot be played inside another website — when its embedded player was opened and clicked on 13 September 2026 the player itself reported, "Playback on other websites has been disabled by the video owner" — so no blank player is left here. The recording is available directly on YouTube.
Watch 2025 Lecture Series – EurUsd & NQ Futures June 11, 2025 on YouTube ↗