
Key takeaways
In ICT 2024 Mentorship Lecture #16 (August 24, 2024), ICT opens by calling this the very first video of its kind: an exercise for his son Caleb showing how to screenshot, annotate and log one session at a time on your own charts (0:19, 0:49).
Read the full summary
In ICT 2024 Mentorship Lecture #16 (August 24, 2024), ICT opens by calling this the very first video of its kind: an exercise for his son Caleb showing how to screenshot, annotate and log one session at a time on your own charts (0:19, 0:49). The chart work then walks the August 23, 2024 Nasdaq session from the daily chart down to the one-minute chart, covering volume imbalances, a balanced price range, the opening-range gap, his “event horizon” and the filter he calls first presentation. He also states plainly that the levels were outlined before the session and that the whole point is to reproduce the work yourself — so this article reports his method and his account, not a verified outcome.
How we researched this article
BestProps used document-based research from primary firm sources, checked September 24, 2026. The complete source list, scope, limitations, and commercial-state record appear near the end of this article.
What this ICT 2024 mentorship lecture 16 recording is
The lecture is framed as a teaching exercise rather than a signal service. He says at the start that this is the very first video of this type and that its purpose is to show Caleb, and any student following the same path, how to annotate a chart and how to log individual segments of price action (0:19, 0:23).
The instruction is explicit about whose charts to use. When he prompts viewers to screenshot a livestream, he says to do it on their own charts rather than his, and that using his charts is a shortcut he would rather people avoided (0:49, 1:12). His suggested tooling is plain: capture the screenshots in presentation software or a note-taking app and annotate the observations there (1:46).
The source behind this article is a timestamped transcript produced by local automatic speech recognition of the full original audio, not YouTube captions. Timestamps are automated and market terms are occasionally mis-heard, so where the transcript is unclear this article says so rather than resolving it. No chart, order ticket or account statement was reviewed, and the levels below are therefore his spoken references rather than values confirmed against the screen.
Build your daily ICT chart journal
He describes the practice as a daily meditation — repetitive, capable of feeling monotonous at first, and deliberately done every single day rather than only on technically interesting ones (2:30). His argument for the repetition is that it is how he became able to anticipate what price was doing before it formed (2:51).
He points students back to the Friday livestream that this review follows, saying he talked very little there and described only what he was observing in price action (3:10). The skills he attributes to the journaling are deciding when to sit still, when to anticipate a price run, and which side of the market to focus on (4:13). He also admits he is not filling the chart in for the viewer because he knows a screenshot can be saved and forgotten (4:39).
Move from the ICT daily chart down to one minute
The chart work starts on the daily Nasdaq chart (5:27). He notes a volume imbalance, refers viewers back to the live stream of August 13, 2024 for how the up-side objective was framed, and marks a bearish order block with its mean threshold drawn as a dashed red line (5:38, 5:57). He describes the market working into that threshold on the Thursday, then says Friday had Fed Chair Powell speaking at 10 o’clock (8:19).
The definition he gives for a volume imbalance is precise and worth quoting as he states it: it is any candle whose body does not touch or overlap the previous candle’s body, so a separation between the two bodies is the signal, and wicks overlapping does not remove it (9:07, 9:19).
Journal ICT balanced price ranges and displacement
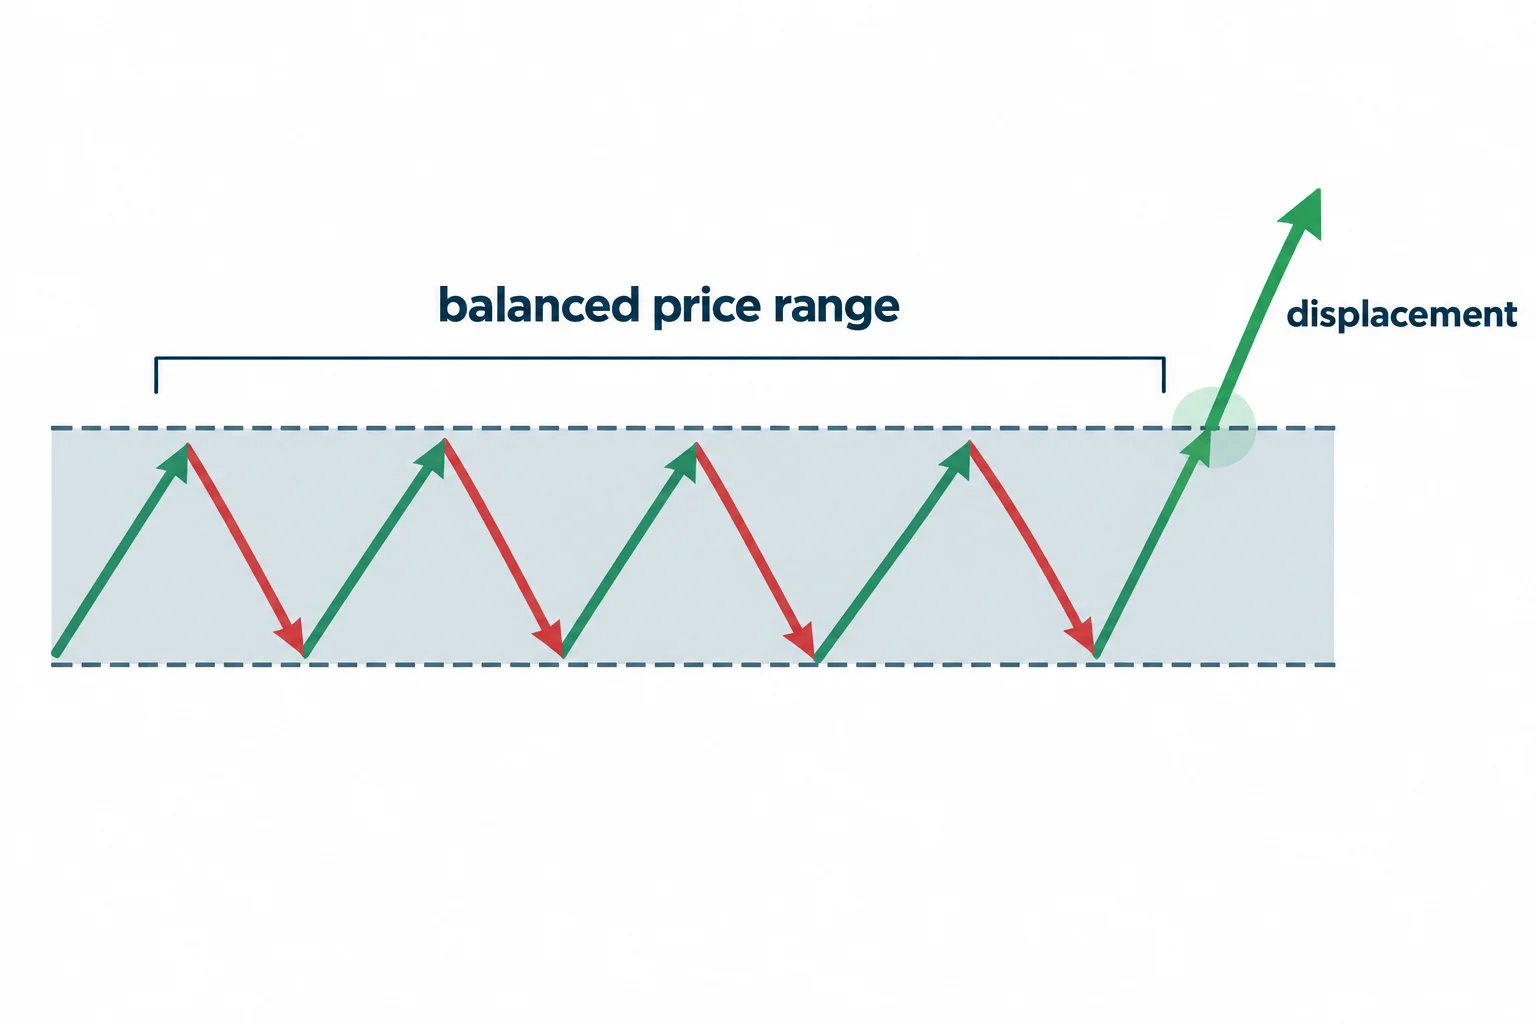
On the one-minute chart he marks an area he calls a balanced price range (13:39). His explanation of the term is behavioural rather than structural: price traded down and up repeatedly through the region, offering comparatively efficient delivery in both directions, and only once it left that region did the range become “balanced” (15:14, 15:29).
His stated conclusion is that such a range is difficult to trade through, and that the stops resting above it are what he calls high-resistance liquidity — the kind of level that in his framework needs something significant, such as manual intervention, to clear (16:28, 16:31). The examples he gives for that kind of intervention are scheduled events — FOMC, payrolls, CPI and PPI — and his advice is to trade after those news drivers rather than into them (16:54).
He also describes displacement as price leaving such an area aggressively, and says a return to a balanced range should by his logic struggle to get through it (18:20, 18:32). That is his interpretation of order flow, not a measured property of these ranges.
Chart the ICT opening range and the first-presentation fair value gap
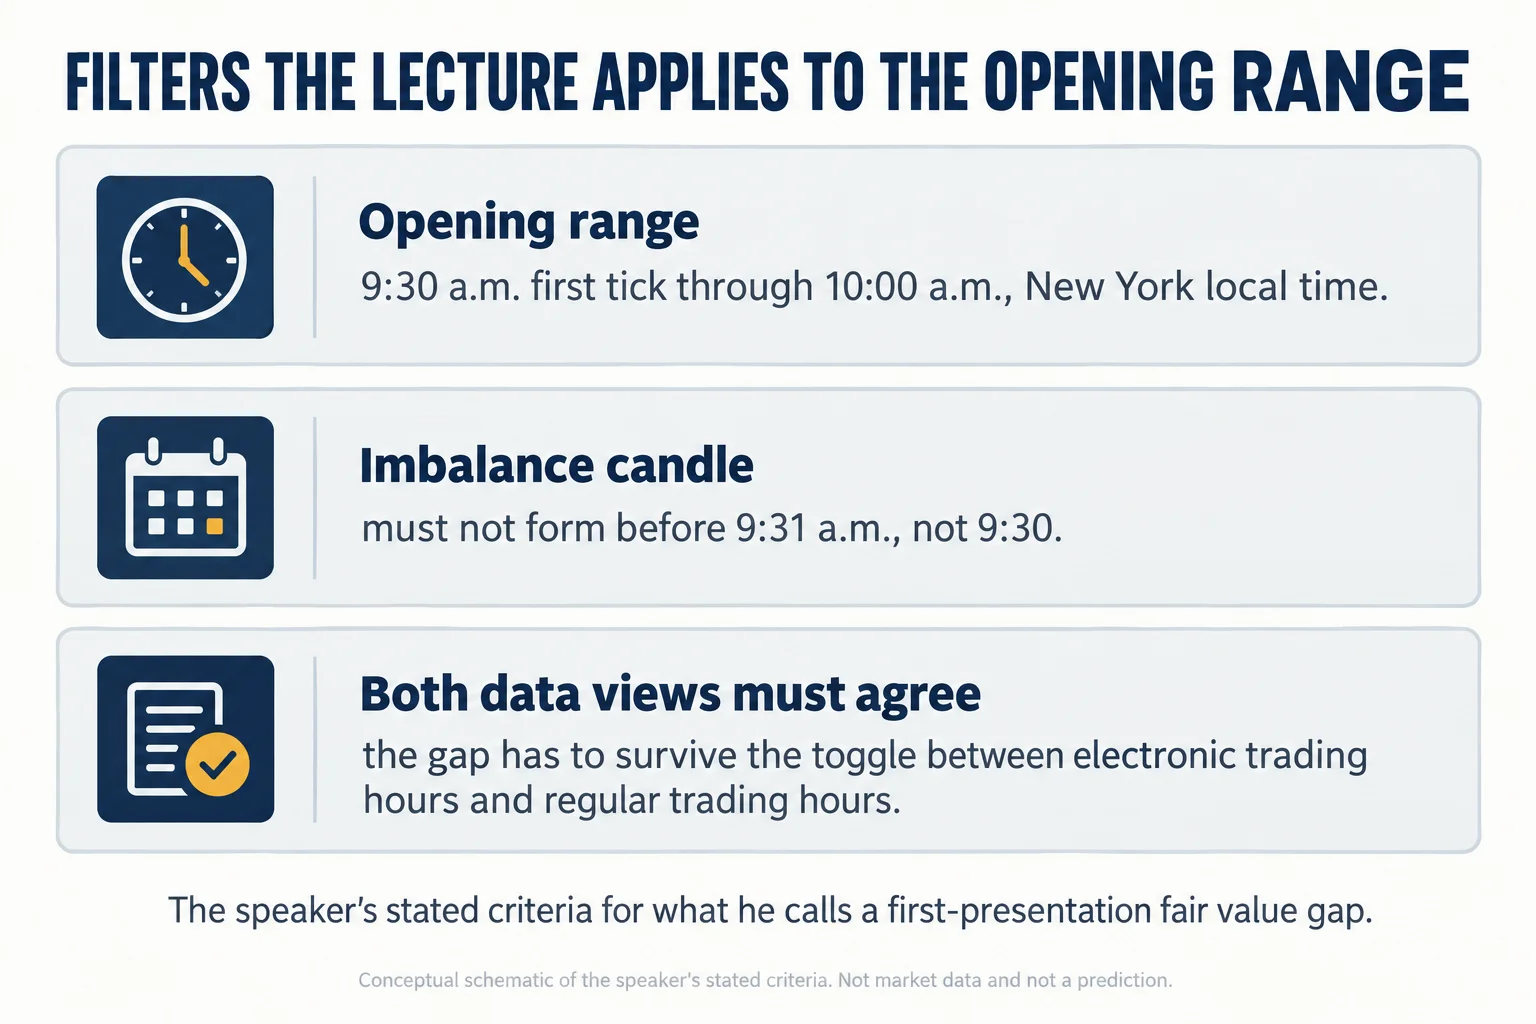
The most concrete exercise in the lecture concerns the 9:30 a.m. New York opening bell. He marks the first tick as the start of the opening range and says the range runs to 10 o’clock (19:41, 19:47).
He then sets a filter. A fair value gap involving the first 9:30 candle may exist while the chart is showing electronic trading hours and disappear when it is toggled to regular trading hours, so he says not to use fair value gaps that begin with the 9:30, 9:31 or 9:32 candles (20:05, 20:29). Returning to the rule later, he states it as a hard floor: the imbalance candle cannot form before 9:31, because the 9:30 candle will not be there in regular trading hours (38:07).
He calls this the first-presentation idea and acknowledges its status in his own words: it is a school of thought he has taught and it is not in the standard books, and he expects others to write about it now that the 2024 mentorship has covered it (37:39). He also warns against over-reading it — not every fair value gap should be treated as a potential inversion just because it is a gap (37:39). His test is consistency across both data views: if the gap does not agree in electronic trading hours and regular trading hours, he says it is not a real fair value gap (38:44). The exercise then is to project the qualifying area across the session and record how price interacts with it (21:05).
Journal ICT opening gaps and the event horizon
He then applies the same 9:30 logic to the day’s opening gap. He measures from the previous session’s close — he says 4:14 or 4:15 p.m. Eastern depending on which sentence is read — to the 9:30 open the next day, and describes the resulting area as the opening range gap (34:01). An open above the prior close is what he calls a premium opening range gap and an open below is a discount one (34:40). His instruction is to measure it as soon as the first tick prints, split it with quadrants and take the midpoint, which he calls consequent encroachment (34:19, 34:51).
One sentence in this section deserves care: he says he taught in this year’s mentorship that “70% of the time” the midpoint of that gap is where price works, and the transcript then continues straight into defining the gap rather than developing the claim (34:26). The figure is reported here as his stated teaching, with no supporting sample, period or measurement behind it visible in the recording.
He also names the part of the gap that has not yet been filled the undelivered portion, and points out that on this session the gap was still partly open (35:25, 35:31).
The event horizon is the other construct he introduces here. He describes nesting: a new day opening gap sitting inside a new week opening gap, which he calls a strong draw (28:57, 29:23). The event horizon itself is measured between opening-gap boundaries with quadrants placed on the distance, and he focuses on the midpoint region (30:05, 30:27). He says either gap type can pair with the other and sets a maximum lookback of 60 days, calling anything older than three months of little interest to him for this purpose (32:34, 32:47). The term is his own analogy and should not be read as a market-standard definition.
What he says happened in the August 23 session
He walks through the session using the concepts above: the opening range printed its own high and low, both the buy side and sell side showed relatively equal levels, and he says his rule in that situation is to wait for the first one to be taken (21:41, 21:53). His reading was that the buy side was taken first, so the run up was a fake move he was content to sit out (22:06). He then describes wanting price to drop and reverse out of a zone rather than stall and build candles, tracks the high into a daily sell-side imbalance from July 23, notes the sweep above the new day opening gap, and says price went on to the mean threshold of a July 22, 2024 bearish daily order block (22:21, 22:45).
He says the first-presentation fair value gap was respected repeatedly through the day, that price sold off into the lunch period, and that the market stopped at the bottom of that gap during the 3:15 to 3:45 final-hour window he calls a macro (40:02, 40:22, 42:27). He reports a trade running back up to a previous new day opening gap and swiping a short-term high before the close (43:45).
Two claims in this section are his own and are not verifiable from the recording. He says the move delivered over 200 handles that he had outlined in advance (41:40), and he says he outlined the day’s high and low beforehand on the August 23, 2024 livestream in front of a large live audience (45:04). Neither the advance call nor any result is shown here, and a spoken recap cannot establish the outcome of a trade.
He also describes the Powell speech as an event where the initial reaction is usually not the real move, and says manual intervention is most likely when a Fed chair is speaking — advice to wait rather than chase (41:47, 41:55). The Federal Reserve’s own published record confirms that Chair Powell spoke on August 23, 2024, at the Kansas City Fed’s Jackson Hole symposium.[3] That corroborates the date and occasion of the event; it says nothing about how the market behaved around it.
Apply the ICT daily chart journal routine
He ends with the part that matters most for study habits. He tells viewers to take copious notes during livestreams, to note the New York local time when he tells them to screenshot something, and to go back and annotate their own charts from that reference rather than working from his (44:02, 44:22, 44:40). He notes that Caleb will not have his charts or annotations and will be forced to do the work the same way (44:54).
He then normalises being wrong early: he says a journal will contain things that later turn out not to matter, and that pruning them is progress because the remaining entries become the salient ones (45:34). His stated starting checklist is first presentation, time of day, new day and new week opening gaps and the opening range gap (45:51), and he closes by telling Caleb that this is now his baseline to work from daily (46:14).
How to study this ICT mentorship lecture 16 honestly
The transportable content here is procedural, and it can be practised without adopting any of the proprietary vocabulary. Capture the screenshots as you see them, write the observation in the moment, keep the pre-session hypothesis separate from anything added afterwards, and review the entry the next day. The lecture is also a fair test of whether the chart toggling actually changes the data you are reading — a student can verify the electronic-versus-regular-hours difference on their own platform rather than taking it on trust, and TradingView’s documentation covers how the ETH option is displayed on intraday charts[1] and how the reduced regular-trading-hours session is defined for CME futures[2].
Two things this recording does not supply are a track record and a control. The levels, the 200-handle figure and the advance call are all reported by the speaker about his own work, and the transcript shows no statement, no order history and no independent record. The instruments discussed are E-mini Nasdaq-100 futures, which CME Group documents as $20 multiplied by the Nasdaq-100 index with a minimum tick of 0.25 index points[4] — a contract size that makes unmanaged risk in these sessions substantial.
Watch the original recording
Watch the original recording on YouTube
This recording cannot be played inside another website. A test run from a BestProps page on 14 September 2026 loaded the YouTube player for this video and the player itself returned “Playback on other websites has been disabled by the video owner”, with no playback position and no media data, so no player is embedded here and no restriction beyond that message is asserted. The full recording is available directly on YouTube.
Reference material for this review
- [1] TradingView Help: I want to access Extended Hours data
- [2] TradingView Help: Regular and Electronic trading hours for CME futures
- [3] Federal Reserve: Speech by Chair Powell on the economic outlook, August 23, 2024
- [4] CME Group: E-mini Nasdaq-100 Futures Contract Specs
BestProps is not affiliated with TradingView, the Federal Reserve, CME Group or the Inner Circle Trader, and no source listed here endorses this article or any setup. Terms such as volume imbalance, balanced price range, displacement, consequent encroachment, opening range gap, event horizon, inversion fair value gap, macro and first presentation are used as descriptive study terms taken from the recording. The date in the video title is August 24, 2024 and the inventory records the upload as the following day; the session reviewed on screen is Friday, August 23, 2024, which is how he refers to it in the recording. Nothing on this page demonstrates a tested, repeatable or profitable result, and any practical application involves substantial risk. This review is educational commentary only and is not investment advice.
