
Key takeaways
The Inner Circle Trader on YouTube reviews a September 2023 Nasdaq futures short from the 1 September non-farm payroll session in a nine minute forty-eight second recording published 3 September 2023.
Read the full summary
The Inner Circle Trader on YouTube reviews a September 2023 Nasdaq futures short from the 1 September non-farm payroll session in a nine minute forty-eight second recording published 3 September 2023. ICT’s TGIF framework expects a roughly 20% to 30% Friday retracement of a bullish weekly range, supported here by a daily midpoint called consequent encroachment, a pre-open run on buy-side liquidity, Nasdaq failing to confirm an S&P higher high in what he calls SMT divergence, and a return to a one-minute fair value gap for entry toward sell-side liquidity. He reports a weekly objective of 15,455, an observed low of 15,454 and a previously posted level of 15,460.25. The claimed live AMP Futures trade used a stop above the midpoint of the longest wick, required rapid downside movement, moved the stop to better than break-even, took no partial exits under his full pull approach and closed below the target area with approximately $15,400 shown on the account. The prices, fills, account status and results are ICT’s unverified claims, the captions are auto-generated, and the example is educational commentary rather than a tested system or investment advice.
How we researched this article
BestProps used document-based research from primary firm sources, checked September 24, 2026. The complete source list, scope, limitations, and commercial-state record appear near the end of this article.
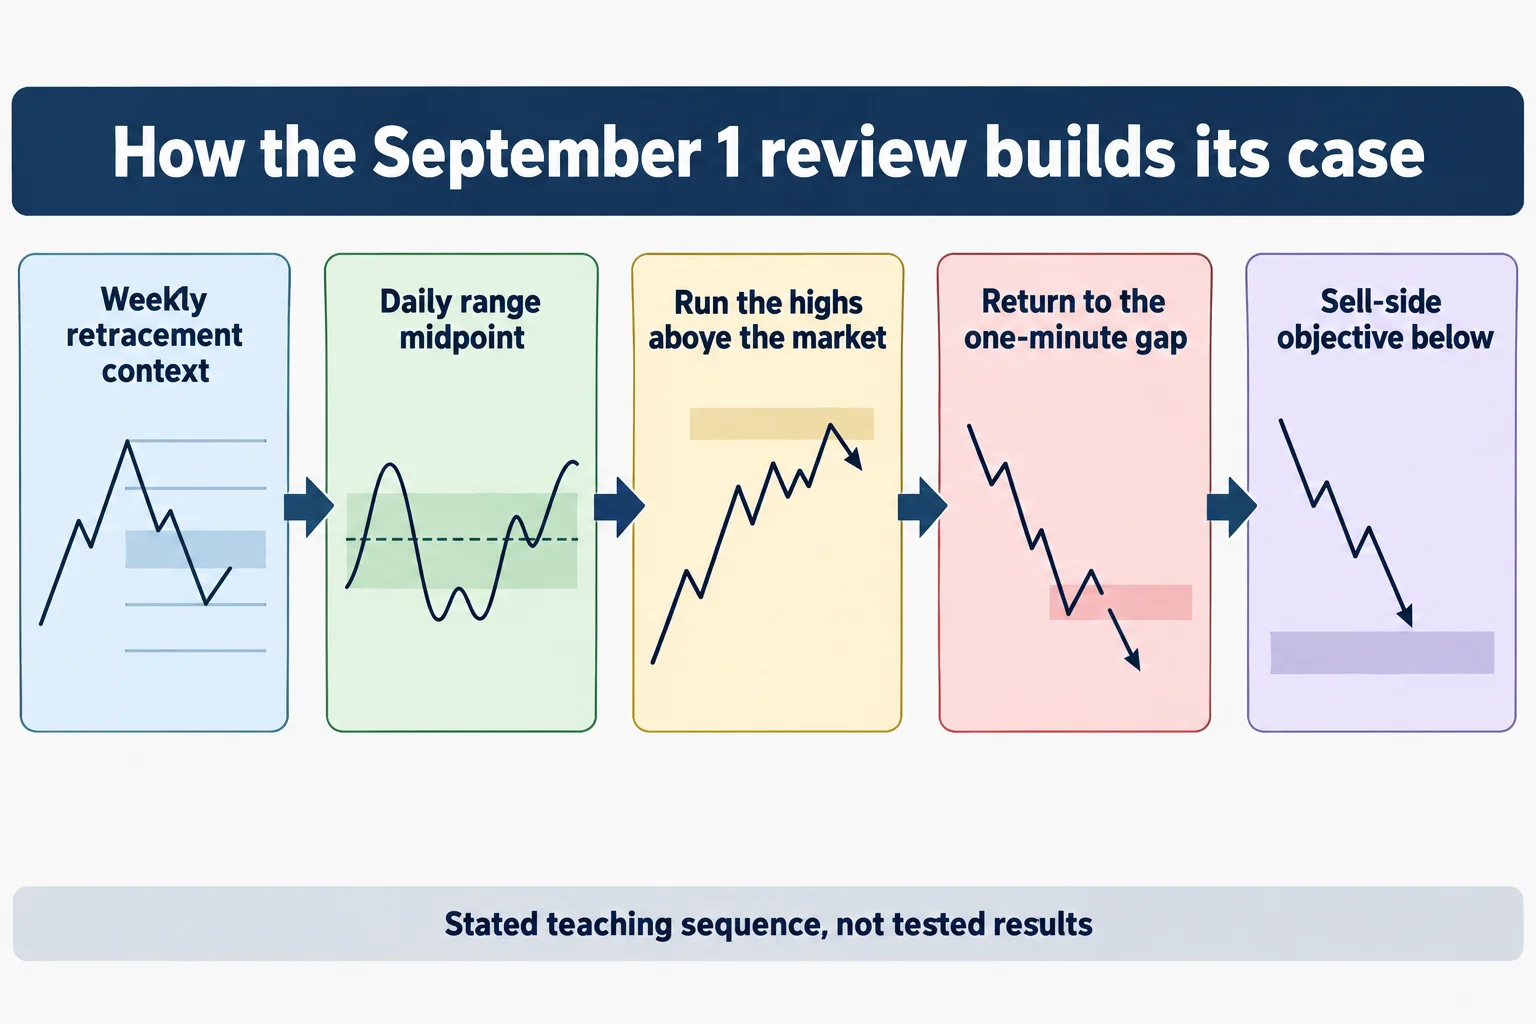
This review explains the lesson presented in “2023 ICT Mentorship – Review Of The Interactive Study 09/01/23 NFP NQ Short”, uploaded 3 September 2023. ICT discusses a Nasdaq futures short associated with the September 1 non-farm payroll session. He first reconstructs his higher-time-frame reasoning and then shows what he describes as a live-account execution.
The central idea is that a bullish weekly move may retrace part of its range late in the week. ICT calls this his “TGIF” setup and combines it with daily and one-minute price structures, liquidity targets and a comparison between Nasdaq and S&P futures. These are ICT’s interpretations of market behavior, not independently established predictive rules.
2023 ICT Mentorship Weekly TGIF Framework
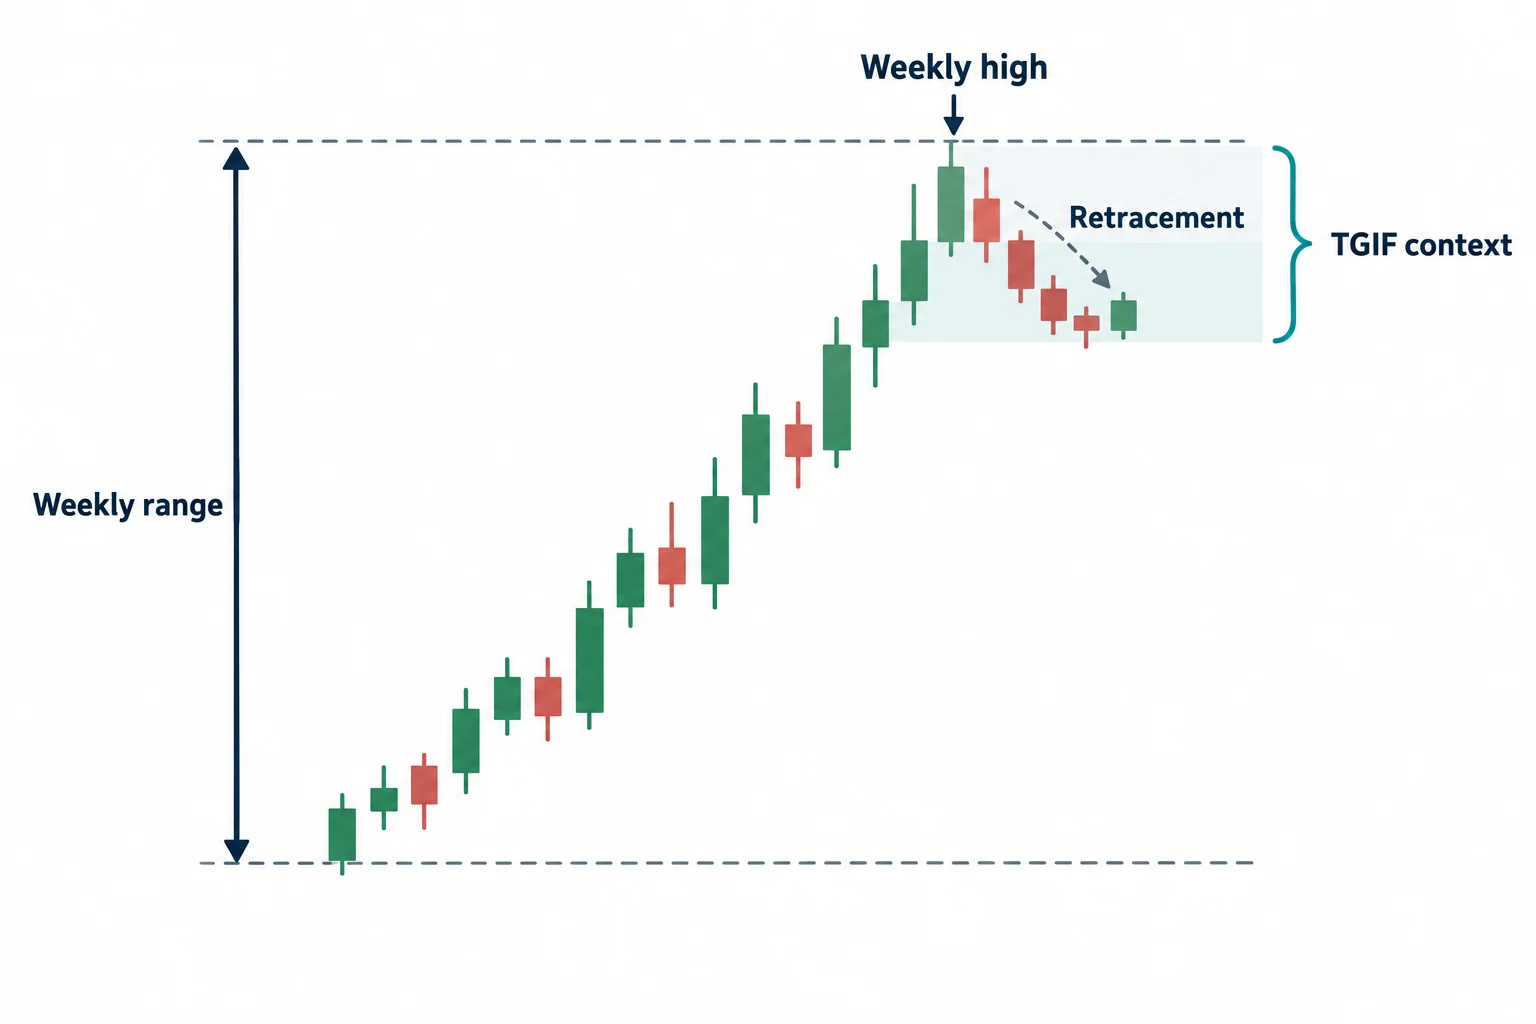
At 0:23, ICT identifies the instrument as the September 2023 Nasdaq futures contract and references weekly and daily charts. He defines the TGIF setup from 0:41 onwards as a retracement of roughly 20% to 30% of the weekly range, and he explains the name at 1:47 as “thank God it’s Friday”: a market that has moved one direction all week and then pulls back into that zone.
His scenario begins with a week that has moved primarily upward. Once he believes a tradable weekly high has formed, he anticipates a pullback into that retracement zone. The concept therefore supplies a directional context rather than a complete entry signal: the speaker still looks for intraday evidence that price is ready to move lower. He also claims a long personal history with the pattern, saying it has served him since 1:06. That is his own account of his own track record and is not something this article can check.
ICT also uses this section to argue against conventional explanations based solely on randomness or buying and selling pressure. Those broader claims are presented as his market philosophy. The transcript does not provide statistical testing that would allow viewers to assess them independently.
ICT Mentorship Daily Structure and Intraday Narrative
Beginning at 2:46, ICT marks a shaded daily-chart range and measures it from one candle’s high to another candle’s low. The auto-generated captions render the name of that range unclearly (they come out as “sell side and balance bison efficiency”), which most plausibly stands for “sell-side imbalance, buy-side inefficiency,” but the captions do not preserve the wording with enough confidence to assert it. What is stated clearly is the measurement itself and the term he gives the midpoint: at 3:00 he calls it consequent encroachment, abbreviated CE, and he notes that the market could trade up to that level.
He then maps that daily reference onto a one-minute chart. His account of the sequence is:
- Pre-opening highs were taken shortly before the stock-market opening bell.
- Price then declined and formed what he labels a fair value gap.
- A later move traded back into that gap before turning lower.
- The decline subsequently moved through lows that he regarded as sell-side liquidity.
At 3:19 he points to the highs that ran just before the opening bell, and at 3:47 he explains why they mattered to him. He interprets highs above the market as “buy-side liquidity,” including stops associated with traders expecting an upside breakout. He mentions trend lines drawn for that purpose and says he is not a fan of that approach. His preferred sequence was for price to run those highs first and then move toward relatively equal lows beneath the market, and he says that is what happened.
At 4:20 he shows price trading back up into the one-minute fair value gap. He is explicit at 4:32 that this stretch of the video is hindsight commentary on his part, and he says he wanted the decline to pass through the larger daily imbalance without respecting it as support and continue toward the lower boundary and sell-side objective.
ICT Mentorship NFP Short Targets
ICT states at 5:30 that his weekly TGIF calculation produced a 15,455 objective. He says the observed low was 15,454, which he describes as one handle below that level and just inside the gap area. He also references 15,460.25 at 6:04 as a price he says he had posted beforehand, and he points to the area just below Thursday’s low.
These figures report what ICT says and what he points to on screen. Captions alone cannot verify the chart’s exact prints, the timing of an external post or whether every marked level was established in advance.
ICT NFP Short Execution and Risk Management
The execution segment starts near 6:25, where he addresses comments asking to see something on a real account rather than paper trading. He says the platform is displaying a live account and identifies AMP Futures as the brokerage firm visible on screen at 6:35. He describes shorting as price returned to the highlighted fair value gap, and he says the account is at a CFTC-regulated US broker.
His narrated trade management includes several distinct decisions:
- He initially places the stop above the longest wick and its midpoint, which he again calls consequent encroachment.
- He looks for rapid downside movement rather than a slow reaction.
- He cites an intermarket divergence: Nasdaq failed to make a higher high while, according to him, the S&P had made one.
- At 8:35, he says he moves the stop to better than break-even.
- He manages the position as a “full pull,” meaning no partial exits between the full entry and full target.
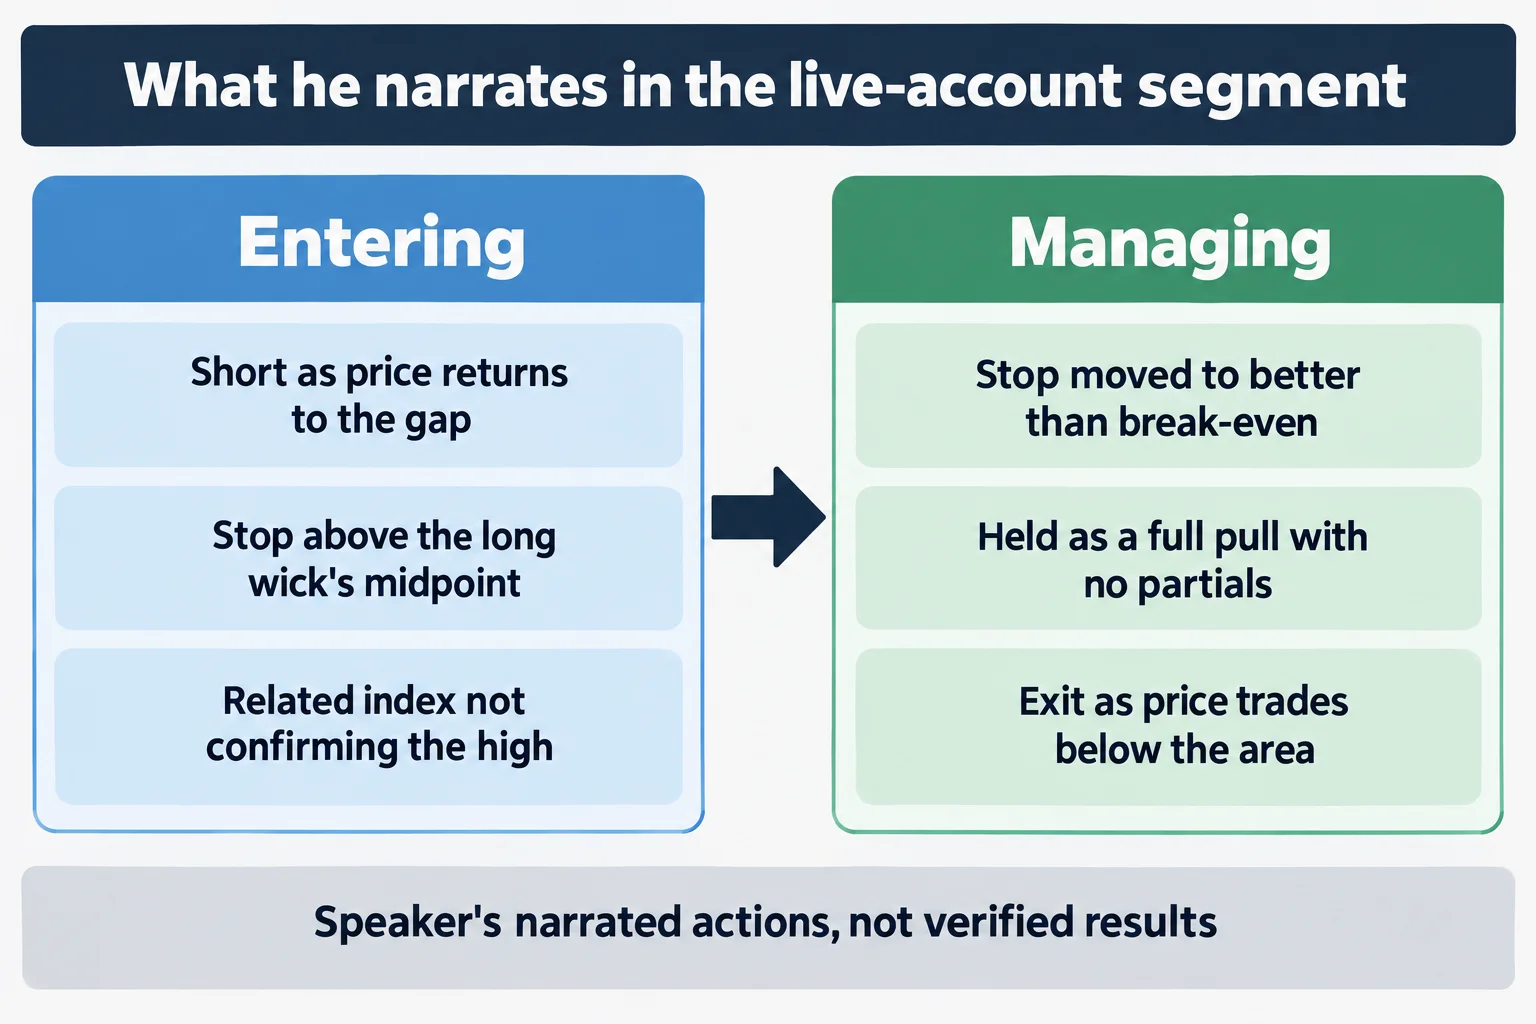
ICT labels the Nasdaq-versus-S&P comparison “SMT divergence” at 7:08. Within his framework, the mismatch supports the bearish thesis because the two related markets were not confirming the same higher-high behavior. The transcript does not establish how often this condition succeeds or define a standalone rule for using it.
He also pre-empts the obvious objection. At 8:08 he says it would be illegal for him to claim a recording was live real-money trading if it were not, and at 7:31 he refers back to a Twitter space he says he held about the setup. Those are statements about the authenticity of the footage, not evidence of it: nothing in the captions verifies the account, the broker connection or the fills.
What the 2023 ICT Mentorship Study Demonstrates
The video’s educational structure moves from broad context to execution: a weekly retracement expectation, a daily price area, a premarket liquidity run, a one-minute fair value gap and an underlying sell-side target. The important point is not any single label but how ICT combines multiple time frames into one narrative.
Near 9:33, ICT says he closes after price trades below the targeted area and reports approximately $15,400 on the account. He then points viewers at other material, including a 2022 model playlist and his TGIF video, saying the components he used were already taught for free. That is his own cross-reference, and this article does not assess those other recordings.
For study purposes, the video can be treated as a worked example of ICT’s own framework. It does not demonstrate that the same setup will recur, that its levels can always be identified in real time or that similar trades will be profitable. Futures trading involves substantial uncertainty, and this summary is educational rather than investment advice.
Watch the 2023 ICT Mentorship NFP Short
Watch the original recording on YouTube
The video cannot be played inside another website. When its embedded player was loaded and clicked from a BestProps page on 15 September 2026, the player itself reported “Video unavailable. Playback on other websites has been disabled by the video owner.” and stayed on a “Watch on YouTube” prompt with no playback progress at all; the public watch page plays normally. That is why no embed is left here.
Watch 2023 ICT Mentorship – Review Of The Interactive Study 09/01/23 NFP NQ Short on YouTube ↗
The recording runs about nine minutes and forty-eight seconds and is the only primary source used for this article. The captions used here were generated automatically by YouTube, so the wording of ICT’s terms is not authoritative. The channel is The Inner Circle Trader on YouTube.
2023 ICT Mentorship Study Resources
These are the sources checked for this article. The CFTC and Investor.gov pages are general regulator and investor-education material, on leveraged foreign-exchange fraud, on trading systems sold online, and on what leverage is. They are not assessments of ICT or of anything said in the recording, and none of them verifies the figures he reports here. Third-party copies, notes and indicator bundles derived from his material circulate outside his own distribution and were not tested here.
- [1] 2023 ICT Mentorship – Review Of The Interactive Study 09/01/23 NFP NQ Short, The Inner Circle Trader (primary source; watch page read 15 September 2026, 9M48S)
- [2] CFTC Learn & Protect, Forex Frauds (read 15 September 2026)
- [3] CFTC, Fraud Advisory: Commodity Trading Systems Sold on the Internet (read 15 September 2026)
- [4] Investor.gov, Glossary: Leverage (read 15 September 2026)
This is independent educational commentary on one market review. It is not official ICT material, it is not a tested trading system, and it is not investment advice. All dollar figures are the speaker’s own spoken review of his own account and are not verified here. Index futures and leveraged trading involve substantial risk and are not suitable for everyone.
