
Key takeaways
In 2023 ICT Mentorship – Opening Range Gap Repricing Macro (0:28), ICT narrates how he says he read one ES session: a preference he says he stated publicly on the morning of Friday, June 23 for the lower of two ES fair value gaps (1:56), a stated draw on price at “43.69 ish, 43.70” (2:30),…
Read the full summary
In 2023 ICT Mentorship – Opening Range Gap Repricing Macro (0:28), ICT narrates how he says he read one ES session: a preference he says he stated publicly on the morning of Friday, June 23 for the lower of two ES fair value gaps (1:56), a stated draw on price at “43.69 ish, 43.70” (2:30), a post-open rally above the midnight New York opening price that he labels a Judas swing (8:49), and a decline he expects to reprice back toward the opening range gap (14:51). He defines the opening range gap as the distance between Friday’s final regular-session close — the 4:14 p.m. one-minute candle, quoted at 4,388 — and the next regular-session open at 9:30 a.m. Monday (10:13 and 10:38). An open below that close is a discount gap, an open above it is a premium gap, the 50 percent midpoint of a gap or wick is consequent encroachment, and the midpoint of an order block is mean threshold (11:05 and 11:23). He also reports the levels he says he shorted and repeats his claim that the same trades would have added $16,000 to a funded or live account (15:44 and 19:20). Every trade, level and outcome in this article is his own account of a recording; none of it is independently verified here, and his own review notes price never reached the 43.70 objective he names (19:37).
How we researched this article
BestProps used document-based research from primary firm sources, checked September 24, 2026. The complete source list, scope, limitations, and commercial-state record appear near the end of this article.
ICT opens by telling viewers to go back and watch the market review for “last Friday, which is June 23rd 2023” (0:28), and says the things he is about to talk about in this recording were forecast before the chart showed them. He then works from a weekly candle chart down through daily, hourly, 15-minute, five-minute and finally one-minute views of ES, the E-mini S&P 500 futures contract. He says the presentation is focused primarily on ES and points to a description link where he says he traded both ES and NASDAQ live that morning.
The article below paraphrases what he says in the recording. It is educational commentary on one speaker’s framework, written from the timestamped captions of that recording, not from independent market data.
The premise he carries into the session
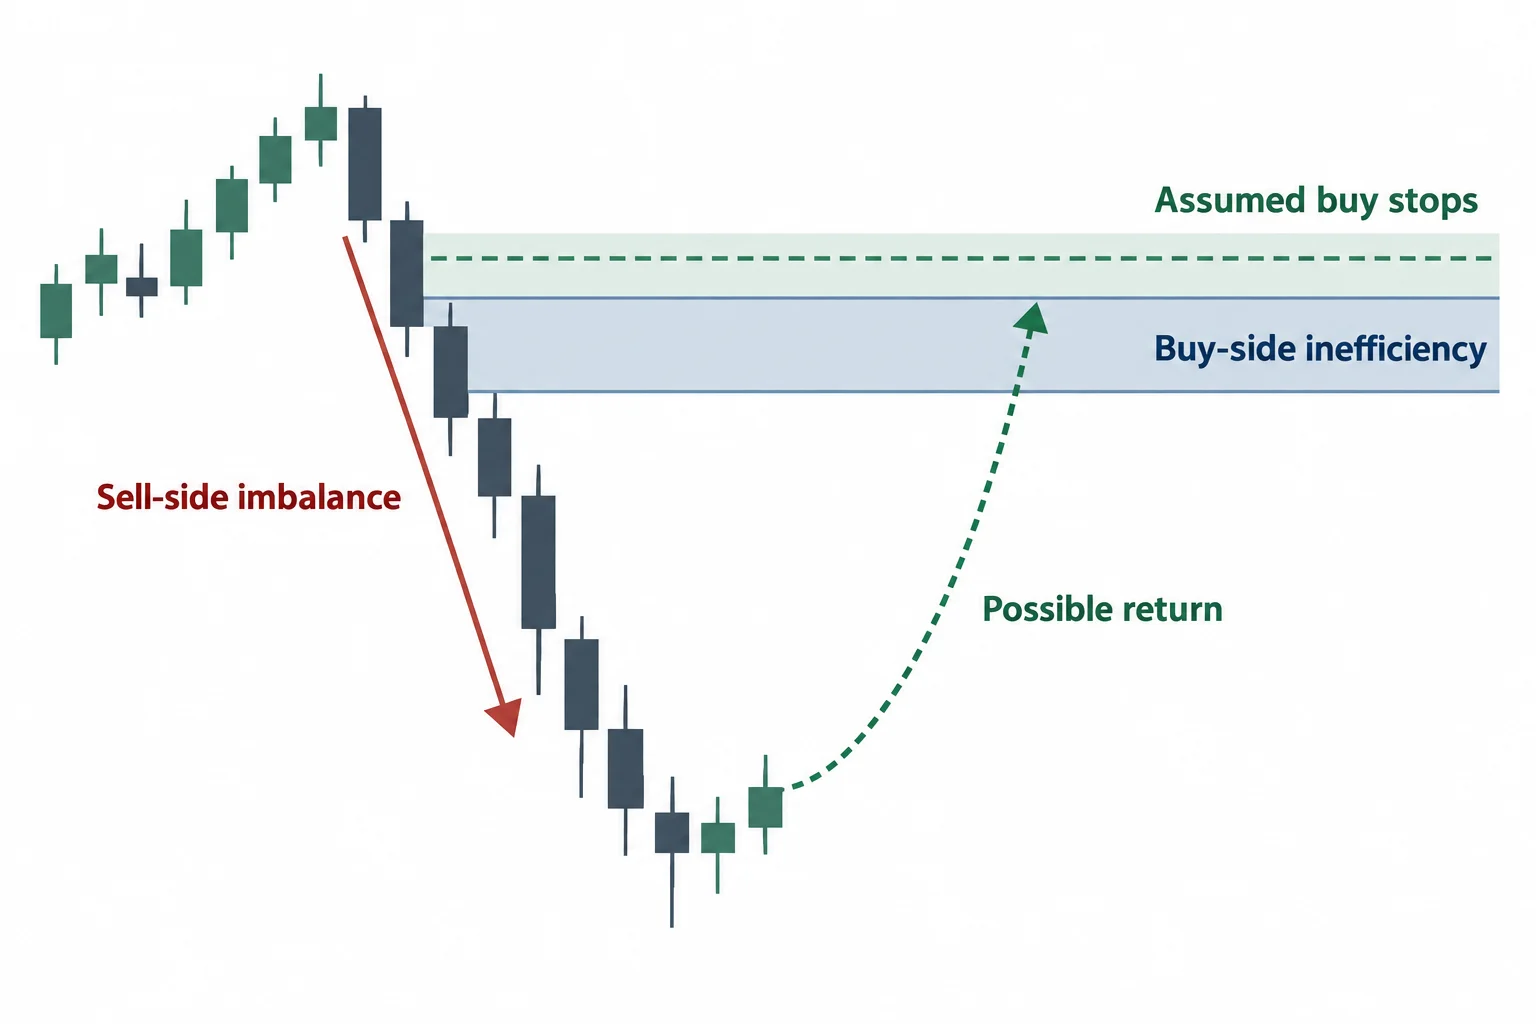
ICT says that in the June 23 review he had shown a slide with a marked zone around “43.69 ish, 43.70” and that price traded down into it (2:30). He also refers to a weekly fair value gap and to the new-week opening gap created when the market reopened after the weekend (3:43 and 7:45). On a 15-minute chart he describes an area he calls a sell-side imbalance with buy-side inefficiency — the part of a down-move he says was not fully repriced — and says that is the kind of area the market will want to draw back up into, with buy stops resting just above it (2:56 and 3:38). He reads all of this as consistent with the lower objective he had already named.
The opening range gap as he defines it
The clearest instructional section starts at 9:39. Working on a one-minute chart with regular trading hours toggled rather than electronic trading hours, he says to hover the last candle on Friday, which he identifies as the 4:14 p.m. candle, and to read the closing price shown for it. For Friday, June 23, 2023 he states that close as 4,388 even (10:13). He then points to the 9:30 a.m. New York opening price for Monday, June 26, 2023 (10:38), and defines the opening range gap as the difference between those two prices (10:44).
He gives the two directions names. When the next session opens below Friday’s close he calls it an opening range gap lower and treats it as a discount; when it opens above Friday’s close he calls it an opening range gap higher and treats it as a premium (11:05). He identifies the session in the recording as an opening range gap lower. He also defines the middle of the gap, and of a wick, as consequent encroachment, and separates that from mean threshold, which he applies to the midpoint of an order block — naming breaker, bullish or bearish order blocks and propulsion blocks as examples (11:23 and 11:36).
How he applies the gap to the one-minute chart
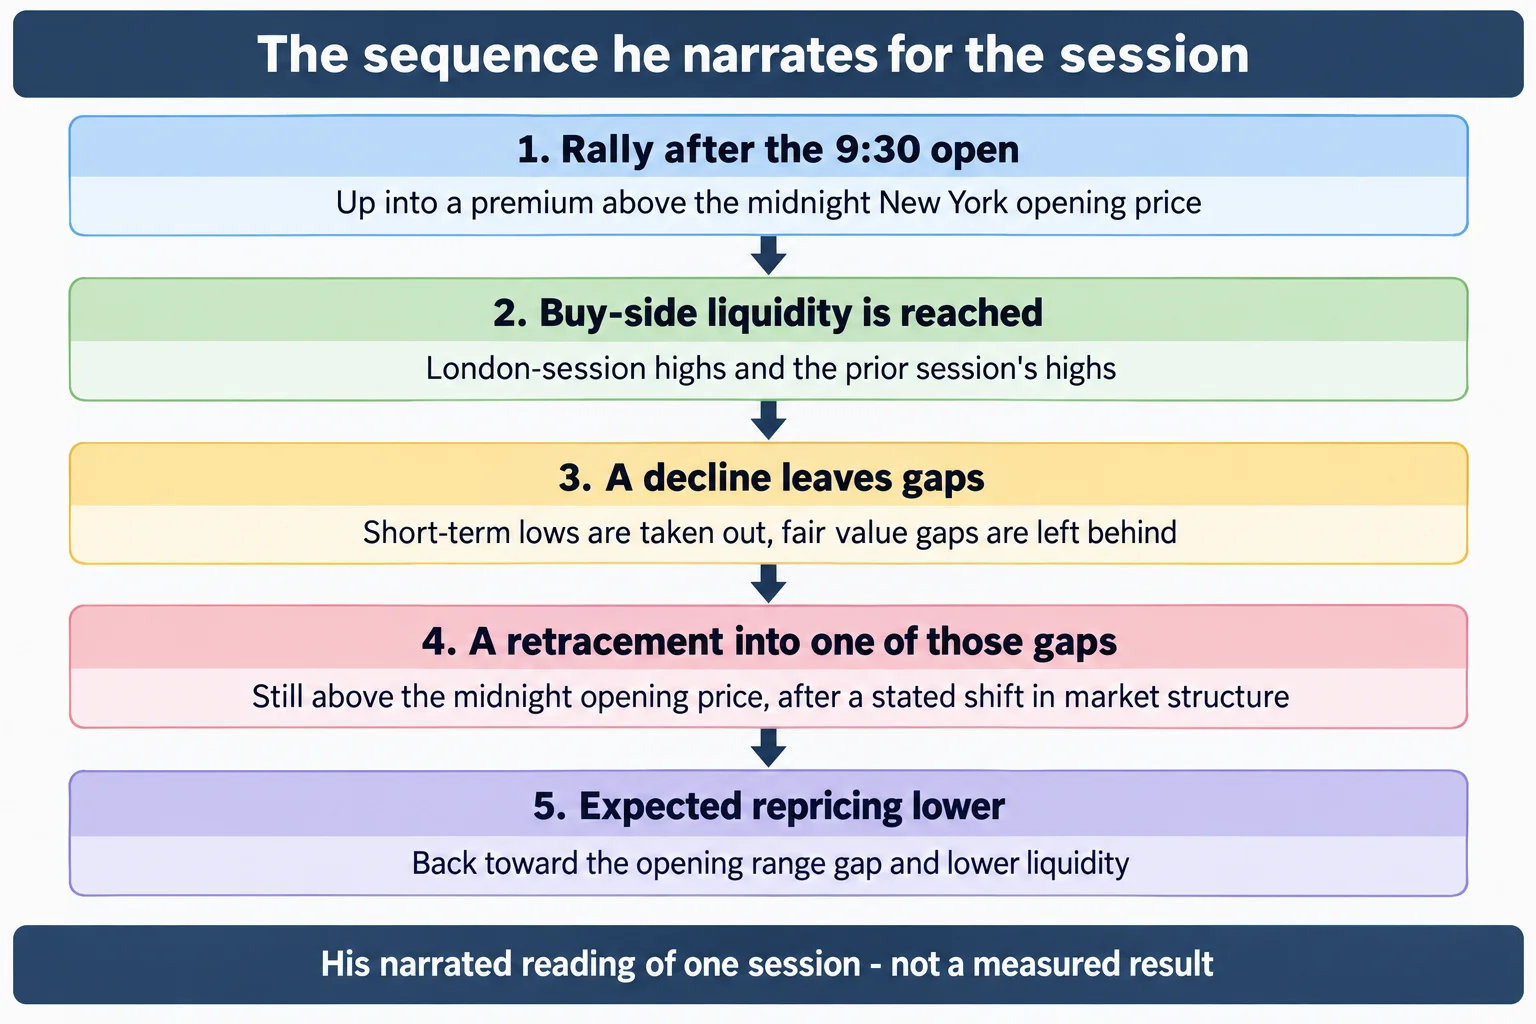
At 11:58 he moves the definition onto a one-minute ES chart for September 2023 delivery and narrates this sequence:
- Price rallies after the 9:30 open and trades up into a premium, above the midnight New York opening price and above the buy-side liquidity he has marked (12:09 and 12:39). He calls the whole run a Judas swing, his term for an initial move that draws traders in before price turns the other way (7:11).
- He says the buy-side liquidity he was aiming at sat at the London-session highs and at Friday’s New York session highs (8:11 and 18:25).
- A more decisive decline takes out short-term lows and leaves fair value gaps behind (12:50), and he describes a shift in market structure that lets him look for an entry even though the earlier low was not taken out (13:14).
- Price retraces back into one of those gaps while still holding above the midnight opening price (17:19). He says he placed his stop using the higher of two nearby fair value gaps, because when there are two gaps he factors in the higher one, and measured consequent encroachment on it for stop placement (14:10 and 13:55).
- He says his objective was a repricing back down into the opening range gap, calling the whole idea a repricing macro, with the discount array below equilibrium as the area he was trading toward (14:51 and 15:13).
He says he used what he calls the simple Silver Bullet rules: take the low to the high, find equilibrium, and look below 50 percent for a discount array (15:05 and 15:13). He describes the position as premium running to discount and says the aim was a run below the new-week opening gap low. This is his stated trade-management logic, reported here because it is what the recording contains, not as a recommendation to reproduce it.
What he reports about the outcome
ICT says he was not able to manage the position because he had things to take care of away from the charts (15:05 and 14:58), so he exited before the full move he had described. He reads out what he says were his executions: “4387 and three quarters, 4387 even” and a short “at six contracts at 43.95 and a half and 43.94 and a half” (15:44) — and says he had also placed a limit order higher up as an additional entry or pyramid rather than as a separate idea. The 43.70 objective he had named on Friday was, by his own account in this review, never reached (19:37).
He also claims that had the same trades been taken on both ES and NASDAQ, which he calls dual dealings, the account “would have gone up sixteen thousand dollars” (19:20). That is an assertion made by the speaker about trades he describes; this article does not verify it, cannot see the account, and presents no performance figure as established fact.
His closing review links the later moves to the opening range gap and to the lunch hour. Around 19:58 he frames the noon highs as buy-side liquidity and the gap area above as a place price could reach into for half of it, and at 20:53 he ties the eventual move down to the 3:15 to 3:45 p.m. market-on-close window, describing price attacking the opposing sell-side liquidity of the lunch hour. He closes by pointing viewers at the description link where he says both the ES and NASDAQ shorts were executed and managed from beginning to end.
What the recording does not establish
This is a narrated case study selected and explained by its creator. The captions are YouTube’s automatic ones, not a checked transcript, and they garble some of his terms: “Judas swing” is rendered as “Juda swing” or “Judith swing”, “consequent encroachment” as “constant encroachment” and once as “consequent encouragement”, and “buy-side” sometimes appears as “by side” or “buy South”. Those were normalised only where the surrounding context is unambiguous. The recording contains no chart images this article can measure: every level, candle reading and structural claim above is his description of charts he was annotating, and the reviewer of this article saw none of them. Nothing here establishes real fills, real account results, why price moved, or how the framework performs over time. His forecast of a draw toward 43.70 was made before the session, which is worth noting, and so is the fact that by his own account the session did not reach it. Anyone studying the lesson should compare the stated times and levels against properly configured historical data and treat retrospective explanation as different from tested evidence. This is educational commentary, not investment advice or a performance promise.
Watch the original recording
2023 ICT Mentorship – Opening Range Gap Repricing Macro
The Inner Circle Trader · published 26 June 2023 · about 23 minutes. This is the primary source for this article; every timestamp link above points into it.
The video is not embedded here because the owner has disabled playback on other websites. That was checked directly on 15 September 2026: the player loads and returns “Playback on other websites has been disabled by the video owner” instead of playing.
The watch page was read on 15 September 2026: playability status OK, not unlisted and not private, 23 minutes 18 seconds long, published 26 June 2023 at 6:55 p.m. Pacific. The inventory used to schedule this article lists the same video under the date 27 June 2023, a UTC calendar day later than the publish timestamp; the two are different dates for the same upload, not a contradiction. Inside the recording he reviews the session of Monday, 26 June 2023 against the prior Friday’s close (10:38). The channel is The Inner Circle Trader on YouTube, which is the first-party record of what it uploads and takes precedence over any reupload or third-party archive.
Resources
These are the sources checked for this article. The regulator and investor-education pages below are general material about system-based and leveraged retail trading; they are not assessments of ICT or of anything said in the recording, and none of them verifies a statement made here. Any ICT, smart-money or third-party indicator, script, note set or transcript circulating outside the publishing channel’s own upload page is unofficial and untested here.
- [1] 2023 ICT Mentorship – Opening Range Gap Repricing Macro — The Inner Circle Trader (primary source; watch page read 15 September 2026, 23M18S)
- [2] The Inner Circle Trader — official YouTube channel (read 15 September 2026)
- [3] CFTC — Fraud Advisory: Commodity Trading Systems Sold on the Internet (read 15 September 2026)
- [4] CFTC Learn & Protect — Forex Frauds (read 15 September 2026)
- [5] Investor.gov — Glossary: Leverage (read 15 September 2026)
This is independent educational commentary on one speaker’s framework and his review of one session. It is not official ICT material, it is not a tested trading system and it is not investment advice. Any profit figure mentioned is the speaker’s own claim about trades he describes and is not verified here. Leveraged index and foreign-exchange trading involves substantial risk and is not suitable for everyone.
