
Key takeaways
In NWOG – New Week Opening Gap Part 2, ICT defines the New Week Opening Gap as the separation between the previous Friday’s final closing price and the Sunday opening price of the new week, the first tick when the market reopens at 6:00 p.m.
Read the full summary
In NWOG – New Week Opening Gap Part 2, ICT defines the New Week Opening Gap as the separation between the previous Friday’s final closing price and the Sunday opening price of the new week, the first tick when the market reopens at 6:00 p.m. New York local time (2:32 and 5:28). Whichever of the two prices is higher becomes the gap high and the other the gap low, so the labels swap when the open sits above the prior close (5:38). He extends both boundaries forward for weeks and treats the gaps as magnets or mile markers rather than predictions, reads a sudden move away as a trending signature (8:50), and reads price returning to the current gap, especially with several older gaps clustered nearby, as a consolidation signature (10:44 and 11:29). He counsels developing students to run at least five gaps and says his own process uses a 60-day look-back and 60-day cast-forward (18:48 and 18:25). He also says the gaps are not meant to be used on their own, and the recording gives no thresholds, entries, exits, invalidation or risk rules. Every chart description below is his own narration of charts he was annotating on screen, and captions cannot confirm a level, a fill or a result.
How we researched this article
BestProps used document-based research from primary firm sources, checked September 24, 2026. The complete source list, scope, limitations, and commercial-state record appear near the end of this article.
Roughly the first two minutes frame the agenda, then the lesson runs in three parts: how the gap is constructed, what a trend and a consolidation signature look like around it, and how many gaps to keep on a chart. It is the second part of the series and he says so at the start (0:12).
Why he starts from opening and closing prices
His opening argument is that the New Week Opening Gap is not a drawn level but a by-product of two prices that he says are not random events. He contrasts it with buying support and shorting resistance, including horizontal and diagonal trend lines, which he says he is not a fan of, and says he is looking for the root cause underneath the marketplace instead (0:41, 0:52 and 1:14).
He then names the price he treats as significant: the first tick when the new week opens at 6 p.m. New York local time, which he says can be watched being respected through the rest of the week and in the weeks and months afterwards (2:40 and 2:49). He draws a parallel with the floor trader’s pivot numbers he says he used habitually before abandoning them: like pivot levels, or like an old high where buy stops sit on the other side, the gap can act as a magnet for price (2:01 and 2:08).
He is recording on Sunday 7 May 2023 and points out that the current week’s opening price has not printed yet — it arrives at 6 p.m. that evening. He says he will extend that single opening price through the current trading week, while the whole gap range, high and low, gets projected forward for many weeks (3:17 and 3:31).
How the New Week Opening Gap is built
Watch the original lesson on YouTube
The video cannot be played inside another website. The embedded player for this recording was loaded and clicked on 15 September 2026: it reported “Video unavailable” and “Playback on other websites has been disabled by the video owner”, with no duration and no playback progress, at both desktop and mobile widths. The recording’s own watch-page data agrees that embedding is unavailable, so no embed is placed here. The lesson is public and playable directly on YouTube.
He works the construction through a historical example, the week of 5 March 2023. He marks the Sunday opening price first, then the Friday closing price before it — 3 March 2023 — and says the separation between those two points is the New Week Opening Gap (5:00, 5:07 and 5:28).
The labelling is mechanical rather than discretionary. In that example Friday’s close was above the Sunday open, so he calls the Friday close the gap high and the Sunday open the gap low; if the week had opened above the prior close, he says the two labels would simply be reversed (5:38 and 6:02). Worth noting for anyone new to the series: the gap is a range with two boundaries, not one horizontal line, which is why he keeps extending both of them (6:16).
He then follows that March gap forward. Once extended, he describes price treating it as resistance, pulling away, rallying back through, returning to it twice, trading below a short-term low and then gravitating back and forth around the same gap while continuing to respect it (6:39 and 7:21). His read of that behaviour is the core of the lesson: the gap is a fair value function in price delivery, it is “not a random event” in his framing but engineered, and he says it gets used as an old reference point through the coming week, the coming month and several months beyond (8:12 and 8:18).
His trending signature
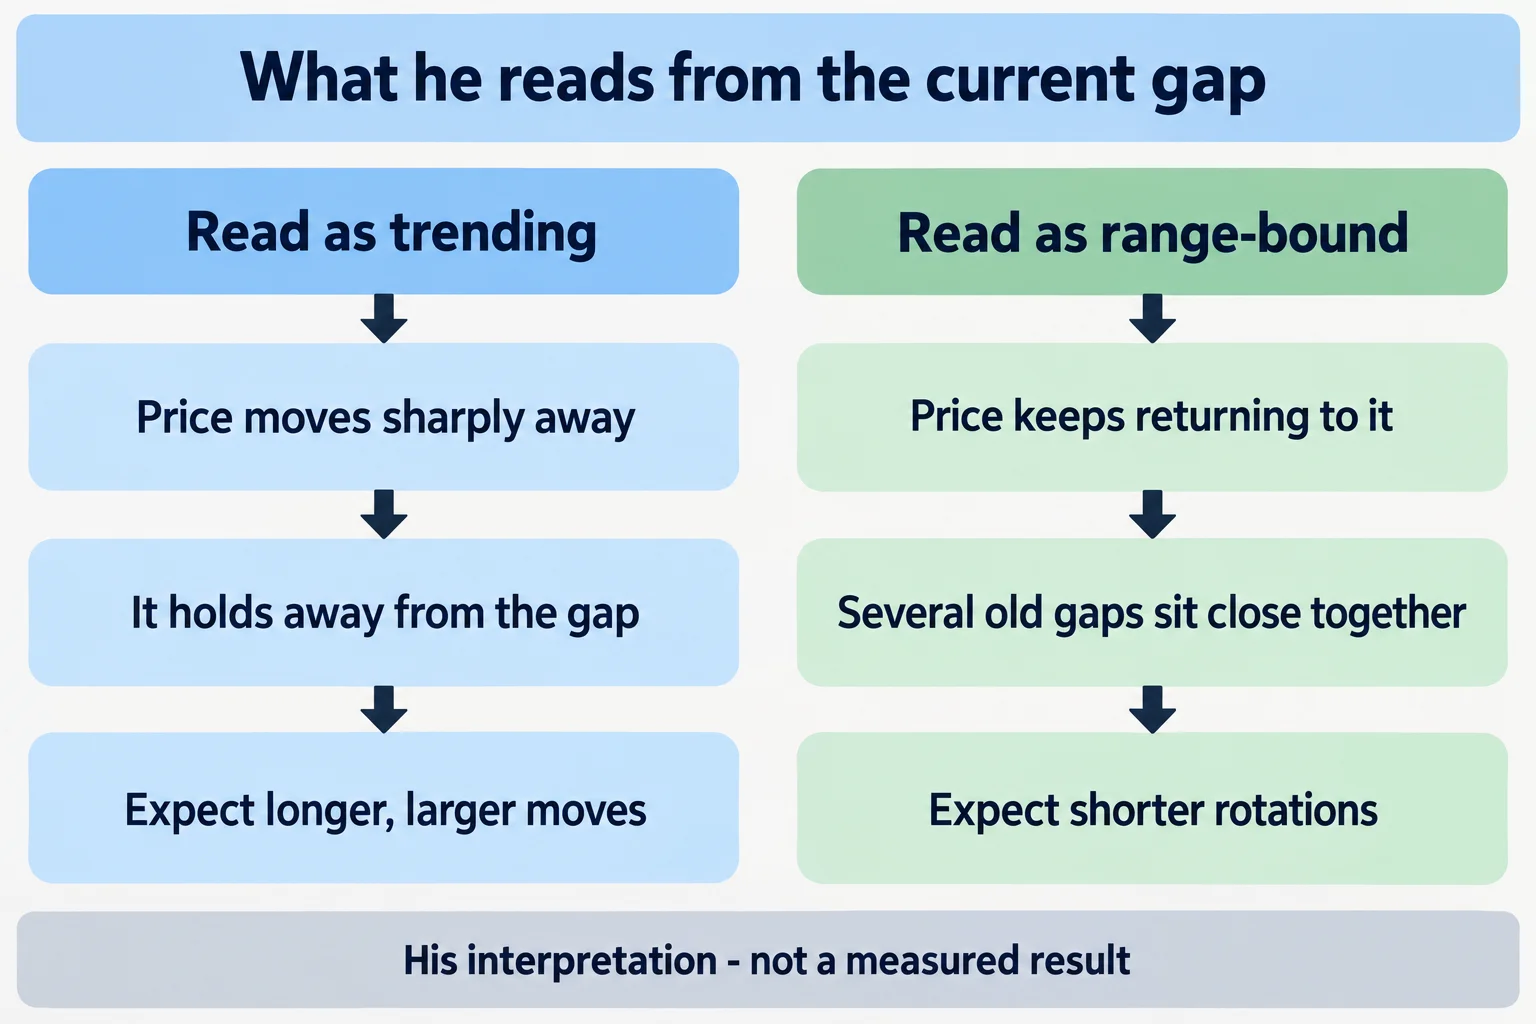
The first of the two signatures he offers is a sharp departure. When price extends time inside the current gap and then runs aggressively away from it, he reads that sudden move as an indication that the market is entering a trending condition (9:20 and 9:25).
What he says that buys the analyst is a change of expectation: if price is willing to move sharply away from the gap, the market can move for longer and with more magnitude rather than producing a small scalper’s consolidation. He calls the gap a way of getting an x-ray view behind price (9:52 and 10:17). One honest limit applies to the whole section: the recording supplies no threshold for how large or how fast a move has to be before he would call it aggressive. That judgement stays subjective, and he does not claim otherwise.
His consolidation signature
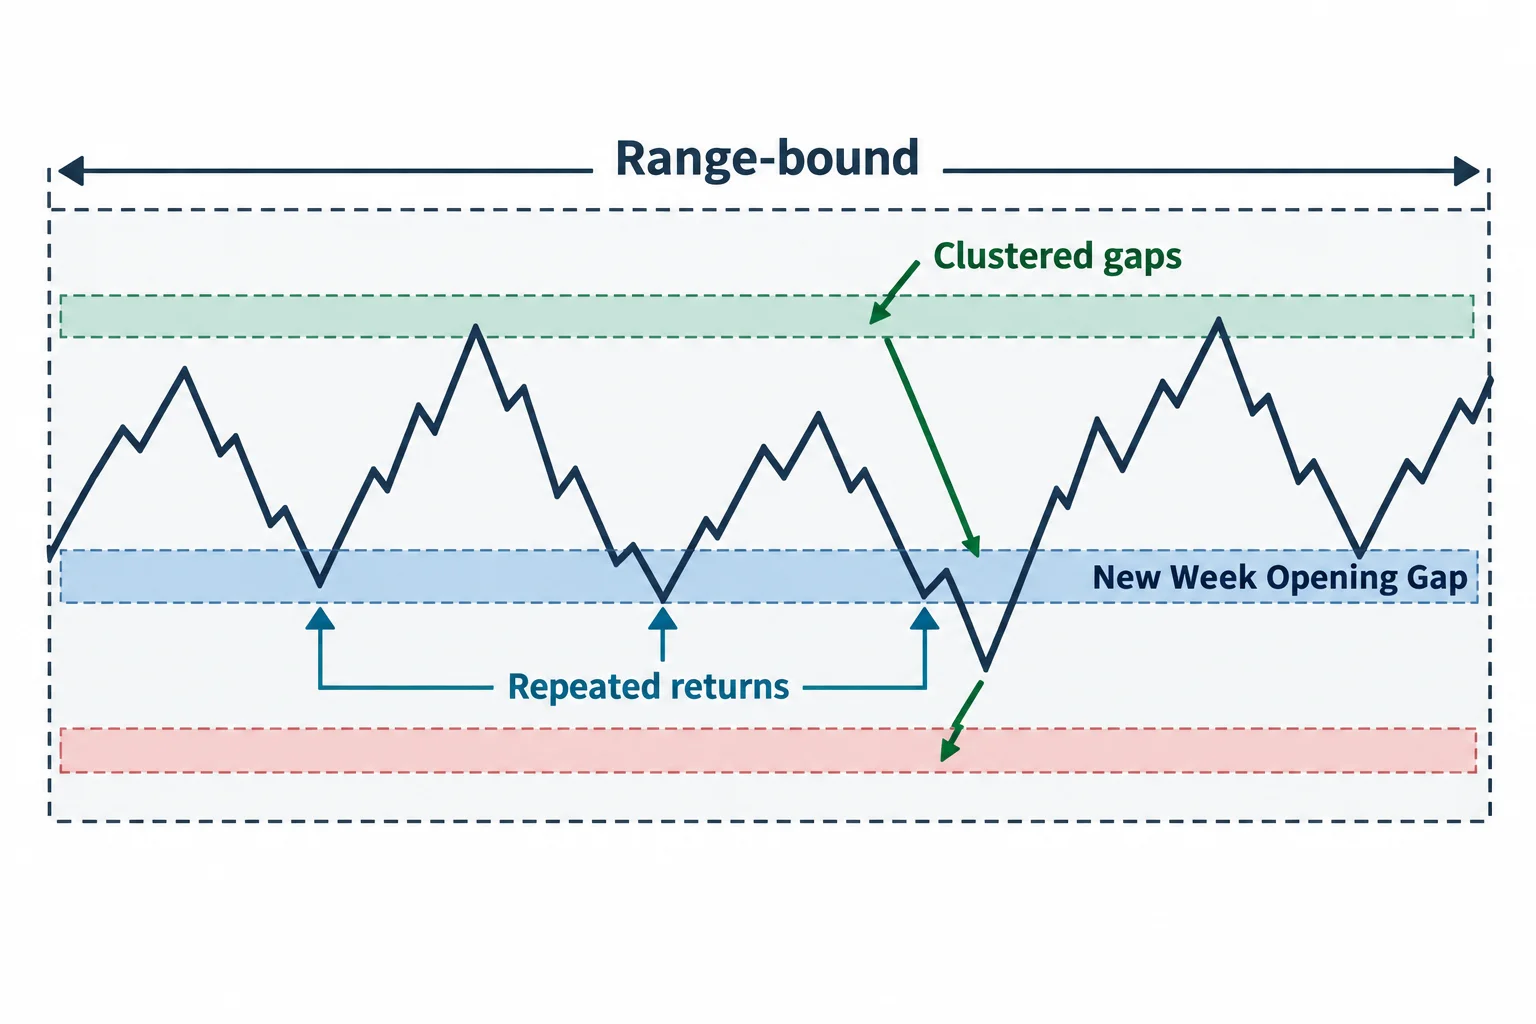
The mirror image is an unwillingness to leave. He defines the “current” New Week Opening Gap as the separation between Sunday’s open and the previous week’s Friday close, and says that if price keeps coming right back to it instead of moving away, he expects a range-bound market where a trader has to be a scalper, more nimble, and should not expect to trend (10:49 and 11:10).
He adds a second condition to that read: a multitude of New Week Opening Gaps converging inside the same range. Walking through an April example, he names a gap high, a gap low and another gap high, and uses a shaded rectangle to make the separations between three gaps visible in one chart window (11:29 and 11:36). His stated purpose is planning rather than prediction: clustered gaps let him tell students in advance that the market is likely to be range-bound rather than a big moving market (12:46).
He is explicit that range-bound is not the same as quiet. He says he is still looking for highs and lows to be violated and pulled back toward the middle of the shaded area, that declines keep drawing back inside the current gap and rallies keep coming back down into it, and that if price leaves the cluster it is likely to travel toward the other gaps sitting in close proximity (13:10 and 13:33).
The most important qualification in the lesson comes at the end of this section. He says you do not simply look at the gaps and conclude that price is going there; they have to be combined with the other factors he has taught on the channel and in the 2022 mentorship model, and it is the blend that gives a better understanding of where price is likely to draw to (13:53 and 13:59).
The May 5 non-farm-payroll walkthrough
He applies the framework to a then-current chart of the 5 May 2023 non-farm-payroll session. He describes old lows where sell-side liquidity would sit, price trading below both of them, and price also trading into an area he calls a fair value gap on the daily chart — an area he says he had flagged in commentary ahead of the release — after which price gyrates around the New Week Opening Gap built from the March 3 close and March 5 open, two months earlier (14:40 and 14:53).
He then reads the candles against that old gap, pointing to the closing price on a candle and to bodies stacking above the high of the March 3 gap, before price moves higher, comes back, rallies toward the nearest gap above and then traces to the one beyond it (16:07, 16:13 and 16:31). From that he offers a rule for the notes: when price is likely to move higher between two gaps, the halfway point between them is the level to watch, and if price can reach that far it will probably reach through the next gap in the series he keeps on his chart (16:51 and 16:57).
His own summary of what the gaps are for is worth quoting as a limitation rather than a promise: they can be mile markers or ultimate targets, and a mile marker only means price is reaching for that one first and then seeing whether it can reach the next (16:40). Nothing in the recording establishes that any of these levels was reached, traded or filled.
How many gaps he keeps on a chart
He answers the practical question directly. Whatever today is, he looks back 60 days, and every New Week Opening Gap formed in that window stays on his charts — that is the maximum he carries. He names the concept behind it as the 60-day look-back and 60-day cast-forward from his IPDA data range material in month five of his core content, and adds that many of his paid students discounted the idea when it was first taught (18:02, 18:25 and 19:08).
For beginners he gives a smaller number: at least five gaps, which he says are the most salient ones while someone is still developing, with the 60-day window as the level to grow into (18:48 and 18:57). His chart-management suggestion is a separate chart template labelled for New Week Opening Gaps so the levels can be referred to constantly, and he frames the look-back as a filter on his wider analysis: how much data he is using and which PD array he still treats as valid (13:43 and 19:26).
One point here is worth separating from the rest because it is a claim about methodology rather than a chart reading. He says a fair value gap 60 days old is still valid to him even if price has already traded back and “filled” it, because he does not consider the algorithm finished with a level once it has been revisited; he attributes that to the time element incorporated in price delivery (19:38, 19:43 and 19:58). That is his stated belief about how price is generated, offered without evidence in the recording, and it is reported here as his position rather than as a tested result.
On the transcript used here
This article was written from the recording’s own automatic English captions, which are machine-generated and not human-checked. They misrender his terms of art in several places, including “new leak opening gap” for New Week Opening Gap, “new weak opening gaps”, “Newegg opening cap”, “ipta data range” for IPDA data range, and “Affair Vega” for the inefficiency he calls a fair value gap. Where the intended term is unambiguous from the surrounding sentences it has been normalised. The caption track establishes what he said; it cannot establish a chart level, a candle, a fill or an outcome, so every market description above is attributed to him, and the reviewer did not watch the video frames.
Resources
These are the sources checked for this article. The regulator pages below are general investor-education and fraud-warning material about leveraged retail trading and about performance claims; they are not assessments of ICT, of this recording, or of anything said in it, and none of them verifies a statement made here. Any ICT, smart-money or third-party indicator, script, note set or transcript circulating outside the publisher’s own channel is unofficial and untested here.
- [1] NWOG – New Week Opening Gap Part 2 — The Inner Circle Trader (primary source; watch page read 15 September 2026, 1,210 seconds, published 7 May 2023 at 3:18 p.m. Pacific)
- [2] The Inner Circle Trader — official YouTube channel (read 15 September 2026)
- [3] YouTube Help — Embed videos & playlists (read 15 September 2026; the platform documentation relevant to the disabled-embedding notice above)
- [4] CFTC Learn & Protect — Forex Frauds (read 15 September 2026)
- [5] CFTC — Fraud Advisory: Commodity Trading Systems Sold on the Internet (read 15 September 2026)
This is independent educational commentary on one speaker’s framework and on his own reading of his own charts. It is not official ICT material, it is not a tested trading system, it is not investment advice and it is not a claim that any result can be reproduced. Leveraged futures and foreign-exchange trading involve substantial risk, most retail foreign-exchange traders lose money over time according to the regulator’s published data, and past or hypothetical performance does not indicate future results.
