
Key takeaways
ICT’s sixteen-minute NWOG lesson defines the New Week Opening Gap as the untraded interval between the previous Friday session close and Sunday’s opening price, measured on a one- or five-minute chart rather than a daily candle.
Read the full summary
ICT’s sixteen-minute NWOG lesson defines the New Week Opening Gap as the untraded interval between the previous Friday session close and Sunday’s opening price, measured on a one- or five-minute chart rather than a daily candle. Mark the Friday close, shown as four fifty-nine p.m. Eastern, and Sunday open, shown as six p.m. Eastern, extend horizontal rays, use a Fibonacci tool to record the 50% midpoint as consequent encroachment, optionally divide each half into quarters, label the gap by its Sunday date and retain at least four gaps, preferably five, for roughly a rolling 30-day lookback even after price crosses them. The examples cover 5, 12, 19 and 26 February and 5 March 2023, while ICT’s template tracks Nasdaq, ES, Dow, the dollar, EUR/USD and GBP/USD. The separate NWOG Actual template measures Friday close to Sunday open, while the alternate ES homework template measures Friday close to the Monday nine thirty a.m. open and excludes Sunday trading. ICT describes price remaining near or repeatedly returning to a gap as range-bound consolidation and departure without return as range expansion, but provides no mechanical thresholds, entry, risk rule, target, price level, trade result or performance test.
How we researched this article
BestProps used document-based research from primary firm sources, checked September 24, 2026. The complete source list, scope, limitations, and commercial-state record appear near the end of this article.
This is a teaching video rather than a trade recap: he works through his own annotated charts and explains how each level is built, labelled and stored. He says the recording is being made on 8 March 2023 (3:55), and the public watch page lists the upload at 8 March 2023, 4:46 p.m. Pacific, which is 9 March in UTC, the date carried by the scheduling inventory used for this article. The examples in the lecture itself run from 5 February to 5 March 2023.
What Is an ICT NWOG New Week Opening Gap?
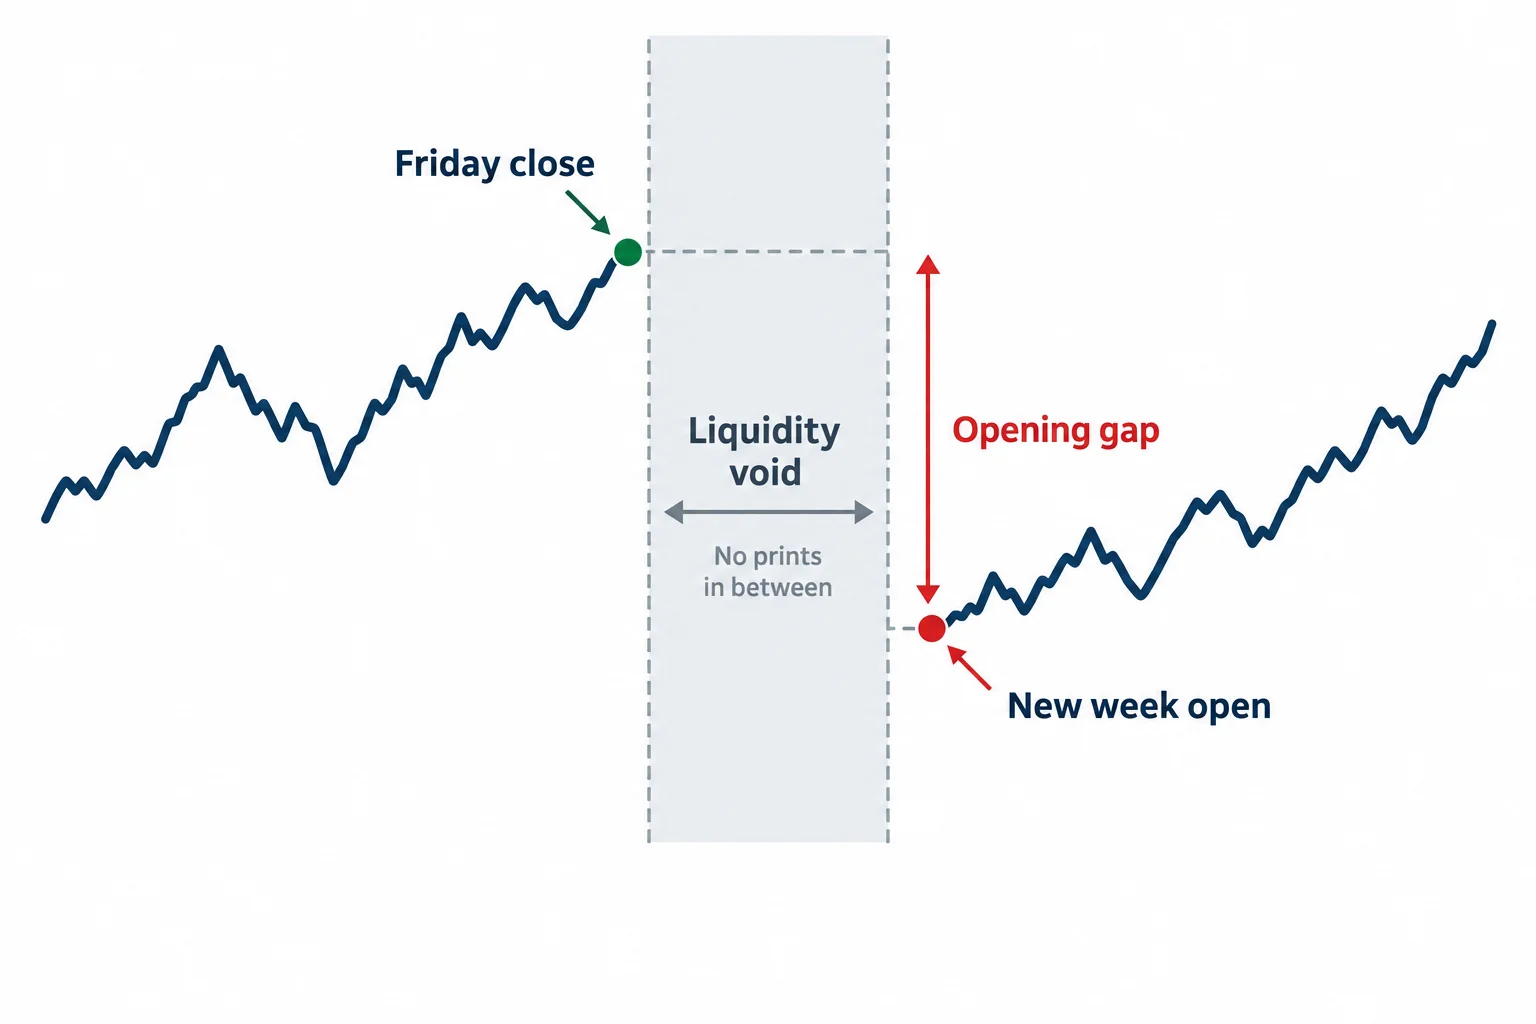
He gives the abbreviation at 0:08 and takes his first worked example from the gap for Sunday 5 February 2023 (0:36). The construction is two prices rather than a pattern: the closing price of the previous Friday session and the opening price of the new week (0:57 and 1:03).
One practical detail drives the whole method. He says not to take those two prices off a daily candle, because the daily chart may use a settlement price that does not line up with the session prices he wants to measure, and to use a one- or five-minute chart instead (0:42).
Where the two prices differ, he describes the interval between them as a real liquidity void (a stretch with no printed buying and selling at all) rather than the kind of gap traders are taught to expect will fill and then be discarded (3:06, 3:19 and 3:25). He is explicit that he did not invent the fact that there is a gap on Sunday (2:37); what he is proposing is how the interval is treated after price has repriced into it and moved away, including a return “weeks ago, a month ago or more” later (3:39).
A chart is meant to hold more than the current week’s gap. He asks for at least four of them, says he prefers five (4:17 and 11:01), and describes that set as a rolling thirty days or roughly a month of lookback (11:04). Earlier in the same lecture he puts his own floor at a minimum of five weeks’ worth (3:49), so the stated minimum moves between four and five as he talks.
How to Mark the ICT NWOG Gap
The annotation starts with a horizontal ray. His description is a short trend line anchored to one price and projected to the right (6:03). In the worked example he anchors it to the Friday close at 4:59 p.m. Eastern and marks the Sunday open at 6:00 p.m. Eastern as the second reference (6:12 and 6:23).
He then measures the interval with a Fibonacci tool anchored from the Friday close to the Sunday open (if the Sunday open is lower, the tool is dragged down to it) and the 50% level is consequent encroachment (6:39, 6:45 and 6:55). He draws the comparison with order blocks, where the equivalent midpoint is called mean threshold (7:02).
Quarters are optional. He describes splitting the gap into quarters by taking the midpoint between the high and the 50% level, and the midpoint between the 50% level and the low (9:29, 9:32 and 9:54), then says he usually keeps the extra lines off his charts and estimates those levels visually instead (10:05). For keeping track of which gap is which, he suggests labelling the ray with the actual Sunday date so older levels stay identifiable at the right edge of the chart (7:34).
Caption quality is worth knowing about here, because the automatic captions mangle his terminology. “Consequent encroachment” comes through as “consequent encouragement”, “consequent encroaching” and even “customer encouragement” (2:08, 9:26 and 11:59), “old inefficiencies” appears as “Odin efficiencies” (3:01), and “new week opening gaps” as “new equipment and gaps” (9:57). Those are transcription errors, not alternative terms.
ICT NWOG Weekly Gaps Used in the Lesson
The chart in the demonstration is a one-minute chart (5:00). He builds the level for each week in turn: 5 February 2023 (0:36), 12 February 2023 (1:52), 19 February 2023 (4:55), 26 February 2023 (9:12) and 5 March 2023 (10:28). In the earliest example he notes that price traded from the open straight back up into the gap, says that is normal rather than a reason to cross the level off (5:29), and contrasts his approach with the common habit of treating a filled gap as over and done with (5:39 and 5:45).
Why Older ICT NWOG Gaps Stay on the Chart
The reason he keeps them is stated in his own terms: he uses the gaps as a measure of large-fund fair value, and describes price gyrating between one level and the next rather than only respecting the current week’s gap (2:22, 11:27 and 11:36). In the chart examples he reads some levels as resistance, some as support, and points out price returning to progressively older gaps (10:52, 10:58 and 11:41).
That reading is his interpretation of the charts he was looking at, not a tested result. A level like this can be revisited, crossed or ignored, and nothing in the recording is a controlled test of how often price returns to an old gap or what happens when it does. The same caution applies to the storage workflow he describes: the lecture shows the routine he follows, not evidence that following it produces a particular outcome.
That routine is small. He keeps a chart template holding the gaps for Nasdaq, ES, the Dow and the dollar, plus the EUR/USD and GBP/USD pairs he trades (13:37 and 13:50). On Friday, once the market closes or in the evening, he anchors a ray to the closing price (13:56); when Sunday’s first tick prints he takes that opening price (14:10), measures the difference and annotates the consequent-encroachment level (14:14 and 14:16), then saves the template (14:30).
How ICT NWOG Gaps Show Consolidation and Expansion
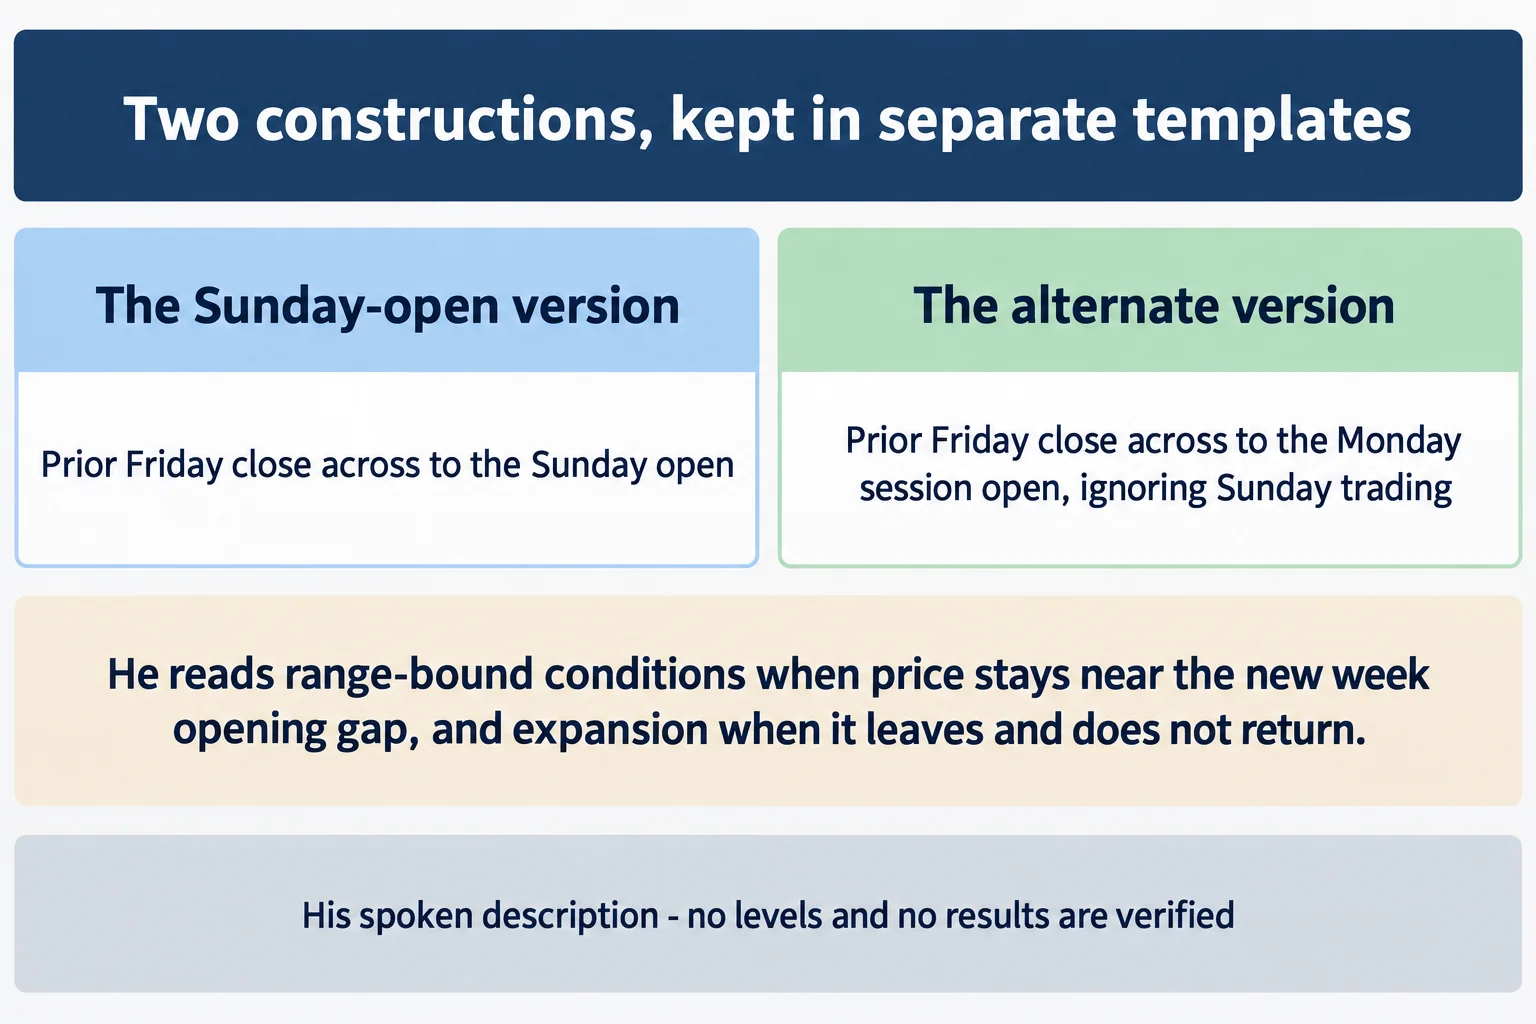
Late in the lecture he offers a way of reading the gap’s relationship to price. When price is close to the new week opening gap he describes the market as range-bound (12:26); when it struggles to move away and keeps coming back, he calls that consolidation (12:31); and when price leaves the gap and does not return, he calls it range expansion or a trending week (12:37). He then points to a stretch where price traded into a level, moved lower, came back to it as support and later gravitated to an older gap, and finally to the previous week’s gap as support (12:50, 13:03 and 13:08).
Those labels are how he organises what he sees on his own charts. The recording does not define thresholds for “close to” the gap, does not state when consolidation becomes expansion, and does not quantify any of the moves, so the terms are descriptive rather than mechanical rules a reader could test as written.
ICT NWOG Gap Setup Using the Monday Open
He distinguishes two constructions and gives them different names. The one he calls new week opening gap “actual” runs from the Friday close to the actual Sunday open, because Sunday trading exists (14:36, 15:10 and 15:16). The second runs from the same Friday close to the Monday 9:30 a.m. open for ES, with Sunday trading left out of the measurement entirely (14:41, 14:48 and 14:52). He wants both kept in separate templates so the levels from one are not mixed with the other (15:37).
The session times quoted here (4:59 p.m. Eastern for the Friday reference and 6:00 p.m. Eastern for the Sunday reference) are the ones he uses in this presentation. They should not be generalised to every instrument, broker feed, holiday calendar or daylight-saving period without checking that the same session prices apply.
How to Study the ICT NWOG Gap
- Pick one construction and use it consistently (the Friday-close-to-Sunday-open version, or the Friday-close-to-Monday-open version, not both on one chart).
- Mark the two prices on the lower-time-frame chart the construction calls for rather than reading them from a daily candle (0:42).
- Record the midpoint as the 50% level between the two prices, and the optional quarters between the midpoint and each edge (9:29).
- Label each level with its Sunday date, keep four or five of them visible (%s), and note separately what price did around each boundary, midpoint and quarter rather than assuming a reaction.
What the ICT NWOG Lesson Does Not Provide
Nothing in the recording is a trade, an entry rule or a risk parameter. He names no instrument in the trade sense, no price for any level, no target and no result, and the chart values are not recoverable from the captions, so no level quoted above is reconstructed from the video. There is also no measurement of how often price returns to an old gap or how it behaves when it does, and no comparison against any alternative way of drawing the same sessions. The video ends with a homework assignment to put the levels on the viewer’s own charts (15:51).
Watch the Original ICT NWOG Recording
NWOG – New Week Opening Gap
The Inner Circle Trader · uploaded 8 March 2023 · about 16 minutes. This is the primary source for this article; every timestamp link above points into it.
The video is not embedded here because the owner has disabled playback on other websites. That was checked directly on 15 September 2026 from a BestProps page origin: the embedded player loads and returns “Playback on other websites has been disabled by the video owner” instead of playing, at both desktop and mobile viewport sizes, so no empty player is left on this page.
The watch page was read on 15 September 2026 and rendered as a public video: title “NWOG – New Week Opening Gap”, listed at 16 minutes, with an upload timestamp of 8 March 2023 at 4:46 p.m. Pacific. The scheduling inventory for this article lists the upload under 9 March 2023, which is the same moment expressed in UTC. The recording itself is dated 8 March 2023 by the speaker (3:55), and the channel is The Inner Circle Trader on YouTube, the first-party record of what the publisher releases.
ICT NWOG Chart Resources
These are the sources checked for this article. The publisher’s own channel and site are the first-party record of what ICT releases; the regulator page is general material about trading systems marketed to the public. None of them assesses the speaker, verifies a statement made in the recording, or tests the New Week Opening Gap idea. Any ICT, smart-money or third-party indicator, script, note set or re-upload circulating outside the publisher’s own pages, and any indicator built on these levels, is unofficial and untested here.
- [1] NWOG – New Week Opening Gap, The Inner Circle Trader (primary source; watch page read 15 September 2026, 16 minutes)
- [2] The Inner Circle Trader (official YouTube channel) (read 15 September 2026)
- [3] The Inner Circle Trader (publisher’s own site and free library) (read 15 September 2026)
- [4] CFTC, Fraud Advisory: Commodity Trading Systems Sold on the Internet (read 15 September 2026) describes how hypothetical or simulated results are presented to the public.
This is independent educational commentary on one speaker’s own chart work. It is not official ICT material, it is not a tested trading system and it is not investment advice. The recording contains no profit or loss figure and none is reported here. Leveraged futures and forex trading carries substantial risk.
