
Key takeaways
In NDOG – New Day Opening Gap – Part 1 (0:12), the speaker defines a New Day Opening Gap in futures as the interval between the previous session’s 5:00 p.m.
Read the full summary
In NDOG – New Day Opening Gap – Part 1 (0:12), the speaker defines a New Day Opening Gap in futures as the interval between the previous session’s 5:00 p.m. New York closing price and the first traded price after the 6:00 p.m. restart that follows a one-hour break (0:43 and 1:52). He says the daily version can form Monday through Thursday and that the Friday-to-Sunday separation is instead the New Week Opening Gap (1:35). He skips one- and two-tick separations, prefers a visibly meaningful gap of more than one handle, carries the first qualifying gap through the current week, keeps both boundaries even after the gap has been traded through, and starts over when a new week begins (4:31, 5:03 and 5:50). He also says he does not treat it as a signal on its own: he wants it to support an idea he reached from other tools (7:58). The demonstration is a May 2023 five-minute chart he was annotating; the captions carry no prices, fills or account results, so nothing here is evidence of performance.
How we researched this article
BestProps used document-based research from primary firm sources, checked September 24, 2026. The complete source list, scope, limitations, and commercial-state record appear near the end of this article.
This is a short module in which the speaker sets out one more way of marking where price has been offered. He calls it the New Day Opening Gap and treats it as a reference area rather than as a trade trigger. The recording runs about nine minutes and, apart from a handful of stated times and one calendar date, it is a spoken walkthrough of charts the viewer cannot see.
What the speaker calls the New Day Opening Gap
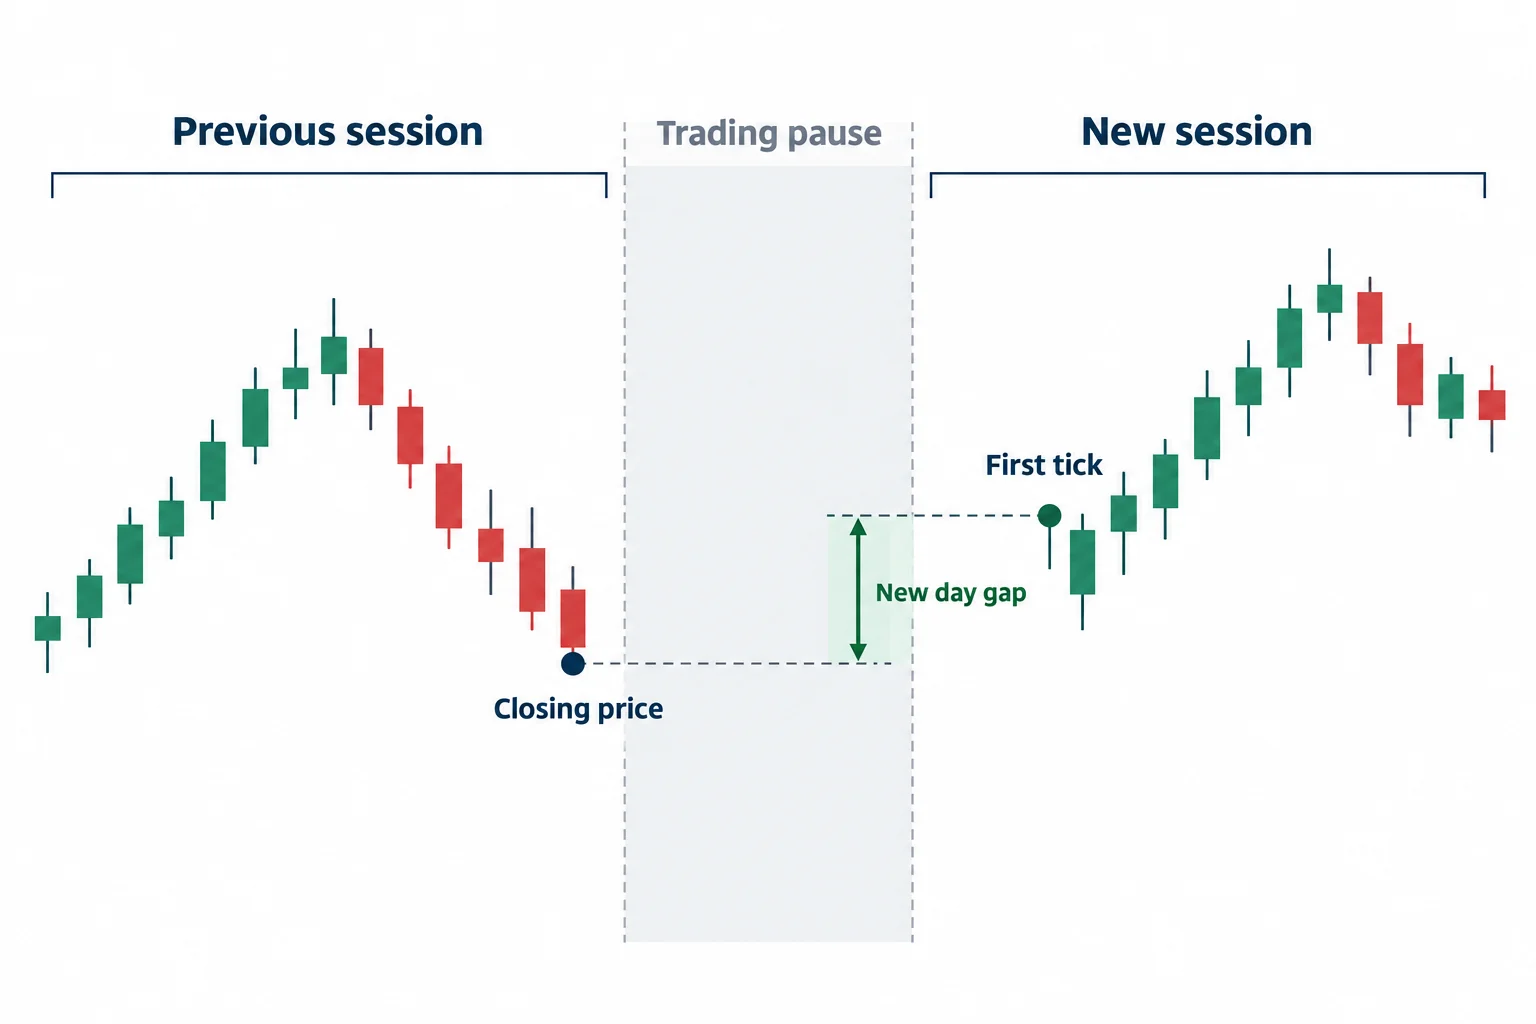
He starts from the futures session structure: the day session closes at 5:00 p.m. New York time, futures trading pauses for an hour, and trading reopens at 6:00 p.m. (0:43). The two prices that matter to him are the closing price of the previous session at 5:00 p.m. and the very first tick or traded price after the 6:00 p.m. reopen — whichever trade gets filled first (0:54). The gap, in his usage, is the separation between those two values.
His reasoning is that neither price is arbitrary. He says the opening print is not a random price event because it is offered to the market and the first fill starts the new day, and he says closing prices are not random either (1:01 and 1:19). Both are recorded prices rather than lines a chartist chooses afterwards.
He says the daily version can appear Monday through Thursday. Friday is different, because the separation he is interested in there runs from the Friday close to the Sunday reopen, and that one he calls the New Week Opening Gap (1:35). This lesson is about the intra-week version.
There is a calendar wrinkle worth stating plainly, because the captions handle it awkwardly. He says he personally calls the example “May 3rd” even though the session that begins at 6:00 p.m. New York on 3 May is booked as part of 4 May trading on the charting platform he refers to (2:00). His point is that the naming convention is not the substance; the two prices are.
Carrying the gap forward through the week
He then extends the gap levels forward into later price action and describes what happened next (2:28). In his commentary the same area acts as support, then as resistance, then as a zone price consolidates inside, with the midpoint of the range described as a kind of equilibrium and with price gravitating around it (2:58 and 3:02). He says the same level was hit as resistance repeatedly before price was sent higher after the payroll data (3:28).
Those labels are his reading of a chart he was annotating, not a measurement. The captions contain no price scale, no bar data and no account information, so a reader cannot verify the support and resistance sequence from the recording alone. What can be taken from the passage is the method: mark two edges, then watch how the market treats them.
How he filters a meaningful gap
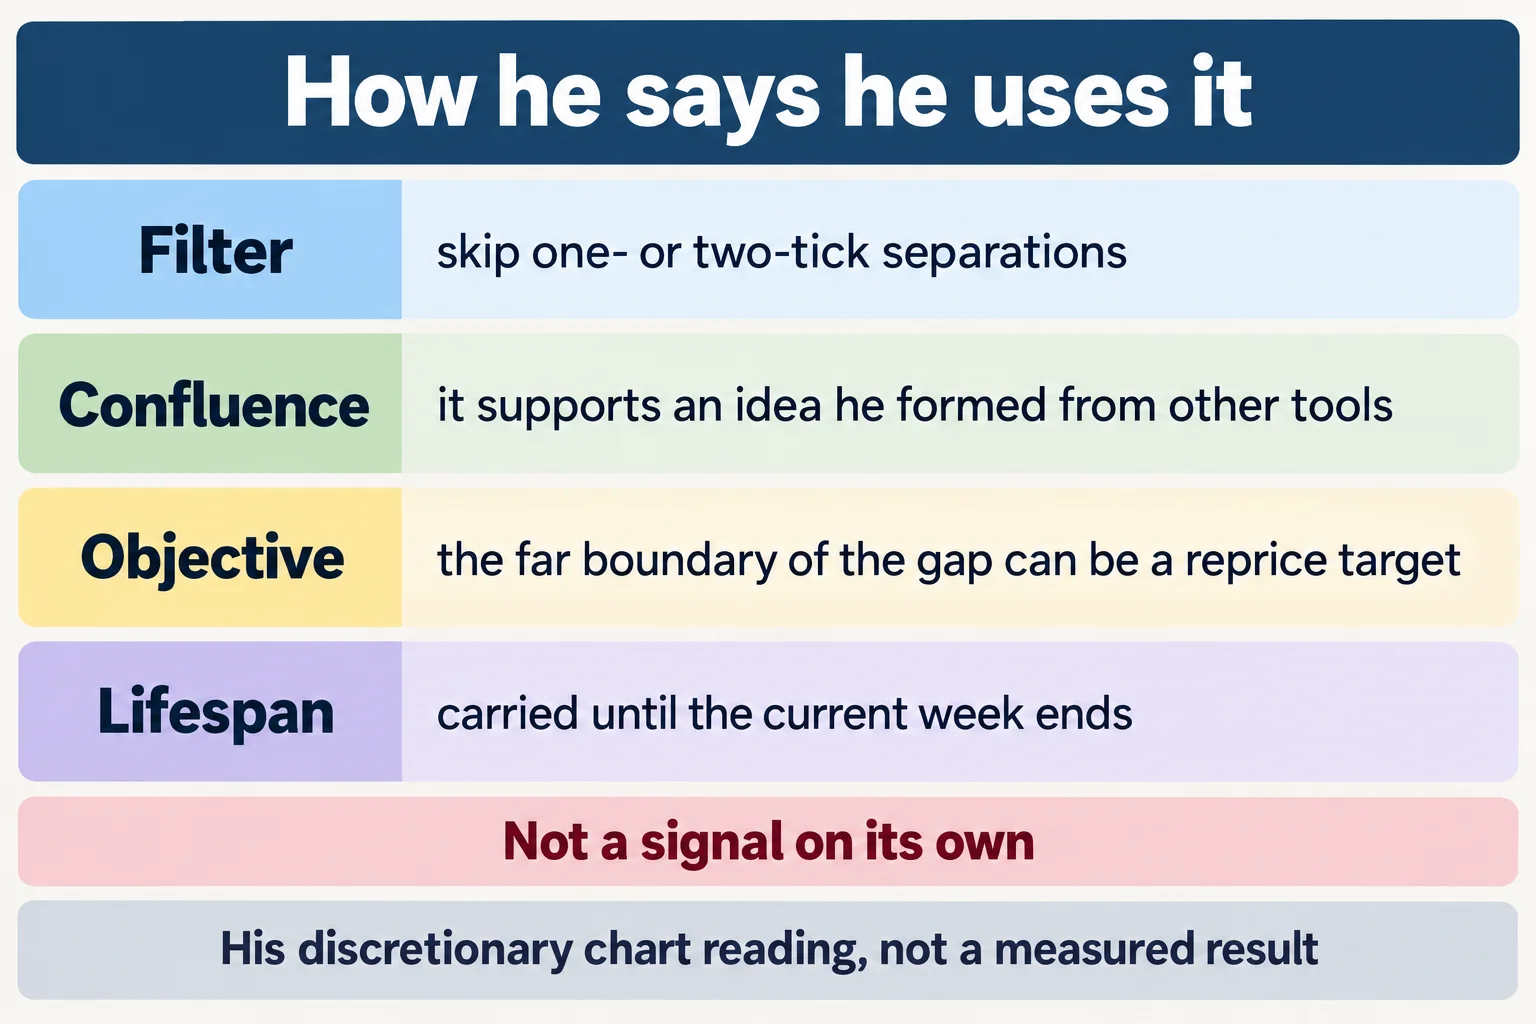
Not every session produces something he will use. He says there are days with barely any separation between the 5:00 p.m. close and the 6:00 p.m. reopen, and that this pattern is not an everyday event (4:01 and 4:19). If the separation is one or two ticks he says he is not excited about it and generally does not like those gaps, while allowing that price can still respect the level (4:31).
He declines to give a fixed threshold. He says there is no specific number of handles or points he wants, only that he would prefer the separation to be more than one handle (4:51). That is a discretionary filter expressed in the recording, not a tested parameter, and nothing in the captions establishes how any size threshold performs.
How long a gap stays relevant
The lifespan he describes is one week. He carries the data forward and casts it throughout the entire week; once that week closes he says he is not interested in that gap any more and will not keep using its two levels into a new trading week (5:03). When a new week starts he takes the first New Day Opening Gap of that week and extends that one instead. He adds that on the ES charts he looked at there was no other meaningful daily gap that week besides the one shown (5:38).
One detail separates this from the usual way gaps are treated. He says that when price closes the gap, that is not a point of abandoning it; he refers back to the area later and says price continues to gravitate around it (5:50). In his framing the two edges stay relevant for the rest of the week whether or not the space between them has been filled.
It is used as confluence, not as a signal
The qualification he emphasises most is this: he likes a New Day Opening Gap to act as a supporting factor or a resistance to an idea he had already arrived at through other tools, rather than as a reason to trade by itself. He calls it one of the things he likes to add to, and says it is not a panacea (7:58).
In the chart discussion the references he stacks together are the old gap low where the 6:00 p.m. session opens (6:25), a fair value gap he describes in words the captions render as a buy-side imbalance (6:36), the optimal trade entry zone inside it (6:42), a retouch of the gap edge and relative equal lows with the sell-side liquidity beneath them probed during the London session on Friday (7:01 and 7:09), and a bullish breaker that price trades back into (7:22). These are his labels for what he was drawing on his own charts; the captions confirm the words, not the geometry.
He adds one candle-reading remark: the wicks did the damage but the bodies told the story, because the candle bodies in that sequence were not willing to close below the swing (7:39). Whether the candles behaved as described cannot be checked from the recording.
The reprice idea and the Asian-session example
Near the end he describes a use he calls straightforward. If the gap has not already been repriced to its high, he says he likes to see price trade up into that far edge; the logic is reversed when a gap forms higher, and he then looks to trade down into the low (8:21).
The setup he points at is an opening price, a move down, consolidation around the low of the gap, and then a trade back up toward the high of the gap, which he calls a very easy bread-and-butter type scalp (8:31), and which he places in the Asian session for a viewer who can study or tape-read at that hour (8:44). He states no entry rule, no stop, no target and no result, and none is visible in the recording.
A neutral way to study the material
If the framework is interesting, it can be examined without assuming it has an edge:
- Mark the 5:00 p.m. New York futures close and the first traded price after the 6:00 p.m. reopen, and record the separation between them.
- Decide the size filter before looking at what price did afterwards, and log the sessions it excludes as well as the ones it keeps.
- Extend only the first qualifying gap of a week and stop at the end of that week, so the test matches what the speaker actually describes.
- Record every later interaction with both edges, including the quiet sessions and the failures, rather than keeping only the clear-looking examples.
What this recording does not establish
The captions are YouTube’s automatic ones, and they garble some terms and phrasings. “NDOG” appears as “ndog” and the phrase “new day opening gap” as “new day opening app”; “buy-side” appears as “by side”; “fair value gap” is once rendered as “Fairway got”; the passage at 6:36 comes out as “a fair value Gap in the form of a buy side imbalanced outside and efficiency”; and the fragment covering the daily schedule reads “Monday Tuesday Wednesday Thursday can end Friday”, which is why this article states the Friday exclusion from the clearer part of the same passage rather than from that fragment. The normalisations above are limited to places where the surrounding context is unambiguous, and the ambiguous phrasings are quoted rather than silently rewritten.
Beyond that, this is a narrated walkthrough of charts the article cannot see. The captions supply no price levels, no bar measurements, no order fills and no account figures, and this article was written from the timestamped captions rather than from a live chart. Every reaction, level and sequence described above is the speaker’s account of what he was annotating. A claim about markets reacting to opening gaps in general would need separate, properly configured historical data before it could be treated as evidence, and a retrospective explanation is not the same thing as a tested system. Nothing here is investment advice, and leveraged futures trading carries substantial risk.
Watch the original recording
NDOG – New Day Opening Gap – Part 1
The Inner Circle Trader · published 7 May 2023 · about 9 minutes. This is the primary source for this article; every timestamp link above points into it.
The video is not embedded here because the owner has disabled playback on other websites. That was checked directly on 15 September 2026 from a BestProps page origin: the embedded player loads and returns “Playback on other websites has been disabled by the video owner” instead of playing, so no empty player is left on this page.
The watch page was read on 15 September 2026 and rendered as a public video: title “NDOG – New Day Opening Gap – Part 1”, listed at 8 minutes 57 seconds, with an upload timestamp of 7 May 2023 at 3:58 p.m. Pacific. The scheduling inventory used for this article lists the same upload under the date 7 May 2023, so the two agree, and the title itself points at the early-May 2023 session shown on the charts. That upload date is a different calendar day from the 3 May session date the speaker gives in the recording, which is an ordinary time-zone and session-labelling difference rather than a contradiction. The channel is The Inner Circle Trader on YouTube, which is the first-party record of what it publishes.
Resources
These are the sources checked for this article. The regulator and investor-education pages are general material about futures and about trading systems sold to the public; they are not assessments of the speaker or of anything said in the recording, and none of them verifies a statement made here. Any ICT, smart-money or third-party indicator, script, note set, transcript pack or re-upload circulating outside the publishing channel’s own page is unofficial and untested here.
- [1] NDOG – New Day Opening Gap – Part 1 — The Inner Circle Trader (primary source; watch page read 15 September 2026, 8M57S)
- [2] The Inner Circle Trader — official YouTube channel (read 15 September 2026)
- [3] CFTC — Fraud Advisory: Commodity Trading Systems Sold on the Internet (read 15 September 2026)
- [4] Investor.gov — Glossary: Futures (read 15 September 2026)
- [5] Investor.gov — Glossary: Leverage (read 15 September 2026)
This is independent educational commentary on one speaker’s framework. It is not official ICT material, it is not a tested trading system and it is not investment advice. The recording contains no profit or loss figure and none is reported here.
