
Key takeaways
The Inner Circle Trader on YouTube presents a 15 minutes 41 seconds review moving from daily Dollar Index, EUR/USD, GBP/USD, December S&P 500 and Nasdaq futures objectives to 15-minute, five-minute and one-minute setups.
Read the full summary
The Inner Circle Trader on YouTube presents a 15 minutes 41 seconds review moving from daily Dollar Index, EUR/USD, GBP/USD, December S&P 500 and Nasdaq futures objectives to 15-minute, five-minute and one-minute setups. ICT reads dollar strength against euro and pound weakness, identifies 1.2308 as a GBP/USD objective, and says Nasdaq reached 15,531.00, two ticks below his 15,531.50 consequent encroachment level. His framework combines Nasdaq and S&P SMT divergence, a lower-time-frame market structure shift, fair value gaps, order blocks, breakers and alternative Silver Bullet entries between 10 a.m. and 11 a.m. New York. He later shorts after three drives above buy-side liquidity but reports that stop-loss and take-profit orders would not submit through the connection between AMP Futures and his unnamed charting platform, forcing manual management and an early exit. He claims a little over $7,400 profit on a live account versus about $14,000 under the intended plan, but the article could not verify the account, fills, position size or hypothetical result and provides no win rate, sample size, backtest or drawdown data.
How we researched this article
BestProps used document-based research from primary firm sources, checked September 24, 2026. The complete source list, scope, limitations, and commercial-state record appear near the end of this article.
This article covers a short market review, so it stays close to what he said. It explains his reasoning in his own terms; it does not test his model, and nothing here is a recommendation to trade index futures or currencies.
ICT Market Review of Dollar Strength and Currencies
At 0:10, ICT opens on the daily Dollar Index and points to two areas he reads as buy-side liquidity, referring back to recent sessions and to pre-market videos he had posted. He notes the review falls in futures rollover week, with the September contract expiring and trading moving to December, and says those weeks tend to bring more volatility and choppier price action. He also flags several scheduled 8:30 a.m. New York news releases as the day’s event risk.
He says the dollar did not first retrace into the area he had described before the 8:30 news, and that it instead moved above a prior high and began challenging what the captions render as a possible “buy-side quarterly pool.” That phrase is unclear in the automated captions, although the surrounding discussion plainly concerns liquidity resting above an earlier high and whether it would be taken on Friday or the following week. He states his intention was not to call the top.
From 1:39 he links a stronger dollar to weakness in EUR/USD. He describes an area as an inversion fair value gap and points to its consequent encroachment midpoint, then says the euro traded below its May 31, 2023 daily low that day, after first running into what he calls a repair gap. For GBP/USD he presents the same bearish scenario and names 1.2308 as the level he expects price to gravitate toward; the captions render that level as “.08,” which reads as 1.2308 in context. These are his chart interpretations and directional expectations, not independently established market rules.
ICT Market Review of Daily Equity Indexes
The review turns to December S&P 500 and Nasdaq futures at 2:45. ICT says his pre-market expectation was for the S&P to trade higher, run the buy side, trade through the daily sell-side efficiency high and continue up into a daily fair value gap. He acknowledges the finished chart looks like hindsight and directs viewers to the pre-market videos he posted before the 8:30 news and to his Twitter account as the timestamped record. He also says he will stop posting on Twitter after November 11 and floats pre-market uploads on YouTube from February 2024 if the video reaches 25,000 likes, promotional housekeeping rather than analysis.
For Nasdaq, he focuses on liquidity resting above a prior high and the high and low boundaries of a daily inversion fair value gap. He says the S&P had done a better job of reaching a discount and working its levels, which he reads as a contrast between the two indices. He then explains that his preferred “most symmetrical” backdrop has the dollar and the equity indices moving in opposite directions (dollar one way, equities the other) and attributes the current lack of that symmetry to geopolitical uncertainty and the market still framing its third-to-fourth-quarter transition. That causal explanation is his interpretation, not something the transcript demonstrates.
ICT Market Review of SMT and Trade Setups
At 5:48 he drops to the hourly chart. He describes Wednesday trading down into a daily imbalance and sell-side efficiency low, then Thursday trading down into a Wednesday order block and a fair value gap he tells viewers to mark on their own charts. Price whipsawed through that area, then traded above the daily buy-side efficiency high and up into the daily fair value gap he had described on the higher timeframe, which he says ran “like gangbusters.”
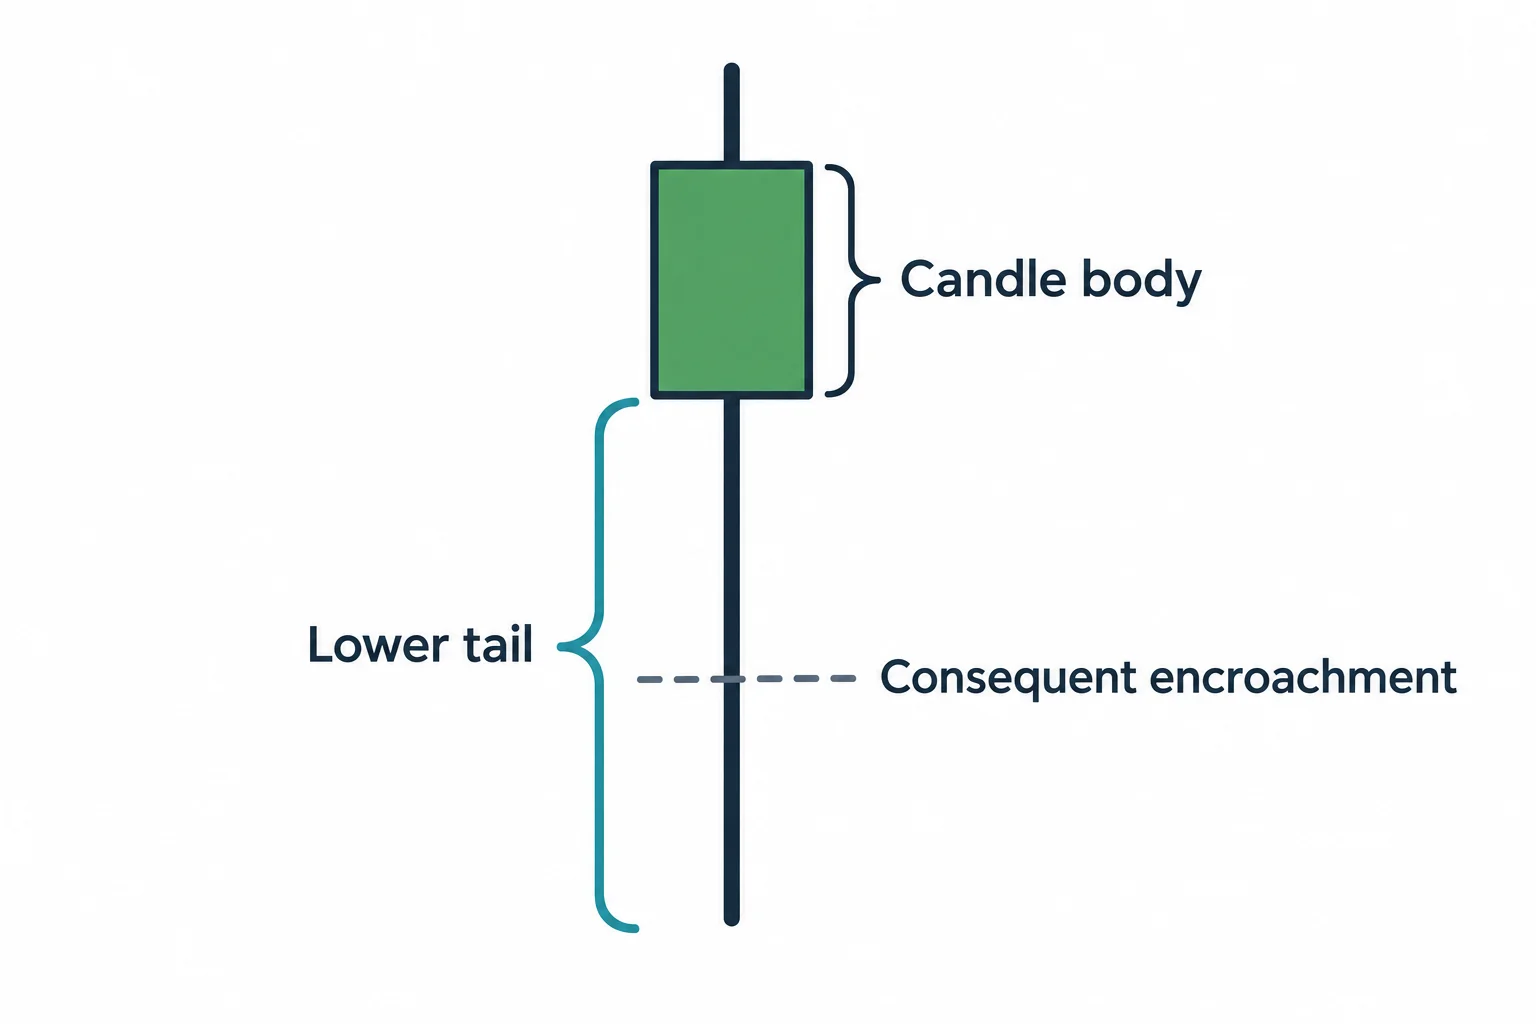
ICT gives particular attention to one Nasdaq candle’s lower tail. At 6:49 he says he had identified the tail’s midpoint, or consequent encroachment, at 15,531.50, and that the session low printed at 15,531.00, which he calls two ticks off his level. He stresses that he said this in a video posted before the 8:30 news. The captions support that he made the claim and repeated it; they cannot show the chart, the earlier video or the exchange print, so the accuracy of the call is unverified here. He adds that the daily inversion fair value gap’s high and low then acted as intraday support and resistance structures.
The cross-market comparison becomes explicit at 8:01. He says the 15-minute low was higher on the S&P than on the Nasdaq, and within his framework that mismatch is labeled SMT divergence: the Nasdaq traded down to the low he had named while the S&P held a higher low, after which both rallied into buy-side liquidity. He also points to a 15-minute bearish order block and its mean threshold.
On the five-minute charts he highlights a discount efficiency high and low and a breaker, and repeats his order-flow premise: for the bullish bias to hold, price had to drop into that level first and then reprice higher, which he says is what followed on both indices. On the one-minute charts at 9:03 he layers the divergence, a shift in market structure and fair value gaps, and labels several alternative entries between 10:00 and 11:00 New York as “Silver Bullet” setups, presenting them as interchangeable choices from the same context rather than a single required entry. He closes this section by saying the levels had been on his charts and shared for days, and that they only look added after the fact to someone who has not followed the earlier material. Educationally, the sequence he walks through is:
- Start with a higher-time-frame directional hypothesis (here a bullish index premise resting on a weaker dollar).
- Identify a specific liquidity objective or imbalance boundary the market may draw toward.
- Compare related indices for a divergence around a meaningful low.
- Wait for a shift in lower-time-frame market structure rather than treating divergence alone as an entry.
- Use a fair value gap or a related price array as the proposed execution area.
That list summarizes the reasoning ICT presents. It is his framework restated, and it does not establish that the setup is predictive or profitable.
ICT Market Review of the Trade Management Issue
At 10:26 ICT recounts the short he took that day. He describes three drives above buy-side liquidity, a shift in market structure, and then a trade down into a bearish breaker and an inversion fair value gap, where he went short. He says he learned the three-drives idea from the book Street Smarts, notes the pattern also circulates as “three little Indians” or “three Indians,” and says he does not argue about the name. He uses it when price is at a level he thinks could repel it. He also says he missed the entry he actually wanted, which he calls his 2022 model entry, and had to wait for price to trade lower before entering.
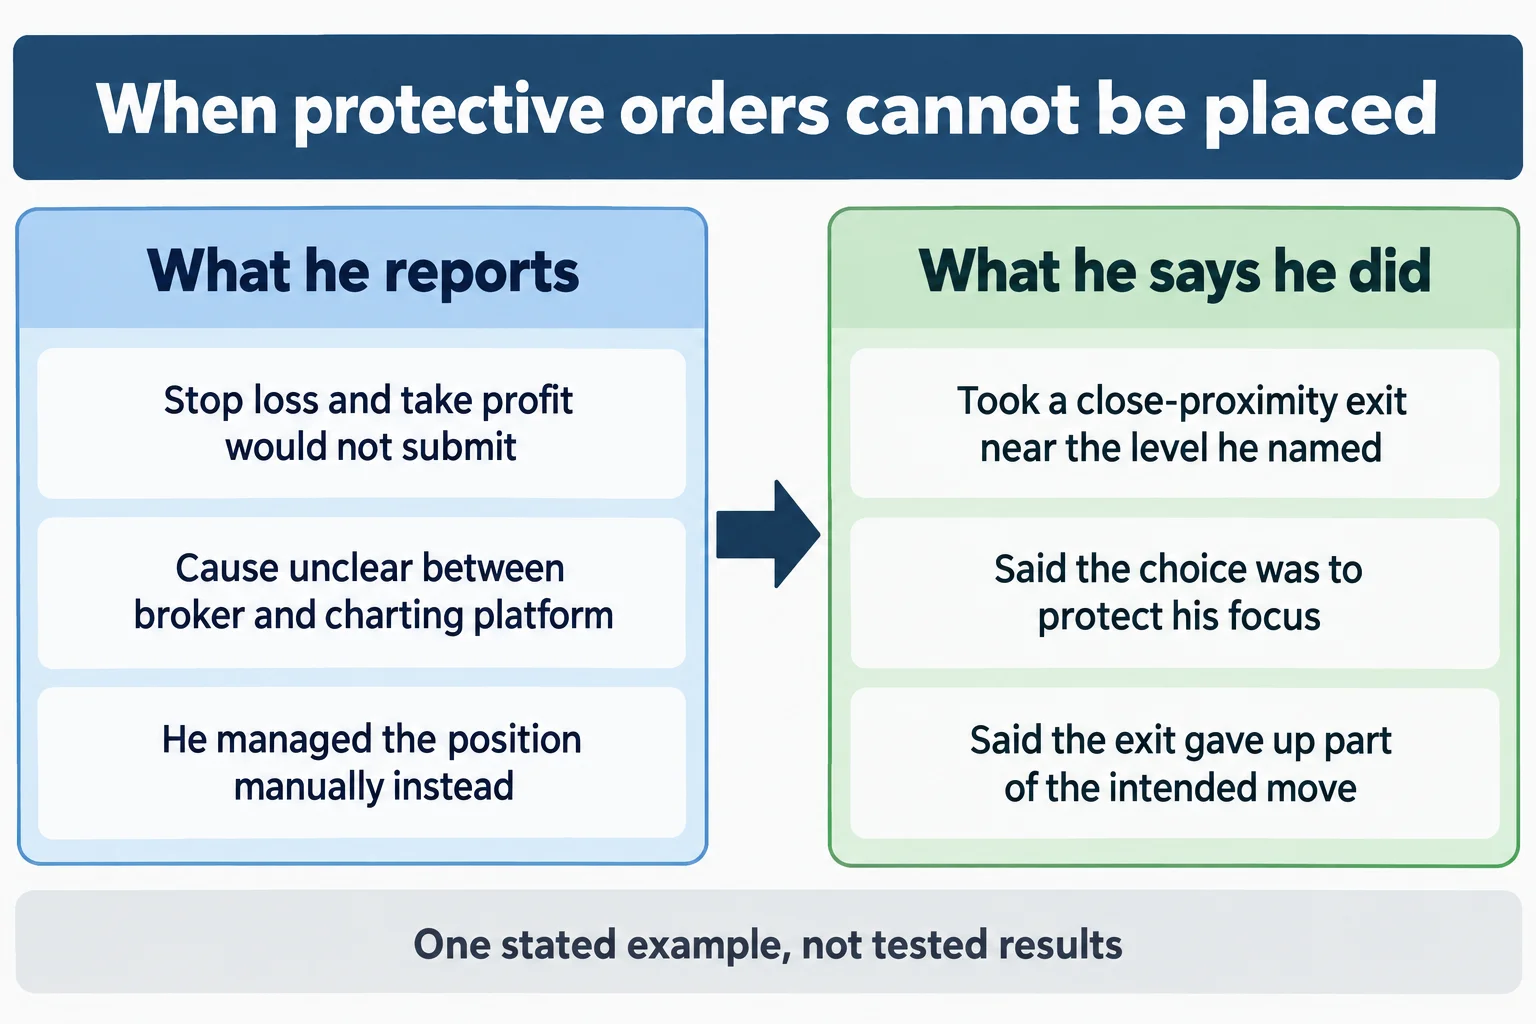
The lesson he draws is less about the entry than about what followed. ICT reports a technical problem with his broker connection to his charting platform: he could not place visible stop-loss or take-profit orders. He names AMP Futures as the broker while explicitly saying it is not a recommendation, and he says the account is live, meaning real money rather than a demo. He says he could not tell whether the fault was on the broker’s side of the link or a charting-platform glitch, and that he ruled out leverage, account equity and platform settings as causes.
Because he could not manage the position as intended, he says he tried repeatedly to submit the orders, then managed the short manually, watching it with the intention of closing if it moved against him. Rather than hold for the target he had described, he took an exit close to a nearby low and describes the choice as protecting his “mental capital” instead of letting the frustration run the trade. He says the exit gave up part of the intended move: he reports making a little over $7,400, and says the plan he wanted to execute could have produced about $14,000 including a partial. Both figures, and the live-account characterization, are self-reported; captions cannot verify fills, position size, account status or the hypothetical alternative. He says he recorded the incident because it could happen to a student.
The transferable risk point is not the dollar amount. It is that an execution plan can be invalidated by technical failure outside the trader’s control, and that what happened next was a decision made under pressure. Deciding in advance how to respond when protective or exit orders cannot be entered is the part of this segment that carries beyond ICT’s specific method.
What the ICT Market Review Establishes
What can be checked is that ICT said these things, on this date, about this session. The review is a verbal walkthrough over charts: the recording contains no statement, fill history, commission detail or account record, and the result is spoken over his own screen. There is no win rate, sample size, backtest or drawdown figure anywhere in it. The claim that the levels were published before the session rests on videos and posts outside this recording, which this article could not inspect.
The automated captions are rough in places, which is why a few terms are quoted here as rendered rather than cleaned up: “buy-side quarterly pool” and the “.08” rendering of 1.2308 are the two clearest cases. Where a term or number is ambiguous in the captions, this article flags it rather than resolving it by inference. The 15,531.50 level, the fair value gap sequence and the trade description all depend on charts and order tickets this article cannot see, and a reported live-account result is not evidence of a repeatable method.
Watch the Original ICT Market Review
ICT Mentorship 2023 – September 14, 2023 Market Review
The Inner Circle Trader · uploaded 14 September 2023 · about 15 minutes. This is the primary source for this article; every timestamp link above points into it.
The recording is not embedded here because the video owner has disabled playback on other websites. That was checked directly on 15 September 2026: the player loads and returns “Playback on other websites has been disabled by the video owner” rather than playing.
The recording runs about fifteen minutes and is the only primary source used for this article. The channel is The Inner Circle Trader on YouTube.
ICT Market Review Resources
These are the sources checked for this article. The CFTC and Investor.gov pages are general regulator and investor-education material, on leveraged foreign-exchange fraud, on trading systems sold online, and on what leverage is. They are not assessments of ICT or of anything said in the recording, and none of them verifies the figures he reports here. Third-party copies, notes and indicator bundles derived from his material circulate outside his own distribution and were not tested here.
- [1] ICT Mentorship 2023 – September 14, 2023 Market Review (The Inner Circle Trader; primary source; watch page read 15 September 2026, 15M41S)
- [2] CFTC Learn & Protect, Forex Frauds (read 15 September 2026)
- [3] CFTC, Fraud Advisory: Commodity Trading Systems Sold on the Internet (read 15 September 2026)
- [4] Investor.gov, Glossary: Leverage (read 15 September 2026)
This is independent educational commentary on one market review. It is not official ICT material, it is not a tested trading system, and it is not investment advice. All dollar figures are the speaker’s own spoken review of his own account and are not verified here. Index futures and leveraged foreign-exchange trading involve substantial risk and are not suitable for everyone.
