
Key takeaways
ICT’s 36 minutes 17 seconds ES market review explains why he favored stock-index futures over choppy DXY, EUR/USD and GBP/USD price action, recommended studying one market rather than switching between ES and NQ, and applied the Power of Three model using a 4072.75 higher-time-frame objective and the 4036.75 New York midnight open.
Read the full summary
ICT’s 36 minutes 17 seconds ES market review explains why he favored stock-index futures over choppy DXY, EUR/USD and GBP/USD price action, recommended studying one market rather than switching between ES and NQ, and applied the Power of Three model using a 4072.75 higher-time-frame objective and the 4036.75 New York midnight open. His bullish framework expected the session low below the midnight open and old sell-side liquidity before expansion toward 4072.75, while his one-minute replay highlighted 4035 sell-side liquidity, a 10 hours 38 minutes fair value gap expected to reject quickly, a move below the 9 hours 56 minutes low, and 4051.25 as the short idea’s invalidation and hypothetical stop. For the final hour from 15 hours to 16 hours New York time, he says he bought ten ES contracts at the session low and ten more in a fair value gap, missed two five-contract additions, exited five contracts twice at 4072.75 and five at 4073, and had the balance stopped out instead of reaching his 4076.25 Fibonacci-extension limit. He advocates defining a study window such as 9 hours 30 minutes to noon, pairing every level with its timestamp and contemporaneous price, always using stops in demo and live trading, taking partials near the expected move’s maturity, and beginning with a five-handle or 20-tick objective. The recording’s 965 auto-generated caption segments verify only what ICT said and when, not his orders, fills, profitability, causal claims, or whether the retrospectively explained framework has a repeatable edge.
How we researched this article
BestProps used document-based research from primary firm sources, checked September 24, 2026. The complete source list, scope, limitations, and commercial-state record appear near the end of this article.
This article is a source-grounded reading of ICT Mentorship ES Market Review \ January 26, 2023, built from the recording's timestamped English captions. The video's own watch page gives a publication time of 26 January 2023, 8:10 p.m. Pacific (which is 27 January in UTC, the calendar day used in the campaign inventory) and a running length of 36 minutes 17 seconds. It is a retrospective explanation of one trader's interpretation of a session, not evidence that the concepts it describes produce a repeatable edge.
ICT Market Review Overview
ICT opens by contrasting markets. He describes the Dollar Index, EUR/USD and GBP/USD as sloppy and choppy (1:14), says he is not trading them at that point, and turns to stock-index futures, which he calls the cleanest price action available to him at the time (1:01). He also recommends that developing students follow a single market instead of switching between ES and NQ, on the grounds that fewer instruments make it easier to build experience reading price (3:05). That is a study-process recommendation, not a claim that ES is always the better instrument.
The objective he had given the night before was 4072.75, the wick of a candle he had discussed as the next draw on liquidity (2:16). He describes the 15-minute chart as his bellwether: once a weekly or daily directional view is set, most of what he needs for an intraday idea is on that timeframe (2:38).
ICT Market Midnight Open and Long Scenario
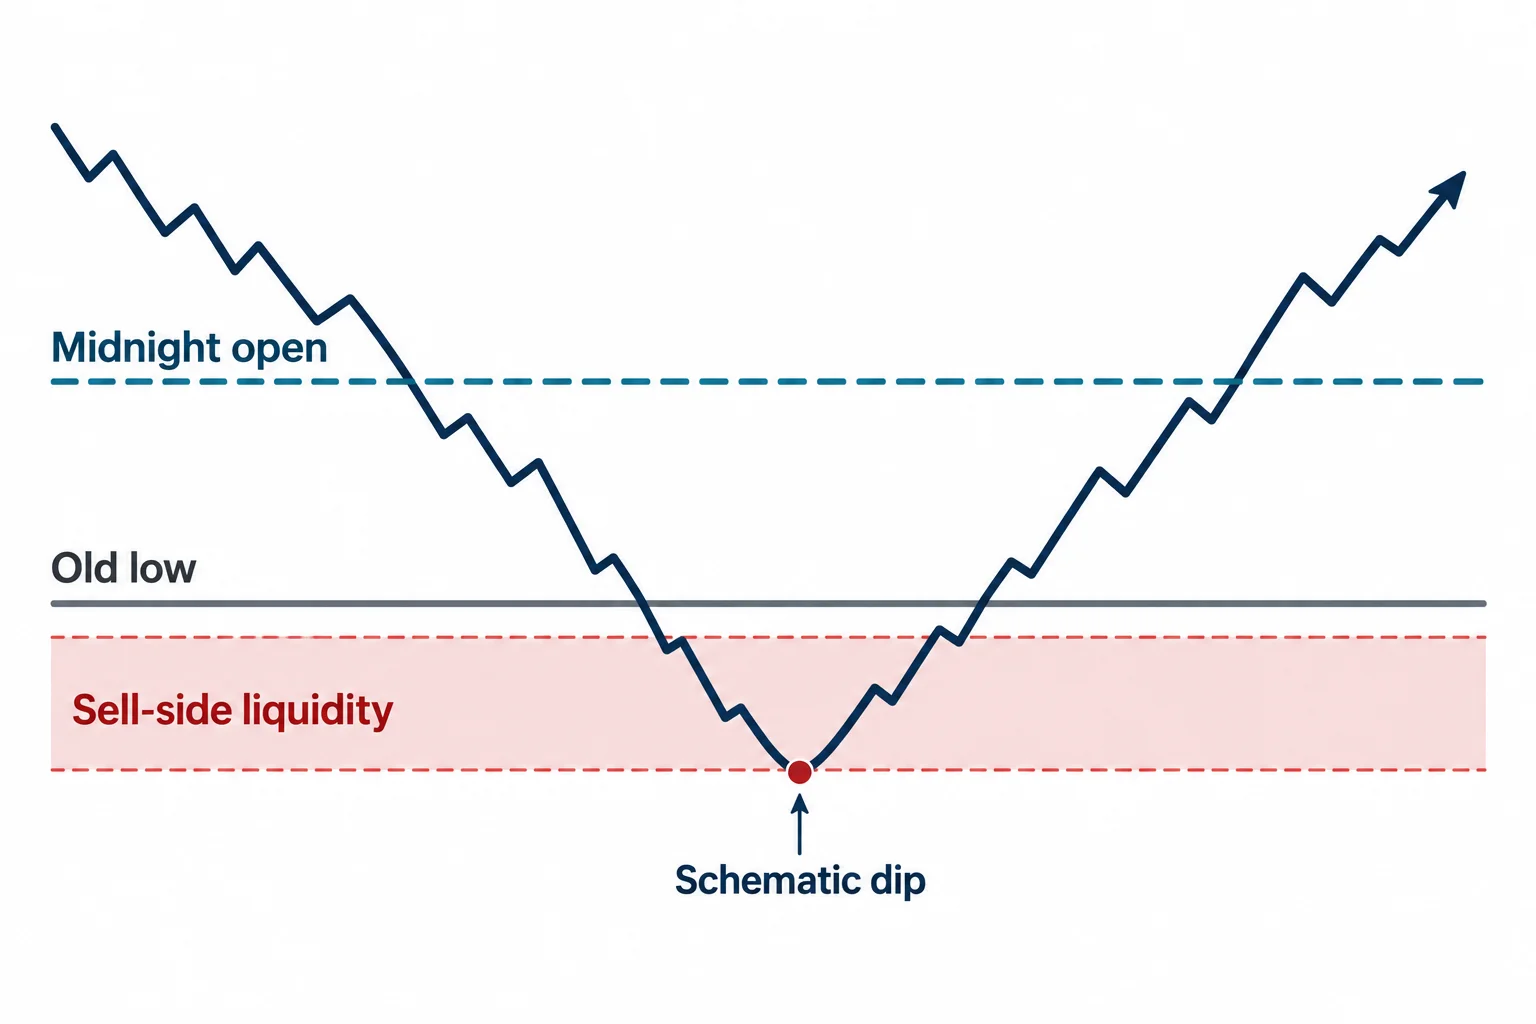
On the 15-minute chart he marks 4036.75 as the midnight opening price in New York local time (4:36). The captions render the date he attaches to that level as “December 26 2023”, which does not match the January date carried by the title and by the video’s own watch-page metadata. The transcript alone cannot settle whether he misspoke or the transcriber misheard, so the level and its role are treated as spoken here and the exact session date is left to the recording’s own chart rather than asserted.
With longs in view, the sequence he describes is a dip below that opening price before any expansion higher. He notes an 8:30 a.m. New York trigger time and the way price was driven under the midnight level, below an old low, before turning up toward the 4072.75 objective (5:01). In his framing that move under the open collects resting sell-side liquidity before price is repriced higher (9:03). Terms like “smart money” and algorithmic repricing are part of his explanatory model; the captions do not establish who traded at those prices or why.
ICT Market Three-Phase Range Model
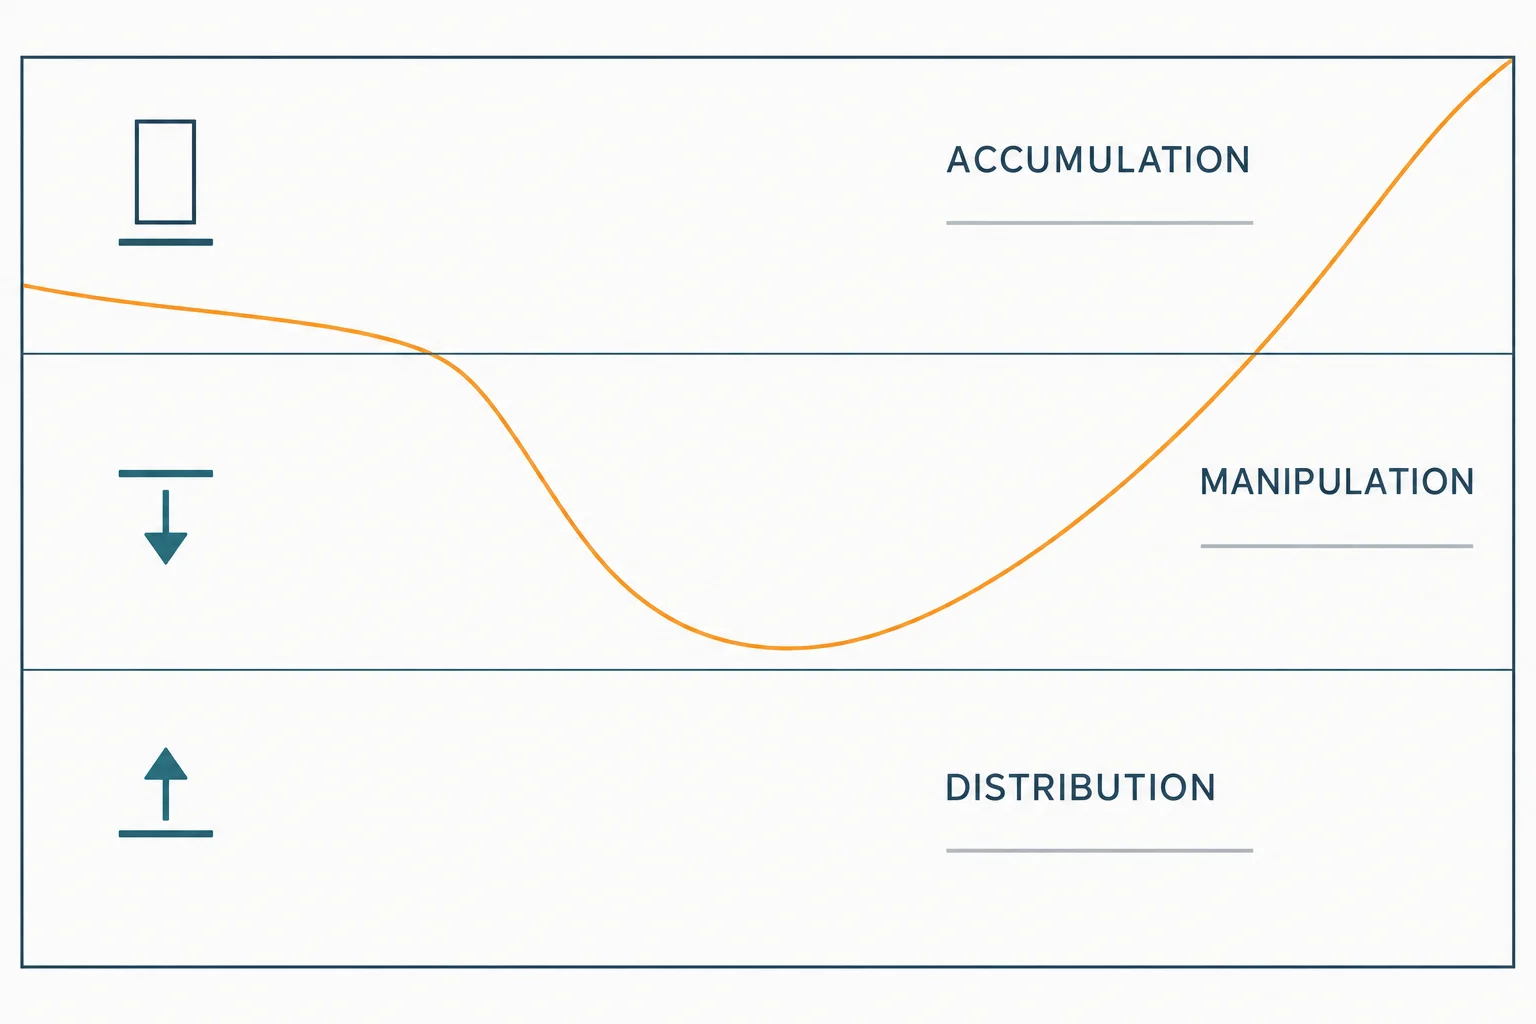
He names the framework “Power of Three”: when he is bullish, the low is expected to form below a key opening price, and for the daily range that key price is the midnight open in New York local time (8:10). In his description the daily or weekly range moves through accumulation, manipulation and distribution, and the same three phases can be read inside the morning or afternoon session.
For a swing or non-intraday reader he suggests alerts near the opening price and resting orders below it rather than constant screen time, with the position sized small enough to leave alone (9:27). He flags his own bias while doing this: he warns that repeatedly shorting a market whose larger expectation is higher is how traders get frustrated, revenge trade, and damage an account (11:47).
ICT Market Session Replay Minute by Minute
The second half is a tape-reading demonstration. He moves to a one-minute chart (12:36) and defines a bounded window, roughly 9:30 a.m. to noon in New York, as the part of the chart a morning-session trader needs to study (12:50, 13:10). Within it he looks for liquidity pools, imbalances, fair value gaps and shifts in market structure.
He then reads back the individual posts he made during the session, timestamped on the one-minute candles so a viewer can match each comment to its bar. One of them flagged 4035 ES as sell-side and a 10:38 one-minute fair value gap, and he says he wanted that gap left unfilled while price reached under the 9:56 low (17:02, 17:16, 17:26). Earlier in the morning he had described the same kind of setup: a gap he said should reject on the candle that traded into it, followed by a move lower (10:31). He states plainly that it is not a signal service and that he is not telling anyone to buy or sell, only drawing attention to a specific candle and level (16:45, 16:46).
4051.25 is named as the level that would have made that short idea wrong. He says it is where a hypothetical stop would sit, above the high of the candle that created the gap, and notes that price neither reached it nor filled the gap completely (18:10, 18:17). The interpretive rule he gives is about direction: a note about buy-side liquidity above the market signals an upward focus, and a note about sell-side liquidity below it signals a downward focus (22:26). His related point is contextual, a quoted level only carries meaning in relation to where price was when the comment was made, which is why the read-back is timestamped candle by candle (19:59).
From that example he moves to risk. He restates that a stop loss has to be used whether the trading is in a demo account or with live funds, and that without one the risk of ruin is real, especially for a new trader caught in the losing cycle he describes (24:14, 24:22).
ICT Market Afternoon Position
In the last hour of regular trading, which he places at 15:00 to 16:00 New York time (26:50), he says he was watching for the session low to be tagged, and that he entered ten contracts when it was, then a further ten as price traded into a fair value gap with a down-closed candle (26:20, 27:01, 27:18). He also says he missed two chances to add five more contracts each and chose to record the sequence on his phone instead.
As price reached 4072.75 he reports peeling five contracts off at that level on one order and five more at the same level, then five at 4073, with the balance stopped out (28:32). He had a limit order further up at 4076.25 (the level he says came from projecting a Fibonacci extension off the session low) and explains that he took the earlier partials instead of waiting for it (29:01). The contract counts, the fill prices and where the position ended are his own narration over his own charts; automatic captions cannot authenticate orders, fills, account records or profitability.
The transferable part of that section is his description of exits. He calls exits his weakest link and wants the best exit available while recognising the demand as unrealistic (29:29). He describes compensating by taking partials in the area where he believes the move is most likely to mature, and by aiming at a large share of the anticipated run rather than the exact high (30:23, 30:42). He presents this as managing his own temperament, not as an optimal method for everyone.
ICT Mentorship Learning and Trading Expectations
The closing section is about process rather than setups. He teaches a small “five-handle” objective as a realistic target to start from (33:24), says 20-tick moves are frequent across a week while only one is needed (34:01), and argues that a single well-sized result could replace the need for a job, while stating that this is not guaranteed and that he is not promising anyone will get rich (34:19). He also says he will direct viewers into demo accounts to take drawdown deliberately and practise working out of it (35:21).
ICT Market Study Takeaways
- Set the higher-time-frame objective and the key opening price before the session, as he did with 4072.75 and the midnight open, and treat the intraday chart as the place the idea is executed rather than invented.
- Define the bounded time window you will actually study (for him, 9:30 to noon for the morning session) instead of reading every fluctuation on the chart.
- Pair every observed level with the time it was noted and the price at that moment; a level quoted out of context carries no information, which is the point of his timestamped read-back.
- Name the invalidation before the trade is on, and treat a stop as a requirement rather than an option.
- Treat partial exits as a tool for your own behaviour, and evaluate mistakes in simulation before assuming any setup guarantees an outcome.
Two limits are worth stating. First, captions confirm only what the speaker said and when he said it. They cannot establish that the trades he narrates occurred as described, and the chart markings themselves are not visible to a reader of the transcript. Second, a worked example in hindsight is a teaching device, not a sample: nothing here tests whether the model holds up across sessions, and the recording’s own account includes a stop-out on part of the position.
Watch the ICT Market Review Recording
The source is the auto-generated English caption track of the recording, 965 timestamped segments covering the full 36-minute runtime. Those captions garble a number of terms of art and spoken figures (the instrument appears once as “the mini SMP”, “forex” appears as “4X”, and prices are written out as spoken words such as “40 72 and three quarters”) so terms have been normalised only where the surrounding sentences make them unambiguous. No chart detail, order fill or result has been inferred from anything other than what is spoken.
Watch the original lesson on YouTube
This recording cannot be played inside another website. Its embedded player was loaded from a BestProps origin and clicked on 15 September 2026: it reported “Video unavailable” and “Playback on other websites has been disabled by the video owner”, with no duration and no playback progress. The recording’s own watch-page data agrees that it is not playable in an embed, which is why no iframe is placed here. The video is public and available directly on YouTube.
Watch ICT Mentorship ES Market Review \ January 26, 2023 on YouTube ↗
ICT Market Review Sources and Further Reading
- ICT Mentorship ES Market Review \ January 26, 2023 the primary source and the only recording used for this article. Published 26 January 2023; watch page read 15 September 2026. Use the timestamp links above to compare each step with what he actually said.
- The Inner Circle Trader YouTube channel the publisher's own channel, where this session review and the concept lessons it references are posted. Unofficial reuploads and summaries are not the source used here.
- CFTC (Fraud Advisory: Commodity Trading Systems Sold on the Internet) US regulator guidance on hypothetical and retrospectively presented results and on the execution and cost assumptions such presentations tend to omit. General context for reading a narrated session recap like this one; it does not assess ICT or any figure here.
- CFTC Learn & Protect The US regulator's investor-education and fraud-warning material. A general reference; it is not a statement that this recording or this article complies with, or violates, any particular rule.
BestProps is not affiliated with the Inner Circle Trader or the CFTC, and no source listed here endorses this article or any setup. Midnight opening price, Power of Three, draw on liquidity, fair value gap and sell-side liquidity are used as descriptive terms for what the recording teaches. The price levels, contract counts, fills, the levels described as invalidation and the account of how the position ended are the speaker’s own narration over his own charts and are not verified here. This is independent educational commentary: it is not official ICT material, not a tested trading system and not investment advice. Index futures trading with leverage involves substantial risk and is not suitable for everyone.
