
Key takeaways
The Inner Circle Trader on YouTube presents a roughly sixteen-minute retrospective review of S&P 500 and Nasdaq index futures using daily imbalance, consequent encroachment, SMT divergence, bearish and bullish breakers, inversion fair value gaps, mean threshold and Silver Bullet concepts.
Read the full summary
The Inner Circle Trader on YouTube presents a roughly sixteen-minute retrospective review of S&P 500 and Nasdaq index futures using daily imbalance, consequent encroachment, SMT divergence, bearish and bullish breakers, inversion fair value gaps, mean threshold and Silver Bullet concepts. ICT preferred Nasdaq because it reached the high of its daily inefficiency while S&P reached only the midpoint, judged Nasdaq candle bodies to show a clearer reaction, traded only Nasdaq and described two exits, including a Silver Bullet short targeting sell-side liquidity and a bullish breaker. He remained intermediate-term bearish but called conditions intraday consolidation to modestly bullish until Nasdaq moved back below consequent encroachment. He reported adding 2,600 to a live account and referenced a Twitter screenshot, but the recording shows no order tickets, fills, account statement, risk figures or legible chart values, so the trades, exits and profit remain unverified retrospective claims rather than tested results or investment advice.
How we researched this article
BestProps used document-based research from primary firm sources, checked September 24, 2026. The complete source list, scope, limitations, and commercial-state record appear near the end of this article.
This is a retrospective explanation of ICT’s stated framework and market interpretation on one session. He narrates it from his own annotated charts, and the recording contains no chart values, order tickets or account statement. The captions are automated and render several of his terms inconsistently, so the vocabulary below is quoted as the captions have it rather than corrected silently.
ICT Index Futures Daily Outlook
He opens by narrowing the scope himself: it is a short review of the stock index futures for that Monday, and he says he will not be covering the dollar index or the forex market because he is not feeling well (0:22). Nothing later in the recording widens that scope back out.
On the S&P 500 daily chart he points to what the captions render as a “sell side imbalance buy side inefficiency” between one candle’s low and another’s high, and names the midpoint of that band consequent encroachment (0:32). With sell-side liquidity already taken below, he says it would be “perfectly reasonable” for price to come back up into the fair value gap, even allowing a small wick outside the inefficiency (0:50, 1:12), but that he would rather the gap stay open, because an open gap keeps his bearish continuation case intact (1:03).
He then states the position and the caveat in the same breath: nothing has changed for lower prices on the intermediate term “for me”, but that does not mean he will not take a long, and the review is not intended to push viewers in either direction – he is just giving his opinion at the moment (1:23, 1:36).
The Nasdaq daily chart gets the same treatment: sell-side taken below, back-and-forth price action, and the same expectation that price could trade down and then come back up into the inefficiency (1:45). The difference he draws is conditional. If either index is going to trade into one of those fair value gaps, he says the Nasdaq will probably be the one that does it; he would like to see the zone repel price and start moving lower from there, and if price instead trades above it, that area may have to be treated as support and the buy-side area above becomes the draw (2:06, 2:24).
ICT Index Futures Levels on Lower Time Frames
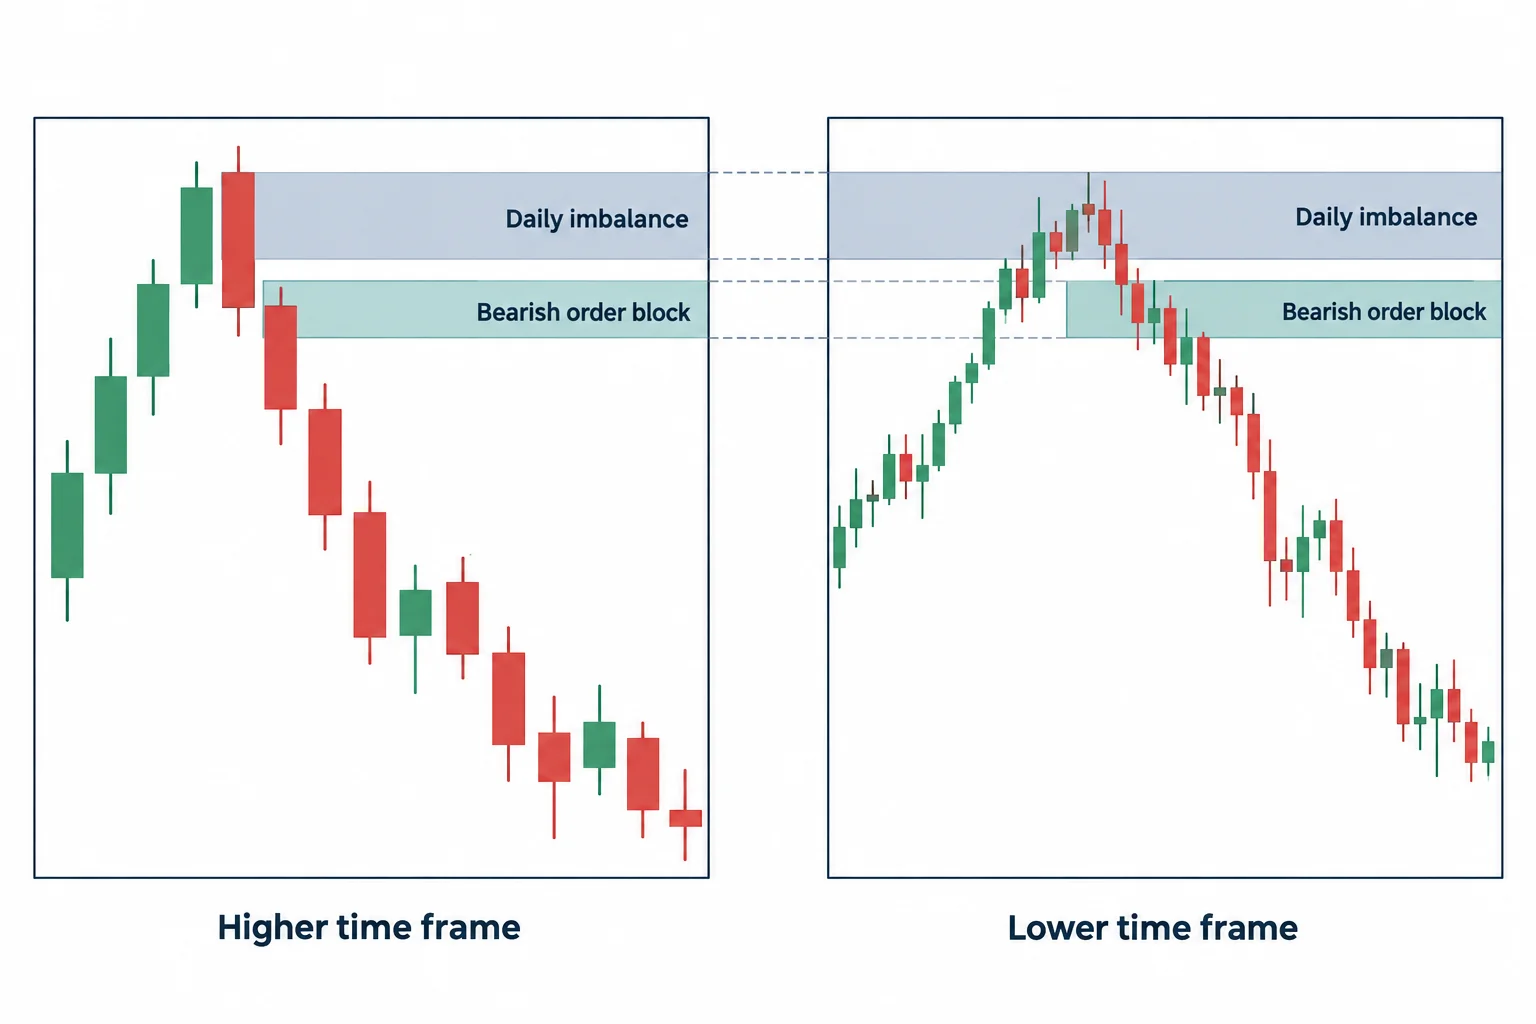
From the daily charts he moves down through the intraday views, carrying the same shaded zone and its midpoint with him. On the four-hour view he walks through price taking sell-side, consolidating, making a lower low, then rallying back into the daily imbalance and into a bearish order block before consolidating into the close (2:48, 3:14).
One comparison in this stretch is concrete in his narration: the market came all the way back down to the low end of the daily inefficiency on the Nasdaq, whereas on the ES it went outside that range (4:27). On the hourly view he says price respected the daily inefficiency, points to the candle bodies doing it, then runs down to take sell-side with a lower low and rallies to the high of the daily sell-side imbalance/buy-side inefficiency, aiming into the bearish order block (4:41).
He flags a higher low he believes formed between roughly 2 a.m. and 11 a.m. and immediately tells viewers not to take his word for it – check the charts and annotate it themselves (5:33). The same instruction runs through the section: he says viewers who copy his charts are cheating themselves the chance to get used to setting them up daily, and likens the exercise to a form of meditation because it brings you closer to the market (3:47). He also points to a bullish breaker, which he defines as an up-close candle, and to a moment where price wicked outside the shaded daily area at the same time an SMT reading was present (5:52).
Why ICT Preferred Nasdaq Index Futures
The selection argument is made on the 15-minute view. He points to an SMT divergence against the Nasdaq’s higher low and says he elected to trade the Nasdaq that day because it was respecting its daily inefficiency: price went down, respected the zone, rallied, the candle body stayed inside the inefficiency while a wick went outside it, and then it broke down (6:47).
He is explicit about what separated the two. The S&P’s market structure looked weaker and less clear to him, and it was not at as much of a premium; the Nasdaq had reached the high of its daily inefficiency and the S&P had not, although he notes the S&P did reach consequent encroachment, the midpoint of the shaded area (7:20, 8:23).
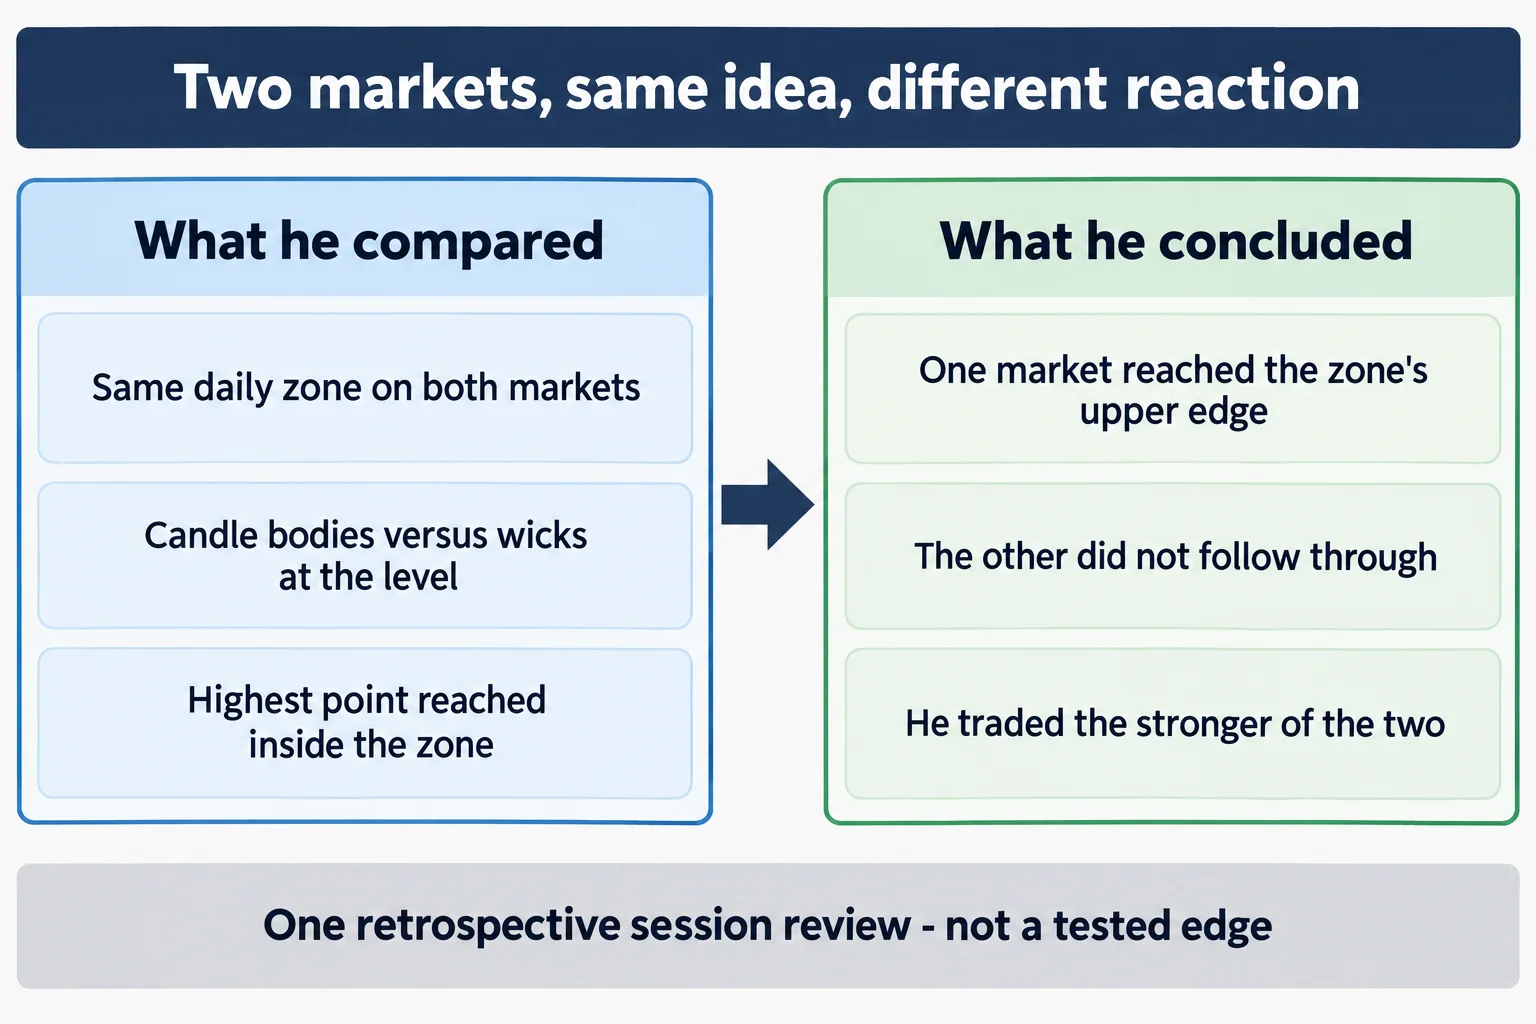
The same 5-minute section is where he generalises the method. He says the S&P chart “just really was not as organized” in terms of market structure, and that the bodies respecting the level are the signatures he is looking for – the same thing he says he looks for when comparing closely correlated currency pairs such as the pound dollar against the euro dollar, or the Aussie dollar against the New Zealand dollar (8:46, 9:12). He says he wants to be in the one with the higher premium at the time, and that he does not care that the S&P made the lower low for the SMT (9:34, 9:49). The comparison is an analogy he states, not a tested screen: no measurement of how often it works is offered anywhere in the recording.
ICT Index Futures Entries and Exits
On the one-minute Nasdaq chart he builds the intraday story from a shaded down-close candle that he reads as a bearish breaker – price trades into it, outside its range, then right back into the lower portion of that range – and notes relative equal highs taken out in the afternoon (13:15, 13:43). He also says he saw nothing in the S&P that morning that he wanted to participate in (13:48).
He then describes a counterfactual on the Nasdaq that explains why he treated one area as a short rather than a long. Had price not already traded to the high end of the daily shaded rectangle, he says he would have used that inefficiency to go long and reach for the high of the daily inefficiency; because it had already been reached, the inefficiency on the other side became what he calls an inversion fair value gap (13:57, 14:17, 14:52).
He says the candle bodies respected consequent encroachment – half of that inefficiency – and price accelerated down to sell-side and into the inefficiency. That, he says, was his first trade on the framework (15:03, 15:11). The later run-up he calls a nice Silver Bullet short attacking sell-side on both sides and the bullish breaker level below, and says that is where he got his second exit (15:16, 15:31).
Two qualifications in the same stretch matter for anyone reading this as a trade log. He says he was asleep during one of the moves he walks through and would have been “all over it” had he been awake (10:26), and later that he was away from the charts when price ultimately went higher (15:37). Earlier he describes using a bearish order block so that price dropped into a level that gave him what the captions render as his “second exit or short” (10:38, 10:47), and separates mean threshold – the midpoint of a down-close candle – from consequent encroachment, which he says applies to a wick or a gap (11:06). He then notes consolidation accelerating, taking out a high and producing what he calls a Silver Bullet at two o’clock, with a stop that he says would sit below that candle (11:42), before price fell just short of a high he highlights from two time frames up (11:54).
ICT Index Futures Closing Outlook
He closes the market discussion with a conditional: if price gets back below the consequent encroachment of the Nasdaq’s daily inefficiency, he says he will resume being bearish, because at that moment he calls it consolidation to modestly bullish on an intraday basis (12:30). He adds that he is waiting for evidence of a longer-term short on the daily chart, and that those swing models take time to develop and can produce a series of up-close candles before the setup forms (12:50). That is where the transcription-grounded part of the review ends: the last thing he states about the account is that he only did a little work on the Nasdaq, did not touch the S&P, and was able to add another 2,600 to the live account, which he says he showed in a screenshot on Twitter (15:43).
What the ICT Index Futures Review Establishes
What the recording supports is that ICT said these things on this date about this session, in this order, and that the timestamp links above mark where. The framework vocabulary – daily imbalance, consequent encroachment, SMT, inversion fair value gap, Silver Bullet, mean threshold – is his own and is quoted here as the automated caption track renders it; several of those terms are mangled in the captions and the numbers are not reliable enough to reconstruct.
What it does not establish is the trading itself. There is no order ticket, fill, statement or risk figure anywhere in the recording, and no chart values are legible, so the two exits, the entries he describes and the reported 2,600 addition are his own retrospective account rather than verified results. He also says he slept through one of the moves he narrates and was away from the charts later, which makes the recording an incomplete record even of his own day. Nothing here should be read as a recommendation to copy the sequence, and no part of this method has been tested for this article.
Watch the ICT Index Futures Recording
Watch the original recording on YouTube
This video cannot be played inside another website. Its embedded player was loaded and clicked from a BestProps page on 15 September 2026 and reported “Video unavailable. Playback on other websites has been disabled by the video owner.”, staying on a “Watch on YouTube” prompt with no playback progress, while the public watch page plays normally. That is why there is no inline player here.
Watch ICT Mentorship 2023 – August 21, 2023 Index Futures Review on YouTube ↗
The recording runs about sixteen minutes and is the only primary source used for this article. The channel is The Inner Circle Trader on YouTube.
ICT Index Futures Resources
These are the sources checked for this article. The CME Group page is the exchange specification for the Nasdaq-100 futures contract referenced in the review, and the two CFTC pages are general regulator material on hypothetical trading-system results and on retail forex fraud. None of them assesses ICT, this session or the figures he reports, and none verifies his account outcome. Copies, notes and indicator bundles derived from his material circulate outside his own distribution and were not tested here.
- [1] ICT Mentorship 2023 – August 21, 2023 Index Futures Review – The Inner Circle Trader (primary source; watch page read 15 September 2026, 16M13S)
- [2] CME Group – E-mini Nasdaq-100 Futures Contract Specs (the exchange specification for the contract in the review; checked 15 September 2026)
- [3] CFTC Learn & Protect – Forex Frauds (states that two out of three retail foreign exchange traders lose money each quarter; read 15 September 2026)
- [4] CFTC – Fraud Advisory: Commodity Trading Systems Sold on the Internet (on how hypothetical or simulated results are presented as performance; read 15 September 2026)
This is independent educational commentary on one sixteen-minute session review. It is not official ICT material, it is not a tested trading system, and it is not investment advice. The trade descriptions, the 2,600 figure and the account comments are the speaker’s own spoken account of his own trading and are not verified here. Index futures trading with leverage involves substantial risk and is not suitable for everyone.
