
Key takeaways
The Inner Circle Trader’s roughly eleven-minute YouTube review examines ES and NQ futures on 16 August 2023 using weekly liquidity, bearish daily bias, Power of Three, fair value gaps, consequent encroachment, order blocks, balanced price ranges and market-structure shifts.
Read the full summary
The Inner Circle Trader’s roughly eleven-minute YouTube review examines ES and NQ futures on 16 August 2023 using weekly liquidity, bearish daily bias, Power of Three, fair value gaps, consequent encroachment, order blocks, balanced price ranges and market-structure shifts. ICT says an early rally above the open acted as deceptive manipulation before both contracts sold off, with an hourly ES inefficiency framing the high and candle bodies remaining near marked zones despite wick overshoots. He links the afternoon acceleration to the 2 p.m. FOMC minutes, says ES took 4424 and identifies 14,853.5 as his NQ objective, though the recording shows no orders, fills, account values or verified outcome. He advises retaining hourly and 15-minute PD arrays on five-minute charts, attaching time-stamped public observations to candles, and journaling in a tape-reading setting rather than using a demo, funded-account challenge or live funds. Auto-generated captions garble several proprietary terms, and the article treats all levels and claims as unverified educational commentary rather than evidence of predictive accuracy or profitability.
How we researched this article
BestProps used document-based research from primary firm sources, checked September 24, 2026. The complete source list, scope, limitations, and commercial-state record appear near the end of this article.
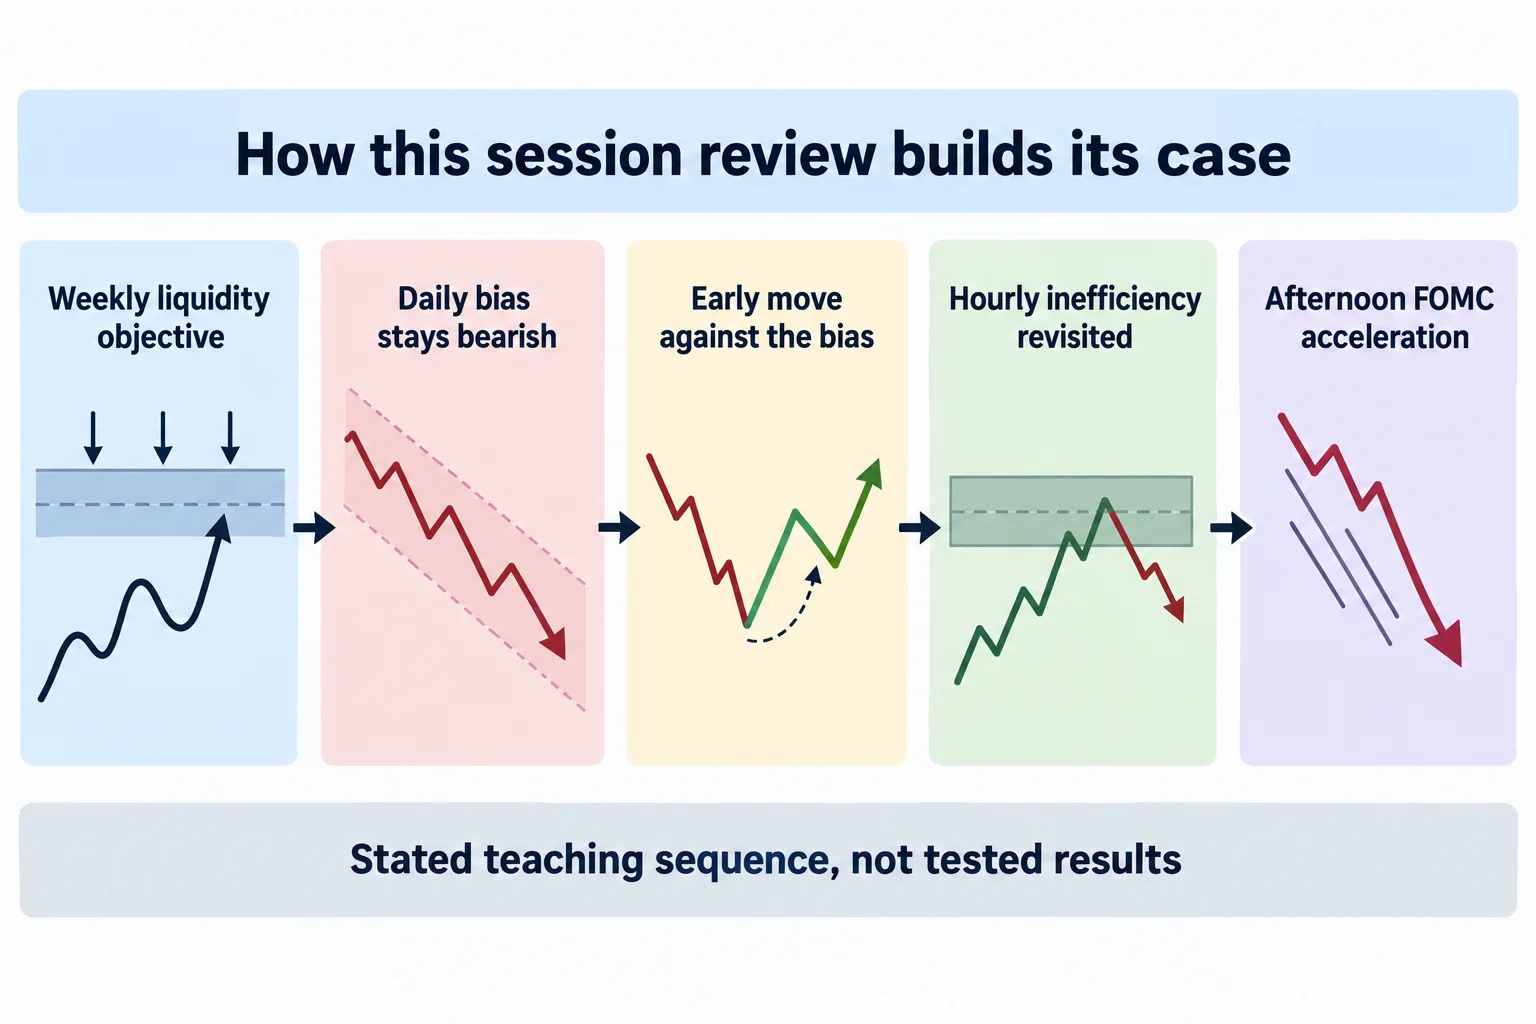
This lesson reviews intraday price action in S&P 500 (ES) and Nasdaq (NQ) futures through ICT’s concepts of daily bias, liquidity, imbalance, displacement and market structure. The discussion moves from daily and hourly charts down to 15-minute and five-minute views, with particular attention to the price action surrounding the release of FOMC minutes.
The primary source is ICT Mentorship 2023 – August 16, 2023 ES & NQ Futures Review. The public watch page shows a publication timestamp of 16 August 2023, 18:44 Pacific time, which is 17 August in UTC; the inventory date for this recording is the UTC day, not a different session. The auto-generated transcript records ICT’s own interpretation of the session; it does not independently establish predictive accuracy or reveal executions, fills or later results.
ICT Mentorship Daily Bias and the Initial Reversal
ICT opens at 0:13 on the ES and NQ daily charts and says both had run outside an imbalance, traded up into an opposing swing and then traded lower, which he says is what the previous night’s review called for. At 0:46 he sets out his top-down process: look for a weekly liquidity draw, let it frame a buying or selling program, and then wait for the intraday pattern to develop each day. For this session he says he had been bearish on both S&P and Nasdaq, which means the open should sit near the day’s high.
The terminology here is the weakest part of the transcript. The captions render the same swing label three different ways across the recording (“due to swing” at 0:33, “judo swing” at 1:09 and “Juda swing” at 7:02), so the exact word is not recoverable from the captions. Its meaning is not in doubt, because he glosses it himself at 1:09 as “a fake rally to entice traders to chase that going long and then aggressively trading lower.” The captions also render his phase label as what sounds like “power 3” at 0:59, which corresponds to the “Power of Three” framing he uses elsewhere. Both should be checked against the audio before being quoted.
Under that framing, the open would be relatively near the day’s high, with the early rally serving as the manipulation phase before downward distribution, and he identifies sell-side liquidity beneath the market as the intended draw in both contracts. These are ICT’s market interpretations, not independently validated rules.
ICT Mentorship August Price Action and Hourly Inefficiencies
On the hourly ES chart at 1:41, ICT points back to a shaded area he had flagged in passing the night before. He describes the sequence as a move up into the top of that range, a break lower, a shift in market structure, a rally back into a fair value gap, and then the marked area being revisited at 1:58 in a way that he says framed the daily high.
He also makes a point about candle bodies. At 2:16 he notes that while wicks moved well beyond the marked zone, the bodies stayed close to it, and at 2:25 he remarks that August tends not to deliver as cleanly as other months. This is the practical takeaway of the section: in his reading a zone is not invalidated merely because an intraday wick passes through it, because he weighs the relationship among bodies, wicks and previously marked imbalances rather than treating the zone as an exact line.
For NQ from 2:58 he walks through a Nasdaq trade up into consequent encroachment, a break lower, a further consecutive encroachment, an order block and a fair value gap, again pointing at where the bodies sat. He is explicit that this is not ordinary support and resistance: at 3:24 he answers commenters who say his work is nothing more than support and resistance by arguing that a level called in advance and then delivered is a different exercise from labelling levels afterwards. That is a claim about method, not a demonstration of it. At 3:55 he labels the resulting structure a balanced price range and describes price hitting the area “like a brick wall” and selling off.
One caution on terminology: “consequent encroachment” is his own label and this recording does not spell out its definition. The article does not assert a definition the source does not give.
ICT Mentorship 2023 FOMC Move on 15-Minute Charts
The 15-minute comparison starts at 4:32. On ES, ICT says price went straight up into the shaded area he had described the night before and then broke lower with a shift in market structure, and at 4:45 he calls that sequence an instance of the model he taught in his 2022 mentorship series.
He ties the afternoon acceleration to the 2:00 p.m. FOMC minutes release at 4:18, and at 5:00 he says the market took out the 4424 level on ES that he had mentioned publicly. On NQ he points to a fair value gap and to the high and respective low of a Monday 10:00 a.m. hourly range at 5:07, then describes price trading up into a second gap during the FOMC window and selling off aggressively. At 5:56 he says he was looking for 14,853.5 on Nasdaq.
He mentions 14,853.5 as an NQ objective before and after this discussion, and he repeats it in the five-minute section at 6:01. Because the recording only captures his contemporaneous expectation, the transcript alone does not establish whether that objective was reached, and the 4424 reference is likewise only what he says he had mentioned. No orders, fills or account values appear anywhere in the audio.
ICT Mentorship Higher-Time-Frame Chart Notes
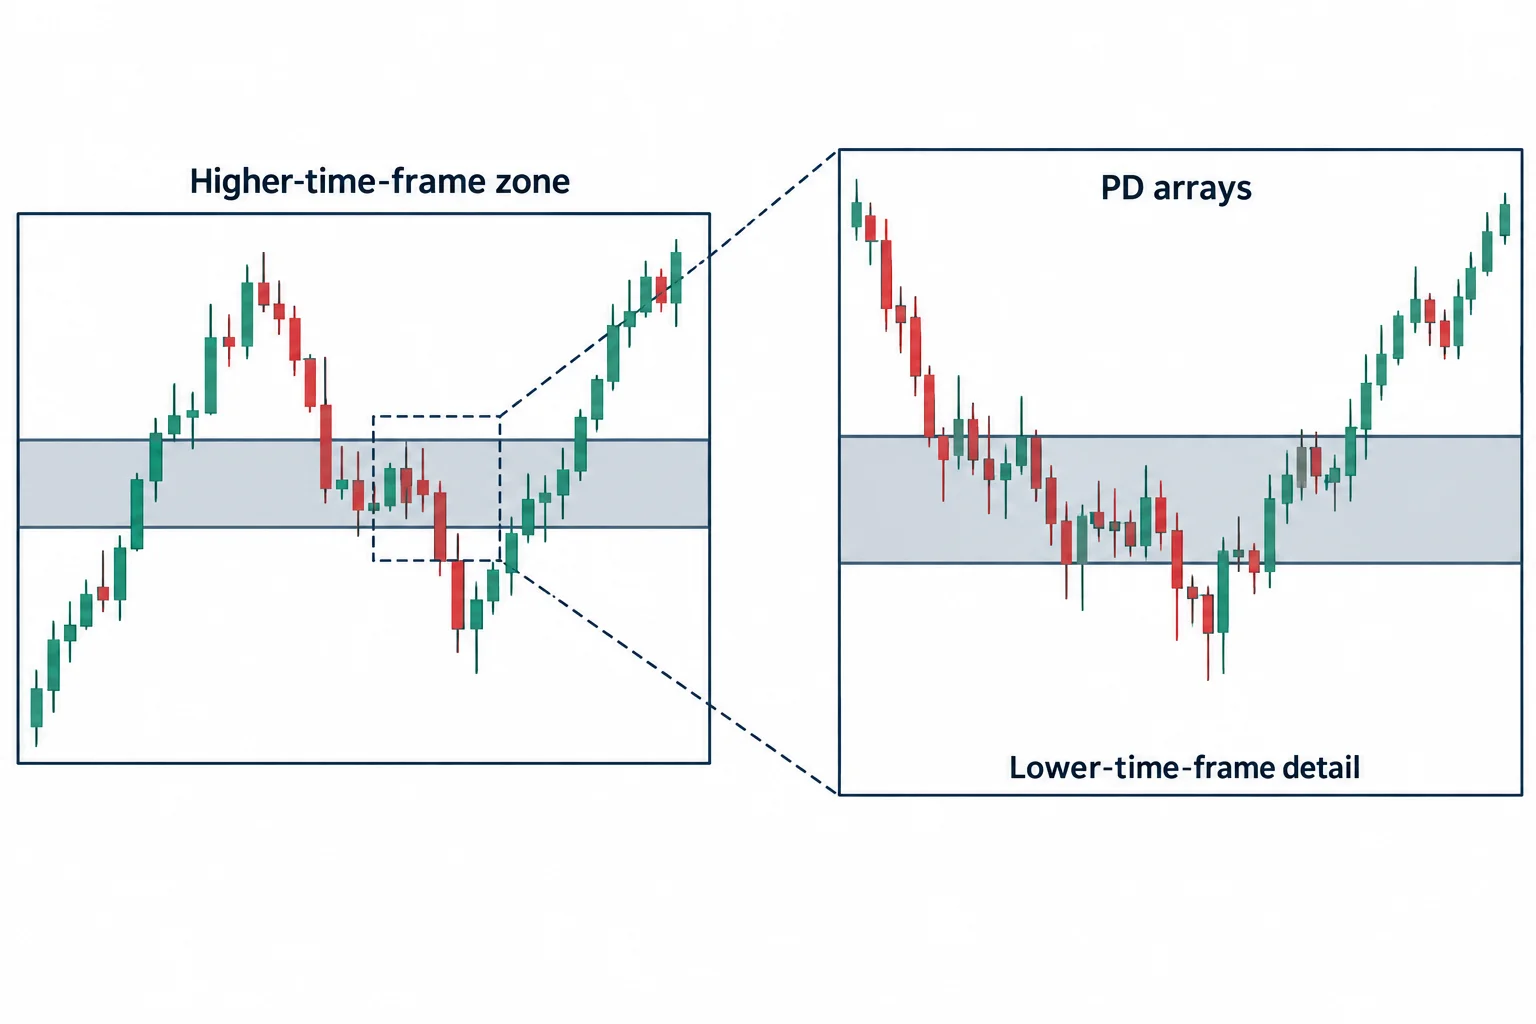
At 6:04 the lesson moves to five-minute charts. ICT notes that an inefficiency that is obvious on a 15-minute chart becomes hard to see after dropping to five minutes, and at 6:28 he says keeping higher-time-frame “PD arrays” on the chart is important or you lose yourself in the candlesticks.
He also notes that he was asleep through the afternoon Silver Bullet window at 6:08, and at 6:43 he says the bodies formed inside a Monday 9:30 a.m. low and a Sunday 11:50 p.m. low, which he describes as sell-side draw-on-liquidity levels he had mentioned that morning. The broader educational point is that timeframe compression removes context: a dense five-minute chart shows many local swings, but previously marked hourly or 15-minute areas are what explain why he treats some reactions as more relevant than others.
ICT Mentorship Journaling Before Futures Trading
The final portion shifts from chart review to study habits. From 8:47 he asks viewers to follow him publicly, pull up his posted levels and paste them onto their own charts so the comment sits attached to the candle from the time it was made, and then to judge for themselves whether the level was visible beforehand. He is also candid that he posts celebratory reactions when levels are reached, and his stated reason is to give students a memorable milestone for their journals rather than to build a track record.
At 9:56 he recommends journaling what is visible, and then studying in what he calls a tape-reading setting: at 10:06 he says explicitly that this means not a demo, not a funded-account challenge, and not live funds, and that the understanding has to build over the longest part of the learning curve. He argues at 10:40 that what he teaches is linked to time and that price runs are linked to a time-delivery mechanism, and at 10:53 he concedes unexpected geopolitical or war-related events as the exception to his “nothing’s random” position.
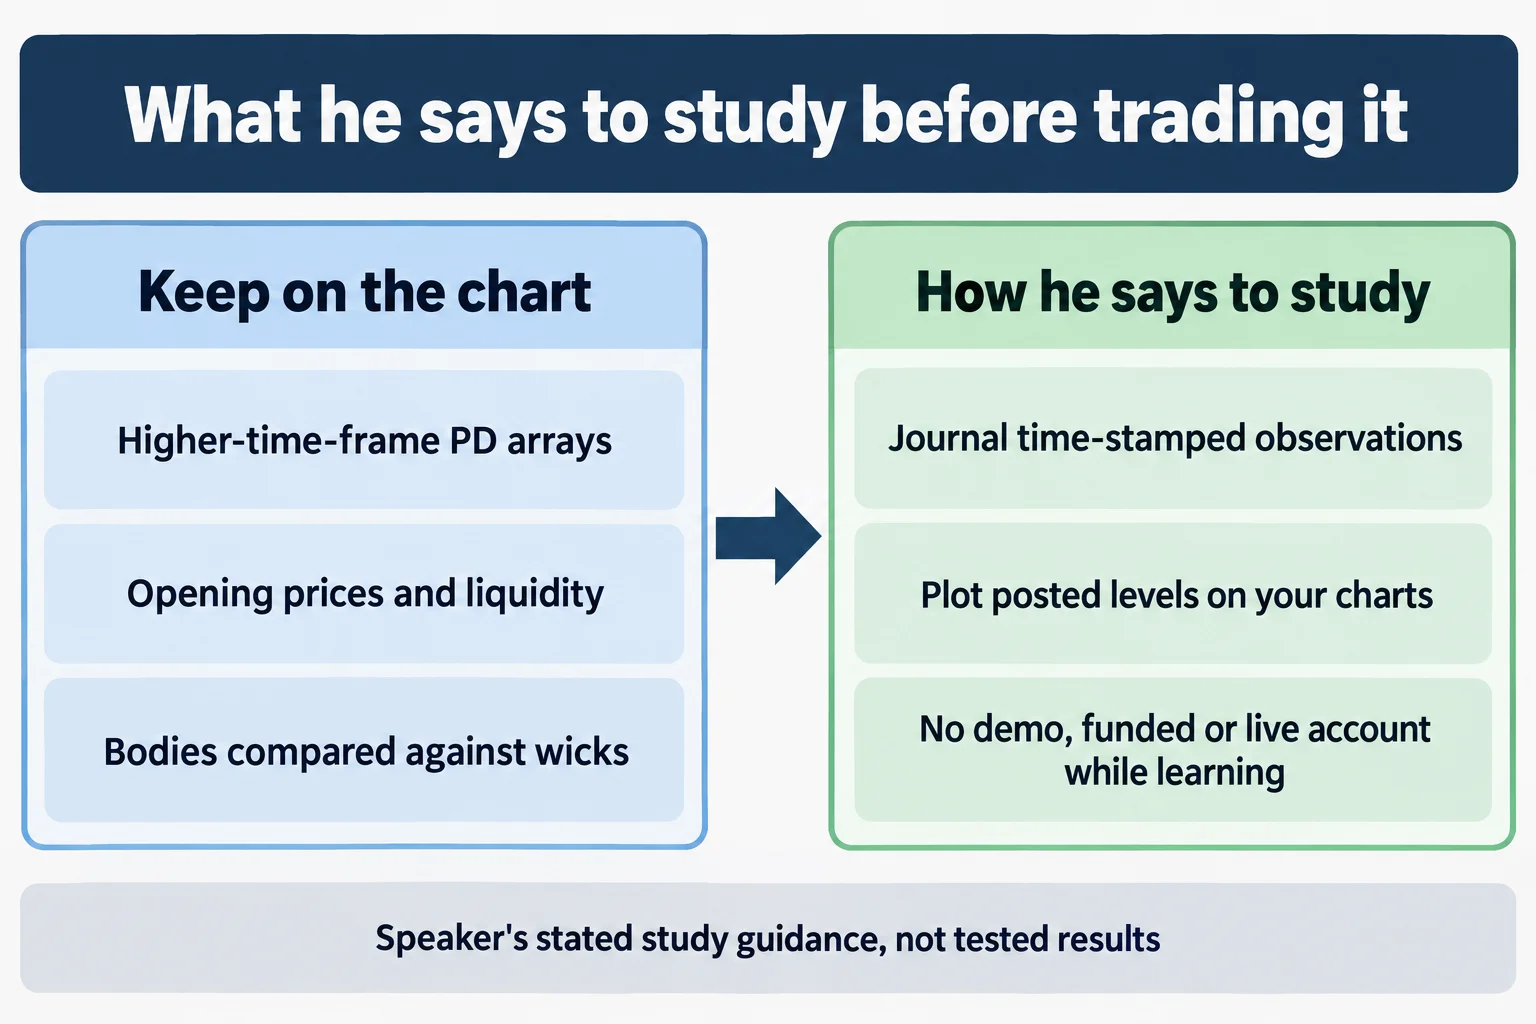
Those are ICT’s conceptual claims. The recording does not present statistical evidence that markets are non-random, that these levels are identifiable in advance in general, or that the method is profitable, and it should not be read as proof of any of them.
ICT Mentorship 2023 Study Checklist
- Establish the claimed higher-time-frame bias before examining intraday candles.
- Mark opening prices, liquidity references and higher-time-frame imbalances.
- Observe whether the first move supports or opposes the proposed daily bias.
- Compare wicks with candle bodies rather than treating every zone as an exact line.
- Record time-stamped observations without assuming a chart pattern guarantees an outcome.
- Verify terminology against the video: the automatically generated captions in this recording contain recognition errors in his swing and phase labels.
Watch the ICT Mentorship August Recording
Watch the original recording on YouTube
The video cannot be played inside another website. When its embedded player was loaded and clicked from a BestProps page on 15 September 2026, the player itself reported “Video unavailable. Playback on other websites has been disabled by the video owner.” and stayed on a “Watch on YouTube” prompt with no playback progress at all; the public watch page plays normally. That is why no embed is left here.
Watch ICT Mentorship 2023 – August 16, 2023 ES & NQ Futures Review on YouTube ↗
The recording runs about eleven minutes and is the only primary source used for this article. The captions used here were generated automatically by YouTube, so the wording of ICT’s terms is not authoritative. The channel is The Inner Circle Trader on YouTube.
ICT Mentorship 2023 Futures Resources
These are the sources checked for this article. The CFTC and Investor.gov pages are general regulator and investor-education material, on leveraged foreign-exchange fraud, on trading systems sold online, and on what leverage is. They are not assessments of ICT or of anything said in the recording, and none of them verifies the levels or objectives he names here. Third-party copies, notes and indicator bundles derived from his material circulate outside his own distribution and were not tested here.
- [1] ICT Mentorship 2023 – August 16, 2023 ES & NQ Futures Review, The Inner Circle Trader (primary source; watch page read 15 September 2026, 11M17S)
- [2] CFTC Learn & Protect, Forex Frauds (read 15 September 2026)
- [3] CFTC, Fraud Advisory: Commodity Trading Systems Sold on the Internet (read 15 September 2026)
- [4] Investor.gov, Glossary: Leverage (read 15 September 2026)
This is independent educational commentary on one market review. It is not official ICT material, it is not a tested trading system, and it is not investment advice. Index futures and leveraged trading involve substantial risk and are not suitable for everyone.