
Key takeaways
In ICT Mentorship 2023 – August 14, 2023 NQ Futures Review, an 18-minute Monday recap of the September 2023 Nasdaq futures contract, ICT’s central practical point is a chart-settings one: the Friday, August 11 opening-range gap is only visible with regular trading hours toggled on, so he annotates it there, extends its high and low,…
Read the full summary
In ICT Mentorship 2023 – August 14, 2023 NQ Futures Review, an 18-minute Monday recap of the September 2023 Nasdaq futures contract, ICT’s central practical point is a chart-settings one: the Friday, August 11 opening-range gap is only visible with regular trading hours toggled on, so he annotates it there, extends its high and low, then toggles back to electronic trading hours with the annotation left on (4:57, 5:03). He corrects his own real-time commentary in the recording, saying the fair value gap he tweeted about was a five-minute formation and not a two-minute one (7:21), and says annotations that look misaligned across time frames are anchored to the higher time frame rather than being different candles (11:03).
How we researched this article
BestProps used document-based research from primary firm sources, checked September 24, 2026. The complete source list, scope, limitations, and commercial-state record appear near the end of this article.
This is a retrospective explanation of ICT’s market interpretation on one session. It is not evidence that the concepts predict prices or produce profitable trades, and the recording contains no chart values, order tickets or account statement. The captions are automated and mis-render much of his vocabulary, so terms are quoted as the captions have them rather than corrected silently.
Higher-time-frame context
He frames the scope in the first seconds: a quick review of the September 2023 delivery contract of Nasdaq futures (0:14). He begins with the overnight London session and says there was “a little bit of a rejection” on Friday’s low, then describes price trading up into what he calls a premium wick, naming the midpoint of that wick consequent encroachment and telling viewers to work it out themselves with a Fibonacci tool (0:24, 0:39). He also notes that the futures day on his chart begins at 6 p.m. (0:51).
On the four-hour chart he marks relative highs as an area where liquidity is resting, says price traded into a daily order block, notes a shift in market structure he will examine on lower time frames, and describes an aggressive move into the close (0:59, 1:03). On the hourly chart he identifies what the captions render as a “city” and then spell out in full as “a sell Side imbalanced by sine and efficiency” – the sell-side imbalance/buy-side inefficiency he then references at the highs and lows of that hourly range (1:27). In the same stretch he walks a sequence of a lower low, sell side taken, buy side taken “extremely aggressive” through those highs, then a trade back down that did not take out the prior low (1:49).
On the 15-minute view he points out that the two levels there are the hourly imbalance’s high and low carried down, and that they do not look like an imbalance on the smaller chart because multiple candles are involved – so he steps back up one time frame to show where they are anchored (2:09, 2:46).
The RTH versus ETH opening-range gap
At 2:58 he switches the same 15-minute chart to regular trading hours and points to a yellow box he identifies as the Friday, August 11, 2023 opening-range gap, saying such gaps can only be seen with RTH toggled on (3:31). His reading of it is that price traded around inside that range on Friday but left part of it open, and that the algorithm refers back to the gap rather than filling and forgetting it (3:48).
Then he flips to electronic trading hours to make the contrast explicit: same imbalance boundaries, same 9:30 Friday start to the opening-range gap, but no gap is visible, because overnight trading occupies that part of the chart (4:39, 4:48). His stated procedure is to refer to the gap on the RTH view, annotate it there, then toggle back to ETH with the annotation left on the chart (4:57, 5:03). He also notes that one hourly imbalance is visible on both session templates, unlike the gap (4:28).
The morning sequence and his own correction
He walks the morning from relative equal lows, which he says were pierced to take sell-side liquidity, into a discount wick whose midpoint he again calls consequent encroachment, and says price hit that level at the 9:30 open without taking out the low, followed by a market-structure shift and an energetic run (5:12, 5:18). He describes a drop that looked like a bull flag, says he marked the lowest down-close candle as a rejection block, and ties his willingness to hold the low to the market-structure shift rather than to the level alone (5:33, 5:47).
He corrects himself on camera at 7:21: he says that while tweeting he called a fair value gap a two-minute formation when he was actually looking at a five-minute chart. He repeats the apology later and says that even setting the miscall aside, the context was the same (16:53). That is his own correction, reported here as he states it.
The levels he names in this stretch are 15,138, which he says was Friday afternoon’s buy side, and 15,167, which he emphasises as the main upside reference; he also says he is working from Friday’s price trading rather than Sunday’s highs, while allowing that using Sunday’s highs is not wrong (7:45, 7:53, 8:01). He says Monday morning’s relative equal highs formed around the seven o’clock hour and that the session traded off the five-minute fair value gap, then rallied to create the high of the breakaway gap and reached the 15,167 buy side (8:20, 8:39, 8:48). The numbers are spoken claims in the review; the captions do not show the chart’s tick data and nothing here verifies an execution at those prices.
Two of his aside comments are worth keeping because they qualify how he presents the material. He says he eventually took out that buy side, that he made no mention of it at the time, and that the hourly high was not traded until after the day session ended (9:06, 9:25). And he calls what follows an “immediate rebalance” signature – one he says he has been getting a lot of feedback about, and which he describes as one of the strongest signatures he looks for when he has his bias and the time of day aligned (9:32, 9:54). That is his enthusiasm about the pattern, not a measured result.
Why the annotations look different on lower time frames
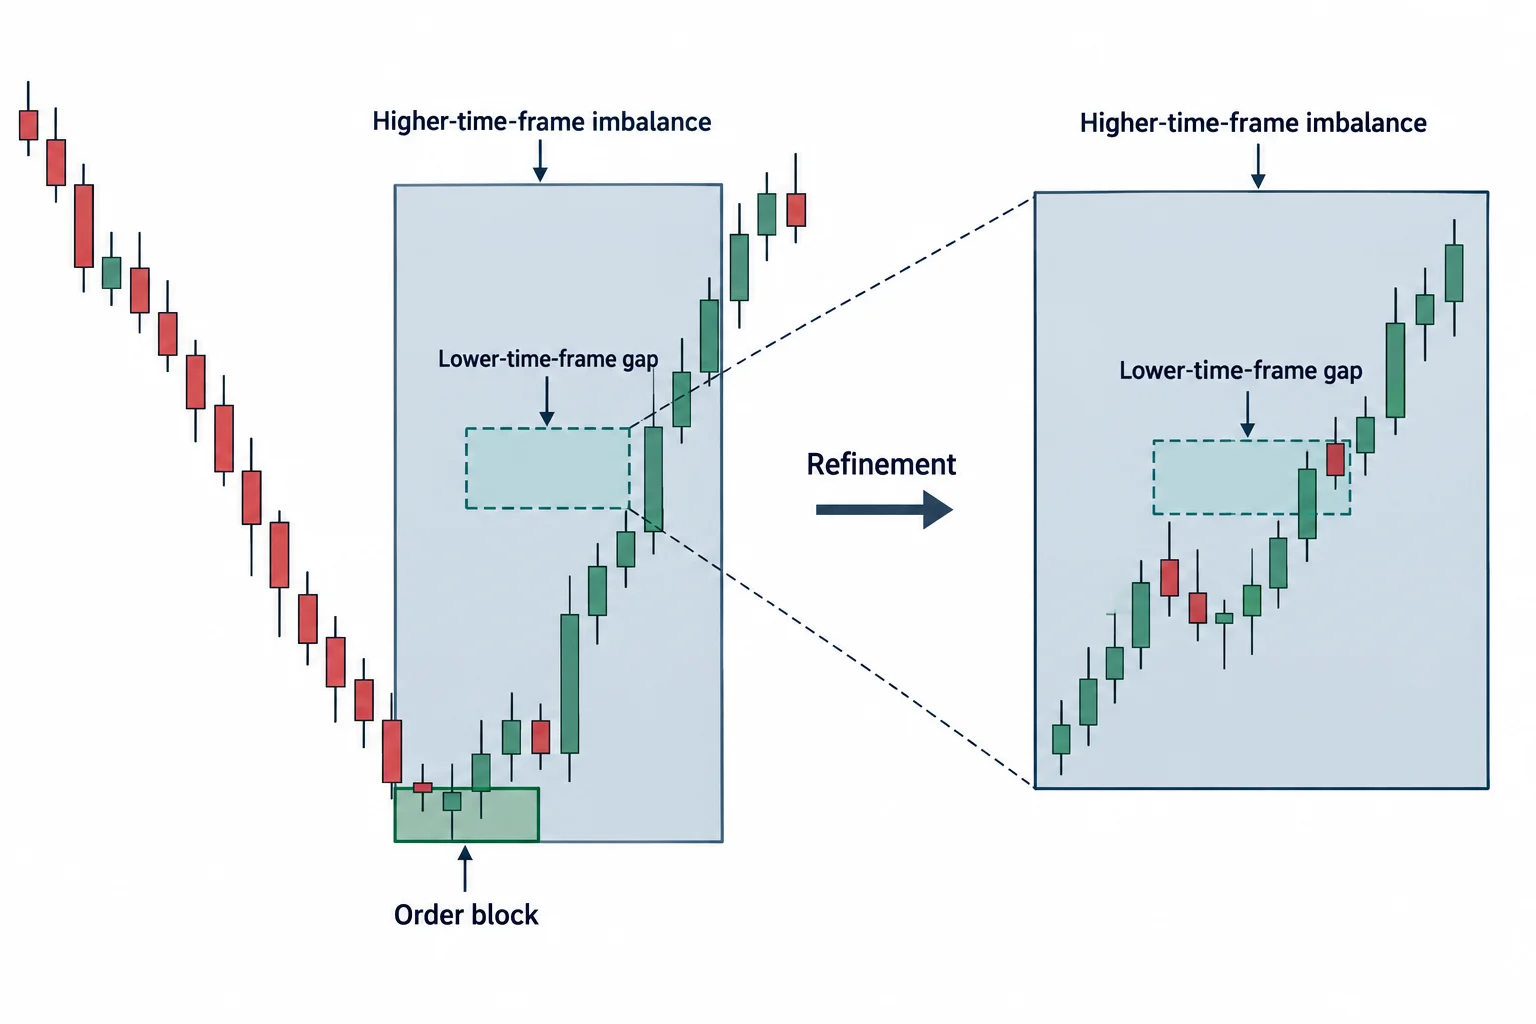
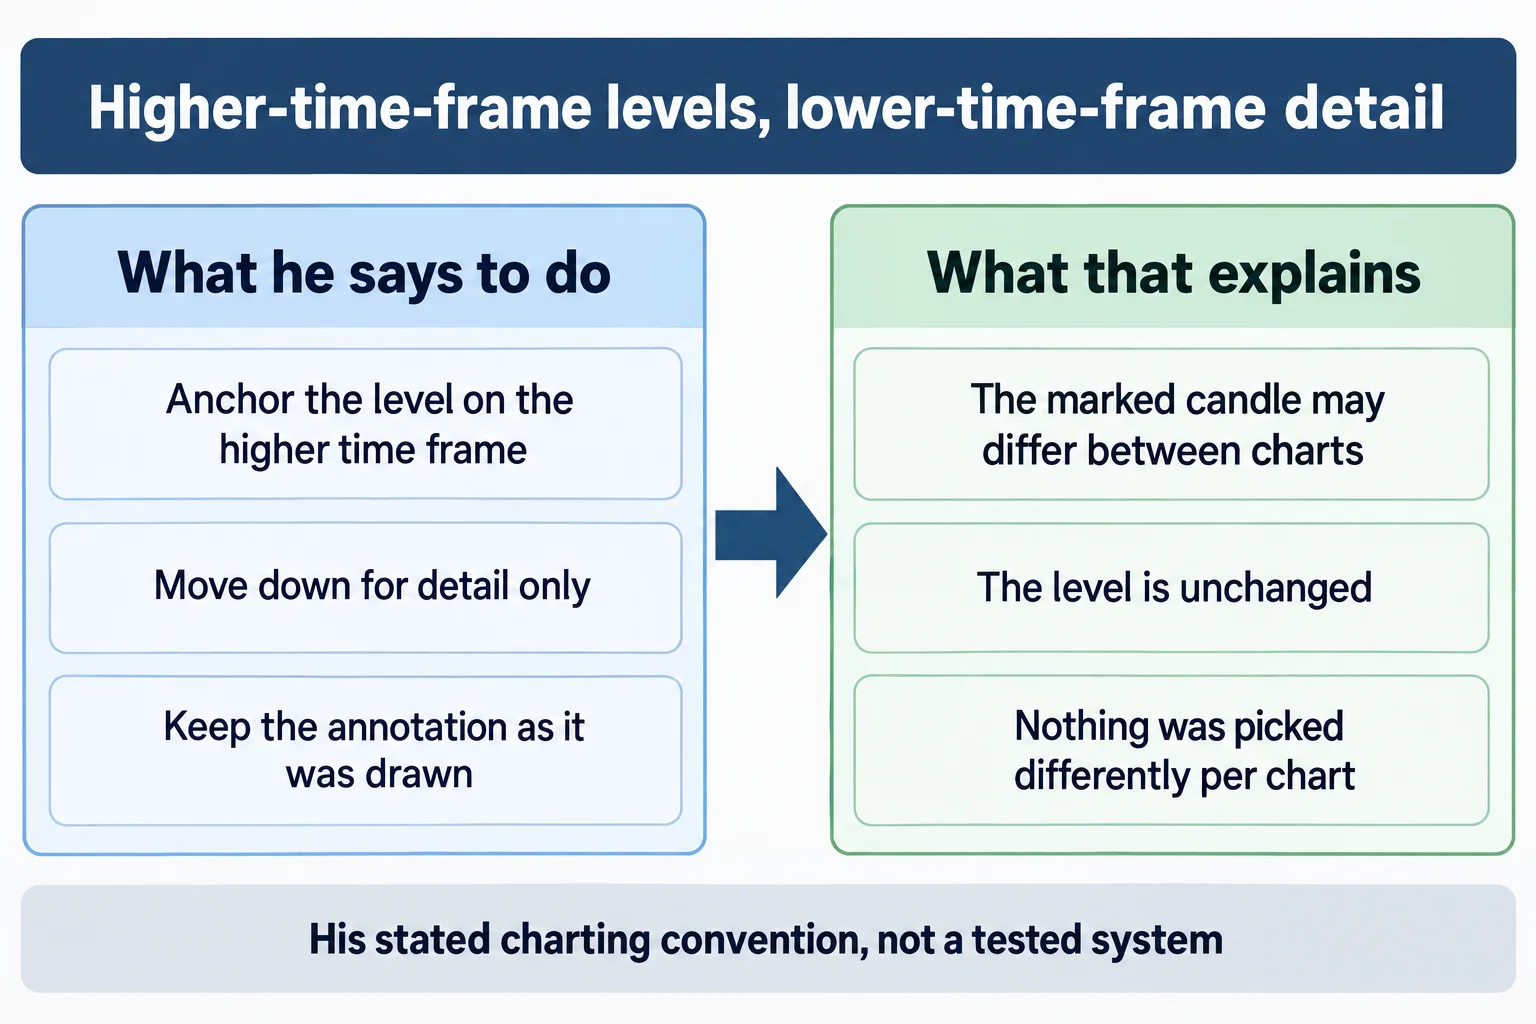
From 10:16 he addresses the question he says he gets in older videos – why a marked order block is not the lowest down-close candle a viewer would pick. His answer is that he is drawing attention to a specific time frame and that the annotation may be anchored to a higher one, so it will look different as he moves down; he adds that this is not picking different candles or hiding anything (10:38, 11:03). His stated approach is to keep the arrays anchored on the higher time frame and use the lower ones to refine accuracy (11:21).
He then applies it: the five-minute gap he points to at 11:39 sits inside a larger 15-minute imbalance, and there is a small pocket of inefficiency at the bottom end of that larger imbalance between one candle’s high and the next candle’s low. He says that if the candles had already traded to that level, he would have needed only the small pocket and it would not have been sufficient for him to look for a long entry in sync with the afternoon using the lunch macro (12:26, 12:39). His own condition on the setup is stated, not demonstrated.
The lunch sequence he narrates: bodies respecting the 15-minute imbalance again, price trading down into the August 11 opening-range gap and treating it as support, then a further wick outside the inefficiency high and an immediate rebalance on the 15-minute view before a move up into the imbalance level after market hours (12:48, 12:55, 13:46, 13:52). He frames the whole idea as an “x-ray view” of price action that the algorithm is watching and most people are not, and defends the point about gaps with an authorship claim – he says he did not invent gaps but the logic he teaches for them (13:01, 13:21).
The one-minute recap and the afternoon
On the one-minute chart he revisits a small gap he says he flagged in real time, a drop that took sell-side, a rally with a market-structure shift and a bullish order block, and a further gap he also called live (14:03, 14:25, 14:45). He ties the read to the two buy-side numbers: pointing out 15,138 and 15,167 and then saying “watch this fair value gap” is, in his description, what makes that gap an inversion fair value gap (14:52, 15:15).
He describes price rallying into relative equal highs going into the lunch hour, dropping to take sell-side, repricing to the low of the imbalance, and treating the lower band of levels as “a perfect area to go long” to run back into the buy side, adding that this is in fact what happened (15:20, 15:36, 15:46). He reports it stopped short of the highs to make what he calls a triple top that is “absolutely poison”, says retail traders will read that as strong resistance, then has price drop back to the imbalance high, touch the old Friday opening-range gap high one more time for a “kiss goodbye”, give an immediate rebalance and head higher into the last hour (15:51, 16:04, 16:11). The triple-top description and the retail-trader claim are his interpretation of what the chart was doing, not an observed order-flow measurement.
He then shows the tweet he references at 16:19, repeats the two-minute versus five-minute mistake, and states the conditional that frames the whole day: had the market failed to reach his levels, all the focus would have gone down to 15,020, but because it did reach them, he says 15,020 was not likely and price would keep drawing higher (17:04).
For the last portion of trading he identifies the two o’clock to three o’clock window he calls a Silver Bullet, says the entry is right there, notes that the buy side had not yet been taken at that point, and describes the gap being reclaimed, traded back into, finding support, and a further move creating another fair value gap with what the captions render as an “institutional order for entry drill” and volume imbalance between two candle bodies (17:16, 17:22, 17:38). He closes by saying the final hour’s market-on-close macro sent price into buy-side liquidity and produced an immediate rebalance with an order block and a fair value gap, aiming at the hourly imbalance low, which he says was reached after four o’clock (17:49, 18:00, 18:10).
What this review does and does not establish
What the recording supports is that ICT said these things on this date about this session, in this order, and that the timestamp links above mark where. It also shows him correcting his own public comment about the two-minute gap, which is a useful reminder that the real-time annotation and the later review are not the same document.
What it does not establish is that any of it predicts price. There is no chart data, order ticket, fill or risk figure anywhere in the recording, so the entries, the “perfect area to go long” and the session’s outcome are his own retrospective narration rather than verified results. The level numbers, the triple top and the algorithm references are his interpretation of his own charts. Nothing here is a recommendation to copy the sequence, and no part of this method has been tested for this article.
Watch the original recording
Watch the original recording on YouTube
This video cannot be played inside another website. Its embedded player was loaded and clicked from a BestProps page on 15 September 2026 and reported “Video unavailable — Playback on other websites has been disabled by the video owner.”, staying on a “Watch on YouTube” prompt with no playback progress, while the public watch page plays normally. That is why there is no inline player here.
Watch ICT Mentorship 2023 – August 14, 2023 NQ Futures Review on YouTube ↗
The recording runs about eighteen minutes and is the only primary source used for this article. The channel is The Inner Circle Trader on YouTube.
Resources
These are the sources checked for this article. The CME Group page is the exchange specification for the Nasdaq-100 futures contract referenced in the review, and the two CFTC pages are general regulator material on hypothetical trading-system results and on retail forex fraud. None of them assesses ICT, this session or the levels he names, and none of them verifies anything he describes. Copies, notes and indicator bundles derived from his material circulate outside his own distribution and were not tested here.
- [1] ICT Mentorship 2023 – August 14, 2023 NQ Futures Review – The Inner Circle Trader (primary source; watch page read 15 September 2026, 18M23S)
- [2] CME Group – E-mini Nasdaq-100 Futures Contract Specs (the exchange specification for the contract in the review; checked 15 September 2026)
- [3] CFTC Learn & Protect – Forex Frauds (states that two out of three retail foreign exchange traders lose money each quarter; read 15 September 2026)
- [4] CFTC – Fraud Advisory: Commodity Trading Systems Sold on the Internet (on how hypothetical or simulated results are presented as performance; read 15 September 2026)
This is independent educational commentary on one eighteen-minute session review. It is not official ICT material, it is not a tested trading system, and it is not investment advice. The level numbers, the trade descriptions and the session outcome are the speaker’s own spoken account of his own charts and are not verified here. Futures trading with leverage involves substantial risk and is not suitable for everyone.