
Key takeaways
ICT Mentorship 2023 T.G.I.F.
Read the full summary
ICT Mentorship 2023 T.G.I.F. Setup is a Friday-only, top-down study model for all assets that treats a retracement into the developing weekly range as a draw on liquidity rather than a reversal signal. After price reaches a higher-time-frame premium array, measure the week’s lowest low to highest high and mark 20% and 30% down from the high as the target band or sweet spot. Without that higher-time-frame objective being reached, price may continue higher and close at the weekly high. The June 2023 Nasdaq futures example uses a 15,475.50 weekly high, with 20% at 15,326.75 and 30% at 15,252.50, while moves to 40% or beyond 30% may suggest a larger reversal. ICT expects the retracement more often Friday afternoon after morning continuation, with the high potentially formed by a 9 o’clock Judas swing or around lunch through 2 o’clock, then uses hourly, 15-minute and one-minute order blocks, fair value gaps, breakers and rejection blocks as optional entries. T.G.I.F. defines the objective while the New York Silver Bullet limits entries to 2 to 3 p.m. ICT reports shorting 15 contracts at 15,357.00 and covering all at 15,280.00 with no partials, but the captions do not independently verify the chart levels, order, costs, position size or result.
How we researched this article
BestProps used document-based research from primary firm sources, checked September 24, 2026. The complete source list, scope, limitations, and commercial-state record appear near the end of this article.
In ICT Mentorship 2023 – T.G.I.F. Setup, published on 19 June 2023 and running just over 50 minutes, ICT introduces a day-specific model: at 0:28 he calls it a day-based algorithmic trading model that can be used on all assets, and at 0:47 explains that it therefore appears one day per week (Friday, hence the name).
The source used here is the manual English caption track for that recording, read in full. At 0:16 he opens by framing the lesson as a concept “near and dear” to him; what follows is his own method described over his own charts, and no chart coordinate, order or result in this article has been independently checked.
What the ICT T.G.I.F. Setup Measures
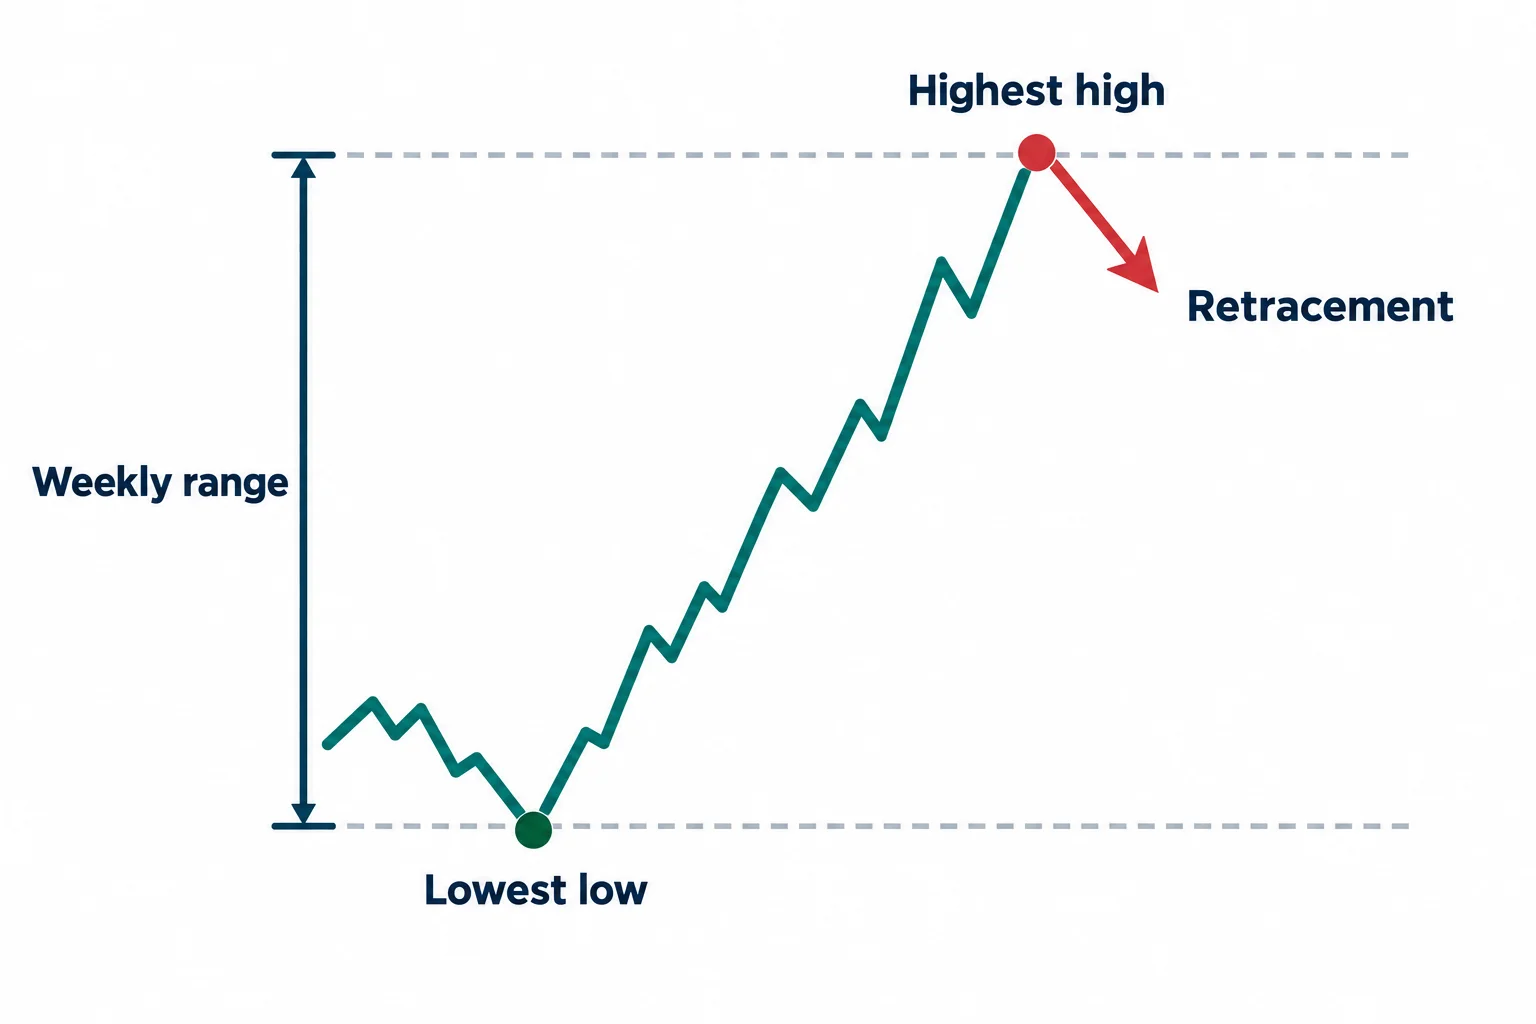
At 1:08 ICT states the characteristic of the pattern directly: a retracement into the current weekly range. He defines that range at 14:11 as the lowest low of the week all the way up to the highest high of the week.
He is also unusually careful about naming it. At 13:46 he says he does not want to call it a reversal pattern and admits he has “mistakenly” referred to it that way before, before conceding at 13:51 that it is reversal-like in one sense: in the last portion of Friday’s trading, if the retracement has not happened yet, he anticipates some measure of it into the weekly range. At 22:52 he says he will leave it to the reader whether to classify the result as an intraday reversal or a weekly retracement, since either description is defensible.
The direction in this lesson is one-way. At 1:42 he describes a premium distribution: the assumption is that the market has been going up, he is looking for a measure of exhaustion for the weekly range, and then a pullback into that range. He shows the mirror-image case exists. At 10:35 he says everything is reversible, so a bearish week would accumulate shorts and run down into a discount array, but the worked example and the whole walkthrough here are the bullish-week retracement.
Why the ICT Setup Starts With Higher Time Frames
The model begins away from Friday. At 1:30 ICT says the analysis is top-down and that the trade is “extremely precise” only if it is anchored against a higher-time-frame premium or discount array. On a monthly Nasdaq futures chart he identifies an imbalance at 2:28 and calls it at 2:57 a premium fair value gap on the monthly chart, formed after buy-side delivery in June 2023.
He then makes a point that explains why the analysis cannot be done on one chart. At 3:31 he says the same area does not look like a fair value gap at all once the chart drops to weekly, and at 3:34 he states the rule he works to: the hierarchy of his premium and discount arrays runs from higher time frame down to a lower time frame. At 12:25 he adds the practical reason (without the higher-time-frame levels drawn in, there is no way to judge what price is reaching for) and at 12:34 says that is why the majority of study time belongs on the higher-time-frame charts.
How Power of Three Shapes the ICT Setup
ICT connects T.G.I.F. to the weekly “Power of Three” he covers elsewhere. At 7:45 he switches the chart to an open-high-low-close bar and at 8:00 describes the bullish sequence: the open, a decline below the opening price, a rally that makes the high of the day, and a close near that high.
He names the phases at 8:36 (the accumulation phase below the opening price, and the manipulation as the open and the decline) and at 9:32 calls the move off the high into the close the distribution phase. At 9:51 he describes what he says that manipulation does: retail traders chase the move lower and then get “raked across the coals” as the market runs higher toward a higher-time-frame premium array.
Two qualifications matter. The first is that Power of Three is not tied to a weekly chart. At 11:16 he says it applies on every time frame, as long as the next draw on liquidity is known. The second is that it is described as reversible: the bearish version, he says, opens with accumulation of shorts and manipulation higher before the week works down into a discount array.
How the ICT Setup Defines the Weekly Range
At 16:55 ICT sets out the measurement. Take the week’s high and low and put a Fibonacci on the range; at 17:26 he says the 0.20 and 0.30 levels are what he is showing. In this example, at 17:51, he reads 20% of the range down from the high as 15,326.75 and 30% as 15,252.50; on the daily chart at 22:12 he puts the high of the week at 15,475.50. Those figures are his own readings of his own chart and are reported here as such.
At 18:08 he names the band between those two levels the “sweet spot” and says that is where T.G.I.F. will likely draw into. He immediately bounds the claim: at 18:18 he says there are times it can draw into 40% or more, but reserves that for a discussion of reversals and market tops or bottoms, and at 25:34 adds that a move beyond 30% could indicate a longer-term all-out reversal. This introductory lesson stays with the 20–30% zone.
When the ICT T.G.I.F. Setup Is Valid
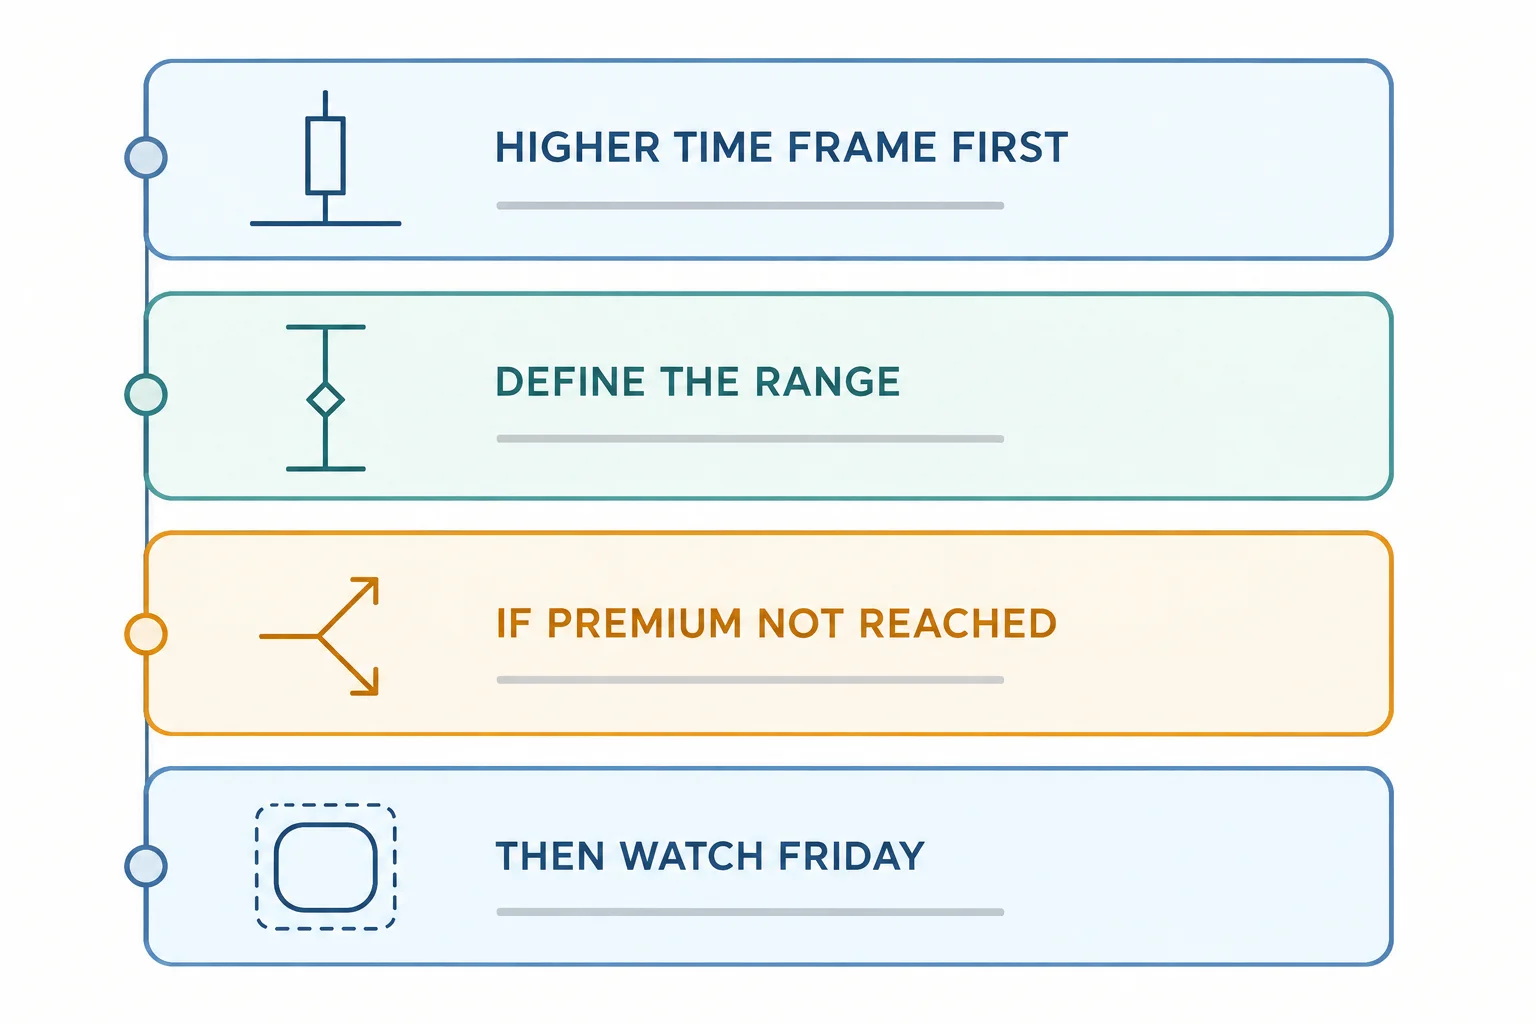
The most useful sentence in the lecture is a qualification, not a rule. At 15:30 ICT says the analysis requires that the market has reached a premium array; if it has not reached a higher-time-frame premium array, then it could continue into the close and close right on the high. At 15:48 he says that is precisely how to distinguish whether the pattern will form or whether price keeps going and closes on the high.
He reiterates the point at 20:22: the whole model rests on not anticipating a close right on the high, which is what makes a retracement somewhere between the 20% and 30% levels plausible. He also anticipates the objection that the example is selected after the fact. At 20:40 he says it will sound cherry-picked, and answers with long-term students who he says apply the same measurement to daily and weekly ranges. That is his claim about his audience; the caption track contains no evidence for it either way.
How Timing Confirms the ICT T.G.I.F. Setup
At 17:11 ICT says the pattern can appear in Friday’s morning session but is more likely in the afternoon, especially when the morning produced continuation higher. He then names two routes to the weekly high.
The first is at the open. At 26:44 he says the high formed around the 9 o'clock morning hour on Friday, and at 26:49 labels that initial run-up a Judas swing (a move that sucks traders into thinking it will keep going higher). At 27:59 he reads the break of an old high as buy-side liquidity, with relative equal highs as pending breakout orders that he says are used as counterparty to going short.
The second is midday. At 23:52 he says he can anticipate the high forming in the lunch hour or just before it, around 1:30 going into 2 o'clock, and at 24:52 repeats that expectation for between 1:30 and 2 o'clock. He then gives the test that decides between the two, at 46:38: if there was no Judas swing at 9:30 (if the market simply kept climbing without reversing), then he would expect the high to be created at lunch or going into 1:30 to 2 o'clock.
One detail in the recording dates the example. At 25:49 he notes that the day is a holiday with futures trading only until about 1 o'clock in the afternoon, and says that because of the shortened session he does not suspect the high of the week has been created yet. He also asks the audience at 3:56 to disregard an untouched candle representing the brand-new week, because he has no way of removing it from the chart, a reminder that the screenshot is being read at a specific point in time.
Lower Time Frame Models for the ICT Setup
From 23:38 ICT works down through hourly, 15-minute and one-minute charts, and the number of patterns he overlays is the point he returns to again and again. He identifies the last up-close candle before the displacement lower as his ICT order block at 28:50, insists at 29:00 that this has nothing to do with an “FU candle” or any engulfing pattern, and returns at 29:43 to the opening price of that candle as where the change in the state of delivery is made when price trades back through it. At 30:09 he labels the sequence a 2022 model.
Later in the same walkthrough he points to a bearish 15-minute order block at 35:14, a one-hour fair value gap at 36:13 (which the captions render only as a garbled fragment, so it is described here rather than quoted) and a breaker at 36:26. At 36:32 he asks the reader directly how many models he has shown and which one they would have taken, and at 37:09 tells them he is not trying to press them into one entry technique.
His own framing of what T.G.I.F. is, as distinct from those entries, comes at 30:43: he calls it a strategy you anticipate price delivering to (a draw on liquidity, nothing more) and at 38:29 says T.G.I.F. is not about finding the right array in the move, and that choosing the array is left to the reader. He also says at 41:44 that if you missed the ideal entry inside the fair value gap, participation is still possible afterwards.
Lunch Rejection Blocks in the ICT Setup
Two of the more specific ideas in the lecture concern what happens between the high and the 20–30% band. At 32:05 ICT says that because price has to traverse the lunch hour, the range is already defined and the candles in between are “time distortion” until the low is taken or the high is broken. At 34:05 he gives the mechanical reason he repeats: price does the same delivery more than once because it has to cross the lunch hour, and at 34:14 notes that the lunch hour has a macro that usually runs stops.
At 34:33 he describes small deviations outside the range as acceptable (at 40:31 stressing that candle bodies stayed inside the one-hour fair value gap while the wicks did the damage). Then, at 39:33, he defines a rejection block as the highest up-close candle prior to a high, extended to the right, and says at 39:41 that it does not need to be exceeded to function. He attaches rejection blocks to time distortion at 41:02 and warns at 41:09 that he will explain time distortion properly only later, and that others publishing on it “absolutely have no idea what they’re talking about.” That last remark is his characterisation of third parties, not a finding of this review.
The Silver Bullet Window in the ICT Setup
At 41:55 ICT drops to a one-minute chart, and at 42:06 points to the 2 o’clock candle before asking what he taught about that hour on index features. At 42:20 he identifies the 2:00–3:00 p.m. New York Silver Bullet, reading a high-low-higher-high reacting off an hourly bearish fair value gap, and at 43:01 describes a breaker and a fair value gap used for a short toward the 20–30% band. At 43:15 he ties the two ideas together: T.G.I.F. supplies the objective, and the Silver Bullet supplies the time.
He is explicit about the boundary at 44:31, saying entries must be taken between 2 and 3 o’clock for a Silver Bullet, and at 43:54 describes the window closing with the shaded area at the 4 o’clock bell.
What the 2023 ICT Setup Trade Shows
At 45:10 ICT reports getting short 15 contracts at 15,357.00, saying he wanted to be ahead of the candle's high to be filled. At 45:33 he notes he traded into 3 o'clock and had half of the 30-to-20 band done (25% of the weekly range) before expecting another drive lower, and at 46:15 reports covering at 15,280.00 in full with no partials.
Those are the speaker’s own figures from his own narration. The captions cannot establish that an order existed, at what price it filled, what it cost, what the account did, or what position size was actually carried. Nothing in this article repeats them as a verified result, and no outcome is presented as repeatable or as advice. The same caveat applies to the price levels quoted earlier: they are his readings of his charts, not independently confirmed data.
What ICT Mentorship 2023 Claims About Markets
The recording contains a broader claim that should be separated from its mechanics. At 18:58 ICT rejects the common explanation that a pullback is profit taking, saying he does not believe that is the case. At 19:24 he states his position that these markets are algorithmic and that everything happens because it is designed and engineered to do so, and at 19:47 he says he is not trying to be dogmatic about it, offering it as something to hold in mind while studying price action.
Later, at 27:07, he attributes his approach to a set of “rules of engagement” he claims the algorithm employs, and at 24:17 says that whether or not a reader believes in an algorithm, price can be watched as controlled delivery. He also says at 49:44 that the pattern can be checked against every weekly candle on any market. None of those propositions is established by the caption transcript; they are the speaker’s interpretation of his own material.
Practical Lessons From the ICT Mentorship Setup
Set the vocabulary aside and the lecture models a few practices that stand on their own:
- State the condition that would invalidate the setup before describing the trade (here, the requirement that a higher-time-frame premium objective was already reached, and that without it price may close on the high).
- Measure the range explicitly, from the week’s low to its high, and write the levels down rather than eyeballing them.
- Expect the same area to look like nothing on one chart and obvious on another, and check the higher time frame before trusting the lower one.
- Allow for more than one valid entry model inside the same idea; the lecture lists several and says none is superior to the others.
- Distinguish an objective from a trigger. He separates the 20–30% draw from the time window and the entry pattern that fill it.
- Treat the middle of a session as a source of repeated, noisy attempts rather than a straight line to the target.
This is independent educational commentary on a published recording. It is not investment advice, not official ICT material, and not a tested system; futures involve substantial risk and no analytical framework guarantees a result.
Watch the ICT Mentorship 2023 Setup Recording
This article draws on the timestamped English captions of ICT Mentorship 2023 – T.G.I.F. Setup, published 19 June 2023. The captions misrecognise several terms of art (his name for the morning false run appears as “Juda” or “Judah” swing, and his term for a sell-side imbalance appears only as fragments) which have been normalised above only where the surrounding sentences make them unambiguous. Captions support the speaker's words; they cannot establish chart prices, fills or outcomes. The chart markup is the substance of the lesson, so the recording is worth watching directly.
Watch the original lesson on YouTube
The video cannot be played inside another website. When its embedded player was opened and clicked on 15 September 2026, the player itself reported “Video unavailable” and “Playback on other websites has been disabled by the video owner.”, with no duration and no playback progress reported. The recording’s own watch-page data agrees that embedding is unavailable, which is why no embed is reserved or left blank here. The lesson is available directly on YouTube.
ICT Mentorship 2023 Setup Sources
- The primary source: the original 19 June 2023 T.G.I.F. lesson Use the timestamp links above to compare each explanation with what he actually said.
- The Inner Circle Trader YouTube channel The publisher's own channel, where this lesson and the Power of Three, order block and Silver Bullet material it references are posted. Unofficial reuploads and summaries are not the source used here.
- YouTube’s “Embed videos & playlists” help page Platform documentation relevant to the disabled-embedding notice above.
- CFTC Learn & Protect The US regulator's investor-education and fraud-warning material. A general reference; it is not a statement that this recording or this article complies with, or violates, any particular rule.
This is independent educational commentary. It is not official ICT material, a tested trading system, or a claim that any reported result can be reproduced.