
Key takeaways
The Inner Circle Trader on YouTube presents a roughly 43 minute walkthrough of the 18 August 2023 E-mini S&P 500 morning session, initially shorting five ES contracts before price respected a down-close candle’s opening price instead of breaking lower, prompting him to close at a loss and reverse long five contracts at 14 minutes 5…
Read the full summary
The Inner Circle Trader on YouTube presents a roughly 43 minute walkthrough of the 18 August 2023 E-mini S&P 500 morning session, initially shorting five ES contracts before price respected a down-close candle’s opening price instead of breaking lower, prompting him to close at a loss and reverse long five contracts at 14 minutes 5 seconds. His bearish premise targeted sell-side liquidity and TGIF, defined as a 20% to 30% retracement of the weekly range, but the reversal above the candle opening invalidated that premise. He later added contracts, deliberately raised the long stop too tightly beneath a newly created fair value gap, was stopped out while the broader bullish structure remained intact, and re-entered at the consequent encroachment of an inversion fair value gap with a stop allowing roughly one tick below the wick level. The central distinction is that the first loss reflected a failed premise, while the later exit reflected poor stop placement, although the wider replacement stop was eventually hit too. Relative strength favored ES because ES held above a prior low while Nasdaq made a lower low, with Dow liquidity, Dollar Index, euro, volume imbalance and discount-array behavior used as additional context. ICT recommends recording hourly, 15-minute, five-minute or one-minute price action with OBS or Camtasia before demo or live trading and watching the separate silent 30 minute execution recording at normal speed. No fills, commissions, dollar position size, contract specifications, daily net result, win rate, sample size or backtest are provided, so the article treats the session only as independent educational commentary rather than proof of a trading system or investment advice.
How we researched this article
BestProps used document-based research from primary firm sources, checked September 24, 2026. The complete source list, scope, limitations, and commercial-state record appear near the end of this article.
This article covers one walkthrough, so it stays close to what was said and shown verbally. It explains ICT’s reasoning in his own terms; it does not test his model, and nothing here is a recommendation to trade index futures.
Why Watch the ICT Live Trade Recording First
The walkthrough opens with a viewing instruction rather than a chart. From 0:15 ICT says the original execution recording is separate, runs about thirty minutes, and has no audio at all, and he asks viewers to watch that before listening to his commentary. At 0:27 he addresses people who intend to speed it up: he says watching at two times speed means cheating yourself out of seeing what real-time market conditions feel like. He notes that the compressed two-minute-twenty vignettes he posts can condition students to expect a trade to run immediately toward profit, and says that was never his intent.
That leads into a practical study recommendation. From 2:58 he suggests recording price action across several timeframes (he mentions an hourly, 15-minute and five-minute combination, or 15-minute, five-minute and one-minute) and reviewing it later. His stated reason is that a recording preserves every fluctuation before a candle closes, whereas platform market replay in his description feels “stilted” and “wooden” compared with watching price deliver live. He recommends applying this before putting on a live trade and before even pressing demo, and mentions using a screen recorder such as OBS or Camtasia. That sequencing (observe first, execute later) is his study method rather than evidence about any particular trade.
He also says the exercise came out of teaching. At 5:25 he explains he was counseling his son on price action, watching both the ES and the Nasdaq, and that the screen behind him was waiting for him to press play on a recording of Friday’s ES session (a morning session, which he says was not an attempt to trade the whole day).
How ICT Diagnoses the Initial Live Trade Short
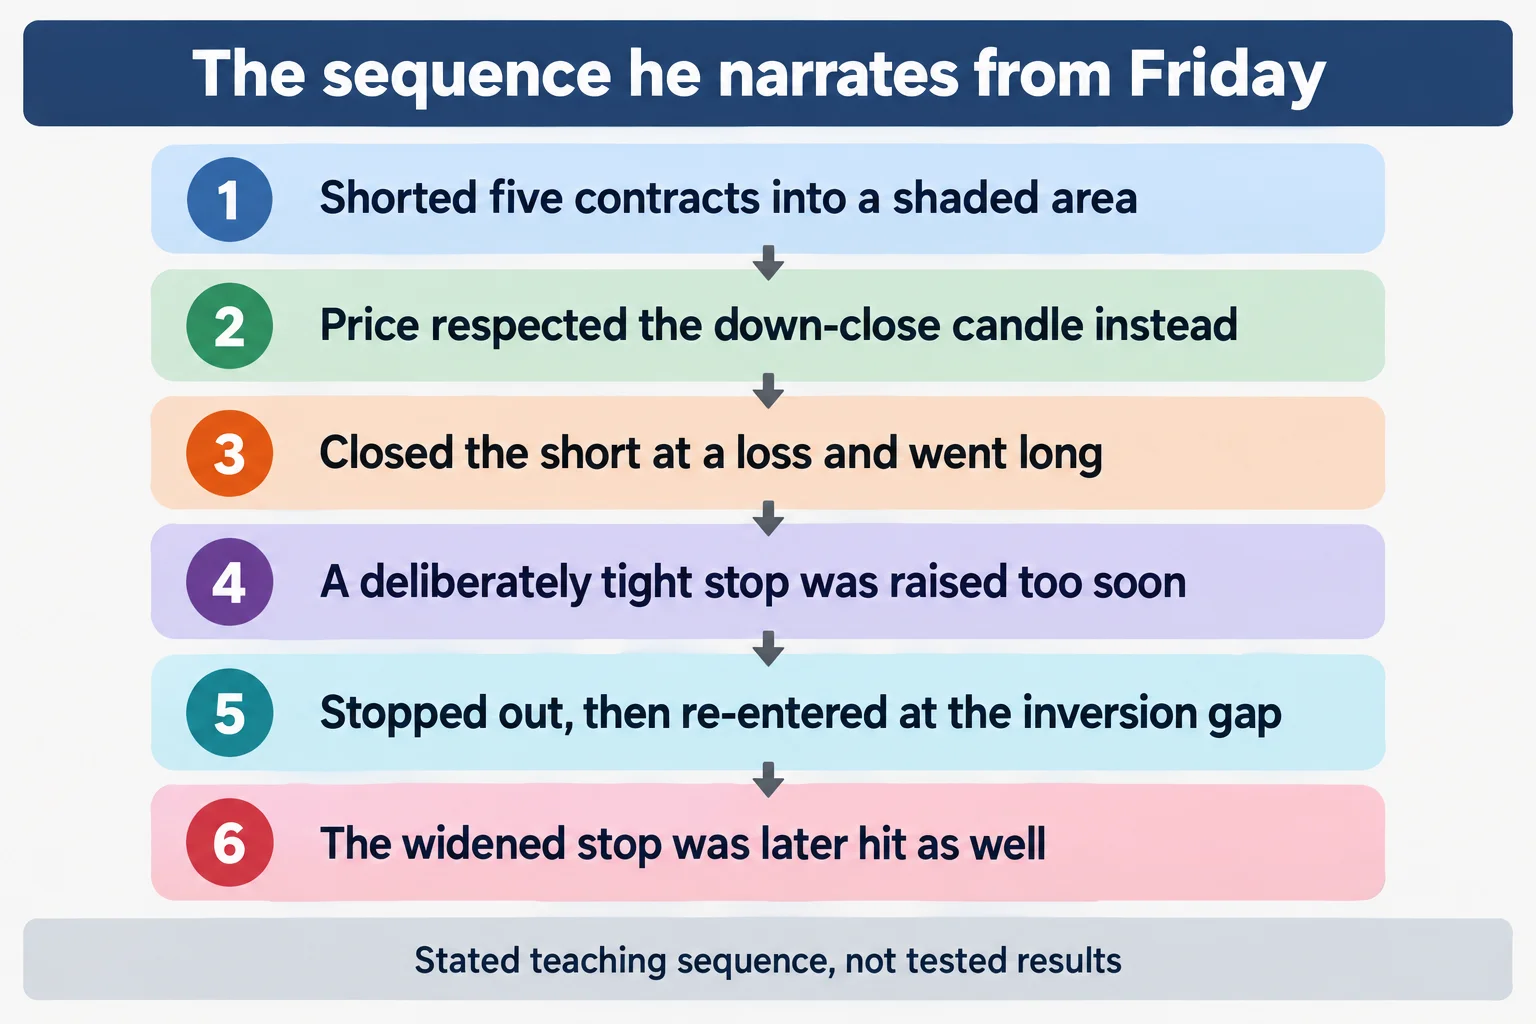
The playback begins at 6:56. ICT says he went short five contracts, watching a shaded area he describes as a fair value gap sitting below a volume imbalance. His bearish idea had two parts: a run toward sell-side liquidity, and a possible move into what he calls TGIF (defined here as a 20%–30% retracement of the weekly range, which he links to Friday of a bearish week drawing back against traders holding shorts). The trade required price to break through a down-close candle and the inefficiency beneath it; in his words, bearish order flow should not show respect for that candle.
What he says he watched for instead was respect, and he saw it. At 11:31 he narrates price touching the opening price inside the wick of the down-close candle and returning above that candle’s consequent encroachment and the boundary of the inefficiency. He says that should not have happened if the idea was valid, says he closed and reopened a new trade, and by 13:36 describes himself as “offside.” At 14:05 he says he never got stopped out on the short: he closed it at a loss and went immediately long five contracts.
The educational value he draws is the invalidation condition rather than the reversal. He had named what should happen at a specific candle, saw the opposite, and changed direction. Later in the recording, at 32:55, he replays the same moment and repeats the reasoning: if the day was bearish, price should never have gone back above that opening price. This is his interpretation of one chart, not evidence that the terminology predicts markets consistently; he says throughout that students should verify the material themselves rather than take his labels on faith.
ICT Trade Stops and Fair Value Gaps
Much of the walkthrough is about where not to move a stop. ICT says he intentionally used an unrealistically tight stop on the long. He frames it as teaching material for his son, who in his description is reluctant to use stops for fear of being taken out. From 14:19 he explains the placement he wanted: below the bodies of the candles and at the consequent encroachment of the wick, with the expectation that the area could become an inversion fair value gap. He adds that he was adding contracts as the position went with him, and describes the day as choppy and range-bound because it was Friday.
Then he shows the mistake he was setting up. At 20:00 he says he should not have raised the stop, and at 21:04 states his rule in the bluntest terms available: after a shift in market structure, do not run the stop up underneath a newly created fair value gap. His reasoning is that price may return to that area to rebalance, so a zone that could serve as a long entry should not simultaneously be treated as a safe stop location. He repeats that the same objection applies when the gap sits inside an inefficiency.
He also corrects his own labeling at 25:18: he tells his son that a particular block is not an inversion fair value gap, because the market structure shift matters to how the leg is read. At 26:11 he says he chased the stop raise too soon (price had not traded through the far side of the wick’s consequent encroachment) and that he was inviting the market to stop him out profitably, while noting that the underlying structure had not been disrupted enough to abandon a long bias.
The re-entry comes at 27:16. He says he was stopped out and then went long again at the consequent encroachment of an inversion fair value gap, placing the stop below the consequent encroachment of that candle’s wick (which is also the low of the inversion gap) and explicitly allowing price to trade a tick or so below it. He characterizes that as coloring outside the lines and acceptable. The distinction he is teaching is worth stating plainly:
- A trade-level stop can be hit without the larger directional idea being invalidated.
- A re-entry still needs a newly defined entry and invalidation point; it is not an attempt to recover a loss.
- Trailing too quickly can cut nominal risk while raising the chance of being exited by ordinary fluctuation.
- Leaving a stop farther away changes the exposure and does not guarantee a better outcome, which this walkthrough demonstrates, because he says the wider stop was eventually hit anyway.
ICT Trade Comparison and Relative Strength
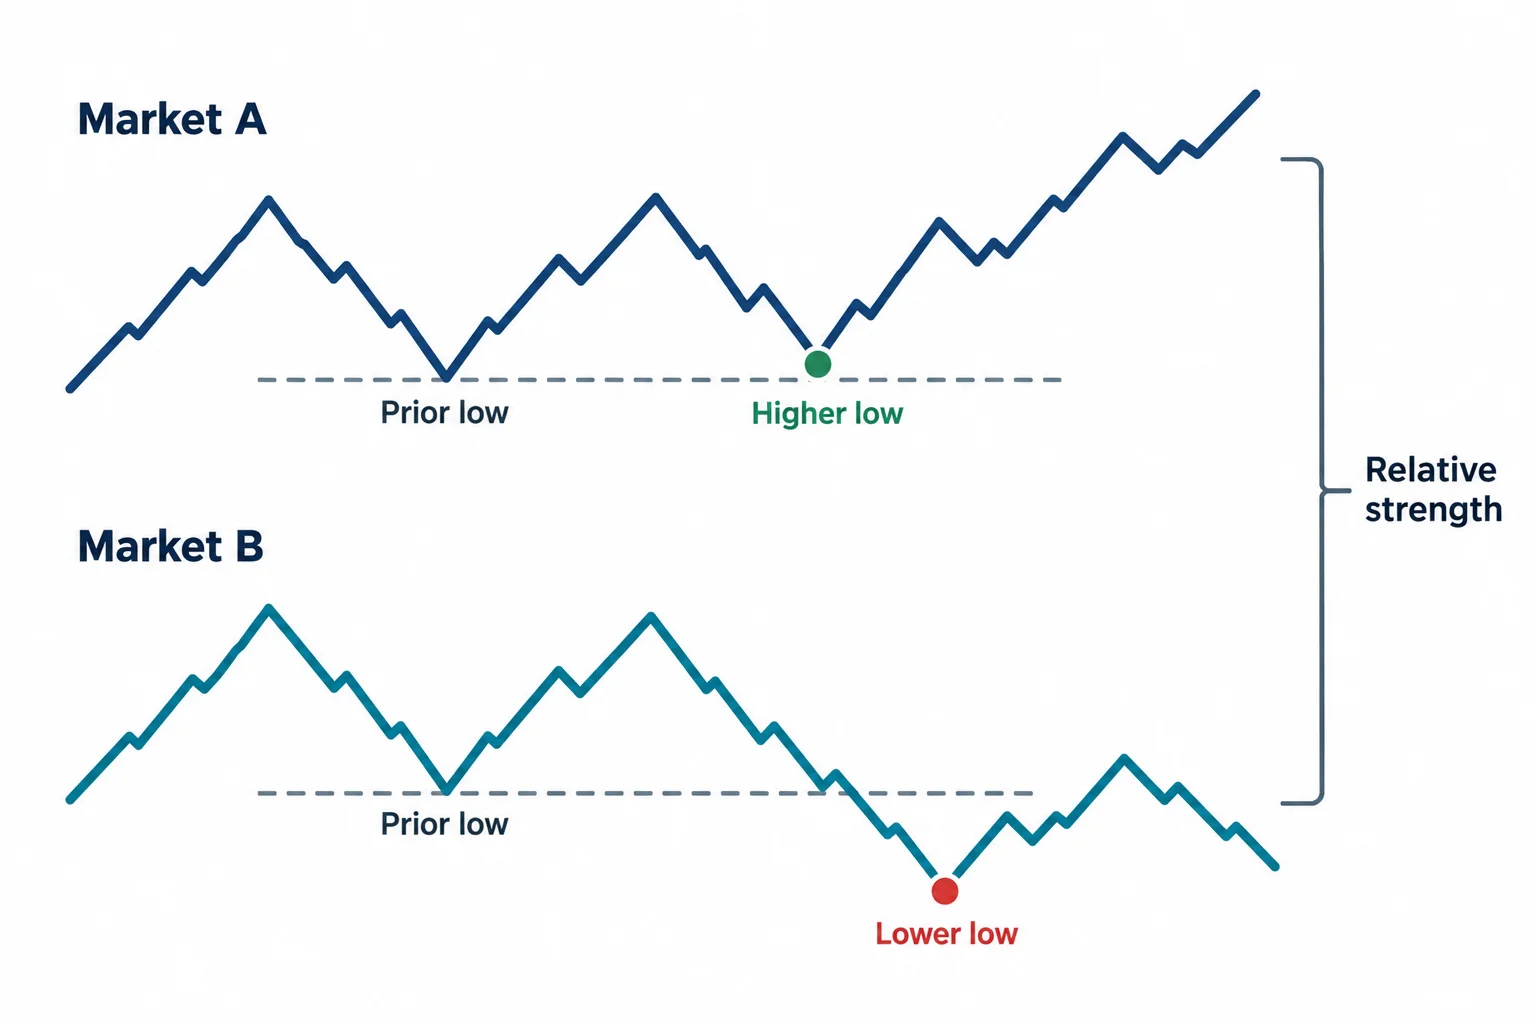
ICT brings in other markets to justify the long. Around 23:52 he points to liquidity for the Dow, then pulls up the Dollar Index and the euro, describing the euro moving higher as a risk-on scenario in which he feels on side. At 30:40 he answers the question he says viewers should be asking (why the ES rather than the Nasdaq) with relative strength: the ES failed to make a lower low while the Nasdaq did. He then reads a volume imbalance and the bodies respecting the upper end of a fair value gap as accumulation into a discount array, and notes a run on the Nasdaq.
He also describes waiting for price to clear a threshold before raising the stop and placing a limit order, then says he put the stop where he did precisely because he did not want to keep managing it, and that the market came back down and hit it. At 32:39 he summarizes the whole exercise as management of expectations around specific price areas and where price should rebalance, and tells viewers he is showing the executions at normal size rather than magnified.
What the ICT Live Walkthrough Does Not Prove
What can be checked is that ICT said these things while replaying this session. The recording is a walkthrough over a screen: it contains no statement, commission detail, contract specification, position size in dollars, or net result. He narrates entries and stop placements, and says the market hit his stop, but he never states a profit or loss figure for the day, and this article therefore reports none. There is no win rate, no sample size and no backtest anywhere in it.
Two claims depend on material outside the recording. The first is the execution itself: he refers to a separate thirty-minute silent recording and tells viewers to watch it, and that reference is not verified here. The second is the pre-market and intermarket context, including the references to the Dow, the Dollar Index and the euro, which are asserted verbally and cannot be checked from the captions alone. The date is reconcilable: the video was published on 20 August 2023 and reviews a recording he says was made on the Friday of the ES session, which matches Friday 18 August 2023. The recording also contains a long digression about comment-section critics, the labelling of blocks, and a claim that the markets are “scripted” (his assertion, not something the transcript demonstrates).
Watch the Original ICT Live Trade Recording
ICT Mentorship 2023 – August 18, 2023 Live Trade Walkthrough
The Inner Circle Trader · uploaded 20 August 2023, reviewing the Friday 18 August session · about 43 minutes. This is the primary source for this article; every timestamp link above points into it.
The recording is not embedded here because the video owner has disabled playback on other websites. That was checked directly on 15 September 2026: the player loads and returns “Playback on other websites has been disabled by the video owner” rather than playing.
The walkthrough runs about forty-three minutes and is the only primary source used for this article. It refers to a separate silent execution recording on the same channel. The channel is The Inner Circle Trader on YouTube.
ICT Mentorship 2023 Resources
These are the sources checked for this article. The CFTC and Investor.gov pages are general regulator and investor-education material on leveraged foreign-exchange fraud, on trading systems sold online, and on what leverage is. They are not assessments of ICT or of anything said in the recording, and none of them verifies any statement made here. Third-party copies, notes and indicator bundles derived from his material circulate outside his own distribution and were not tested here.
- [1] ICT Mentorship 2023 – August 18, 2023 Live Trade Walkthrough, The Inner Circle Trader (primary source; watch page read 15 September 2026, 43M14S)
- [2] CFTC Learn & Protect, Forex Frauds (read 15 September 2026)
- [3] CFTC: Fraud Advisory: Commodity Trading Systems Sold on the Internet (read 15 September 2026)
- [4] Investor.gov: Glossary: Leverage (read 15 September 2026)
This is independent educational commentary on one trade walkthrough. It is not official ICT material, it is not a tested trading system, and it is not investment advice. No profit or loss figure for the session is stated in the recording and none is reported here. Index futures trading with leverage involves substantial risk and is not suitable for everyone.
