
Key takeaways
The Inner Circle Trader on YouTube presents a six minute 31 second ICT method that assumes bullish context, identifies buyside liquidity above unrun highs, classifies swing lows as short-term low or STL, intermediate-term low or ITL, and long-term low or LTL, then applies Fibonacci standard-deviation extensions and retains only projections beyond the targeted high.
Read the full summary
The Inner Circle Trader on YouTube presents a six minute 31 second ICT method that assumes bullish context, identifies buyside liquidity above unrun highs, classifies swing lows as short-term low or STL, intermediate-term low or ITL, and long-term low or LTL, then applies Fibonacci standard-deviation extensions and retains only projections beyond the targeted high. An ITL is lower than the previous STL, while an LTL sits between two ITLs. Narrated projections include 4101.25, 4101.5, 4104.00, and the key 4104.25 confluence produced from both intermediate-term and long-term lows. The speaker says Friday price reached 4104.25 at three fifty-four p.m. New York time, six minutes before four p.m., within his final-hour macro from three p.m. to four p.m. and a 30-minute interval beginning at three fifteen p.m. The unnamed instrument, uneven automatic captions, absent entries, stops, fills, account results, and independent testing mean the figures are unverified chart readings rather than evidence of a repeatable edge, and the article recommends replaying historical data in TradingView while testing timing and level confluence separately.
How we researched this article
BestProps used document-based research from primary firm sources, checked September 24, 2026. The complete source list, scope, limitations, and commercial-state record appear near the end of this article.
This is a compact follow-up rather than a full lesson. He says at the start that it continues something he had shown in a live audio session that day, and it runs about six and a half minutes, most of it spent on his chart annotations.
ICT Market Structure Swing Low Terms
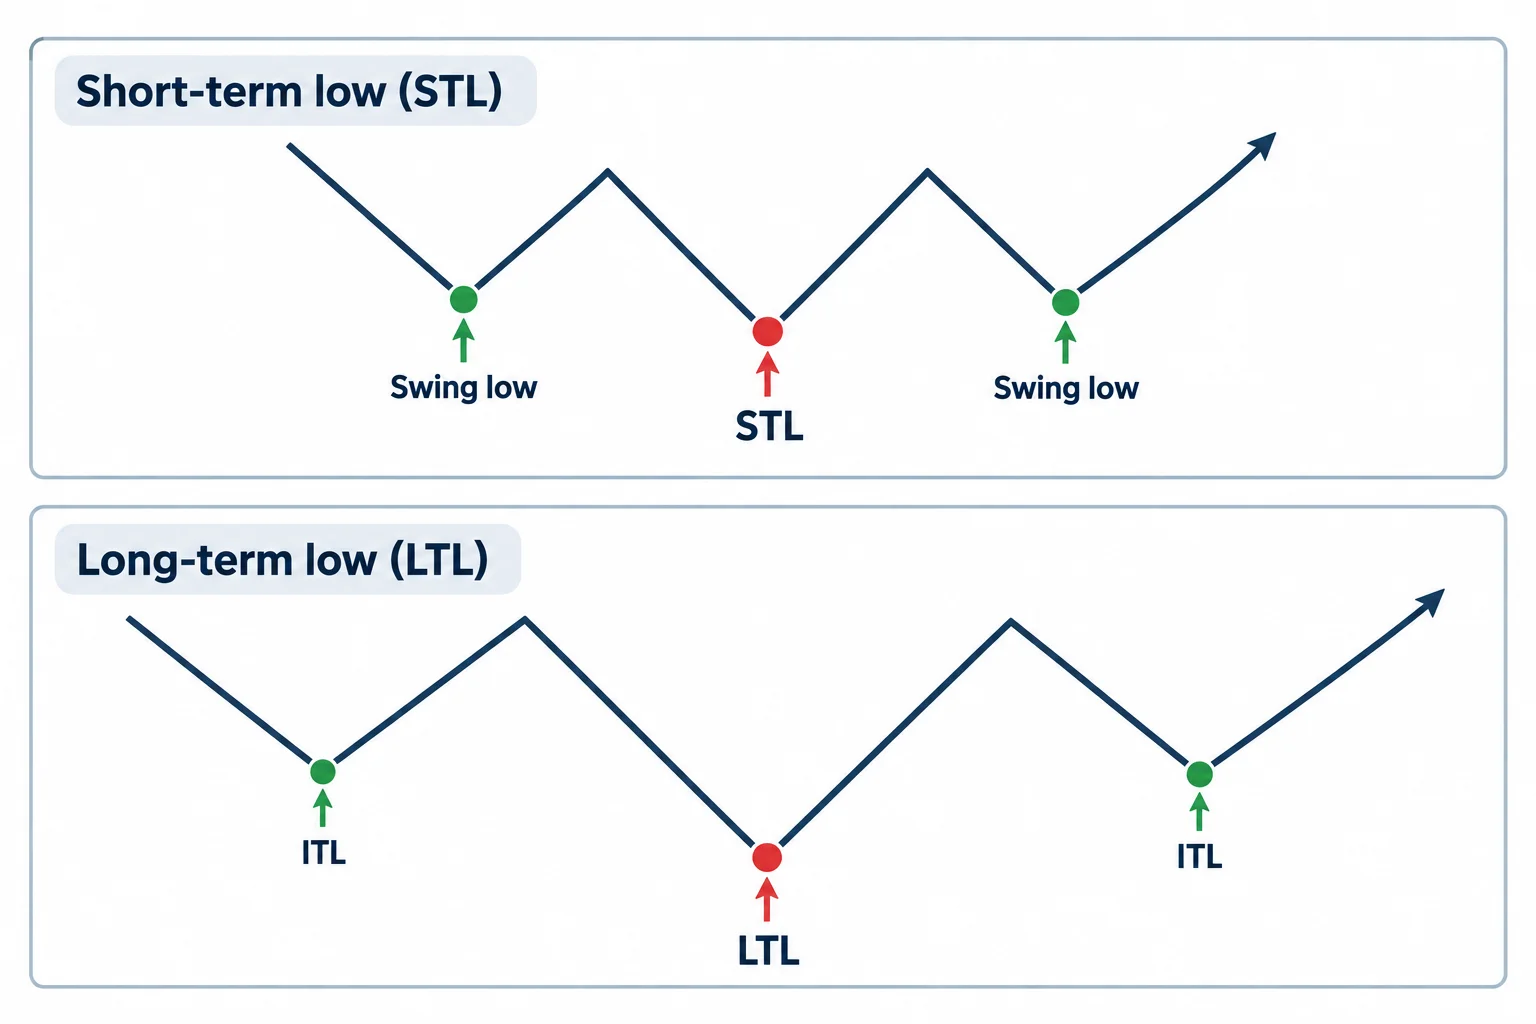
He opens with a three-point formation: a low with a higher low to its left and a higher low to its right (0:12). Asked in effect why he uses one candidate low rather than another, he says it is because that one went lower (0:17).
He then gives the three labels he works with. A short-term low is abbreviated STL; a long-term low is LTL; an intermediate-term low is ITL (0:39 and 0:43). His definition of an intermediate-term low is a low that has a low lower than the previous short-term low, and his definition of a long-term low is one that sits between two intermediate-term lows (0:20 and 0:55).
That is the substance of the structure half of the video: the same swing can be ranked differently depending on what surrounds it. The captions describe lows only. He does not set out the mirror-image definitions for highs here, so nothing in this recording supports reading a symmetric rule into it.
How ICT Market Structure Sets Buyside Liquidity Targets
He states the condition for the exercise plainly: if the read is bullish, the expectation is for the buy side up above the market (1:00). In his vocabulary the buy side is the resting liquidity associated with highs that have not yet been run, and later in the clip he points at the high he is treating as the target (1:42).
The sequence matters here. He is not claiming the structure label predicts direction. He assumes a bullish context, picks the liquidity he wants to see run, and then uses the structure to decide which swings to measure from.
ICT Standard Deviation Fibonacci Settings
Before drawing anything he shows his indicator settings and narrows them down (1:16). He says he does not need some of the displayed levels, that one set is for measuring how far a daily range can come off its high or low to the closing price and will be taught later, that another set is his optimal trade entry levels, and that equilibrium is not needed for this exercise (1:23 and 1:31).
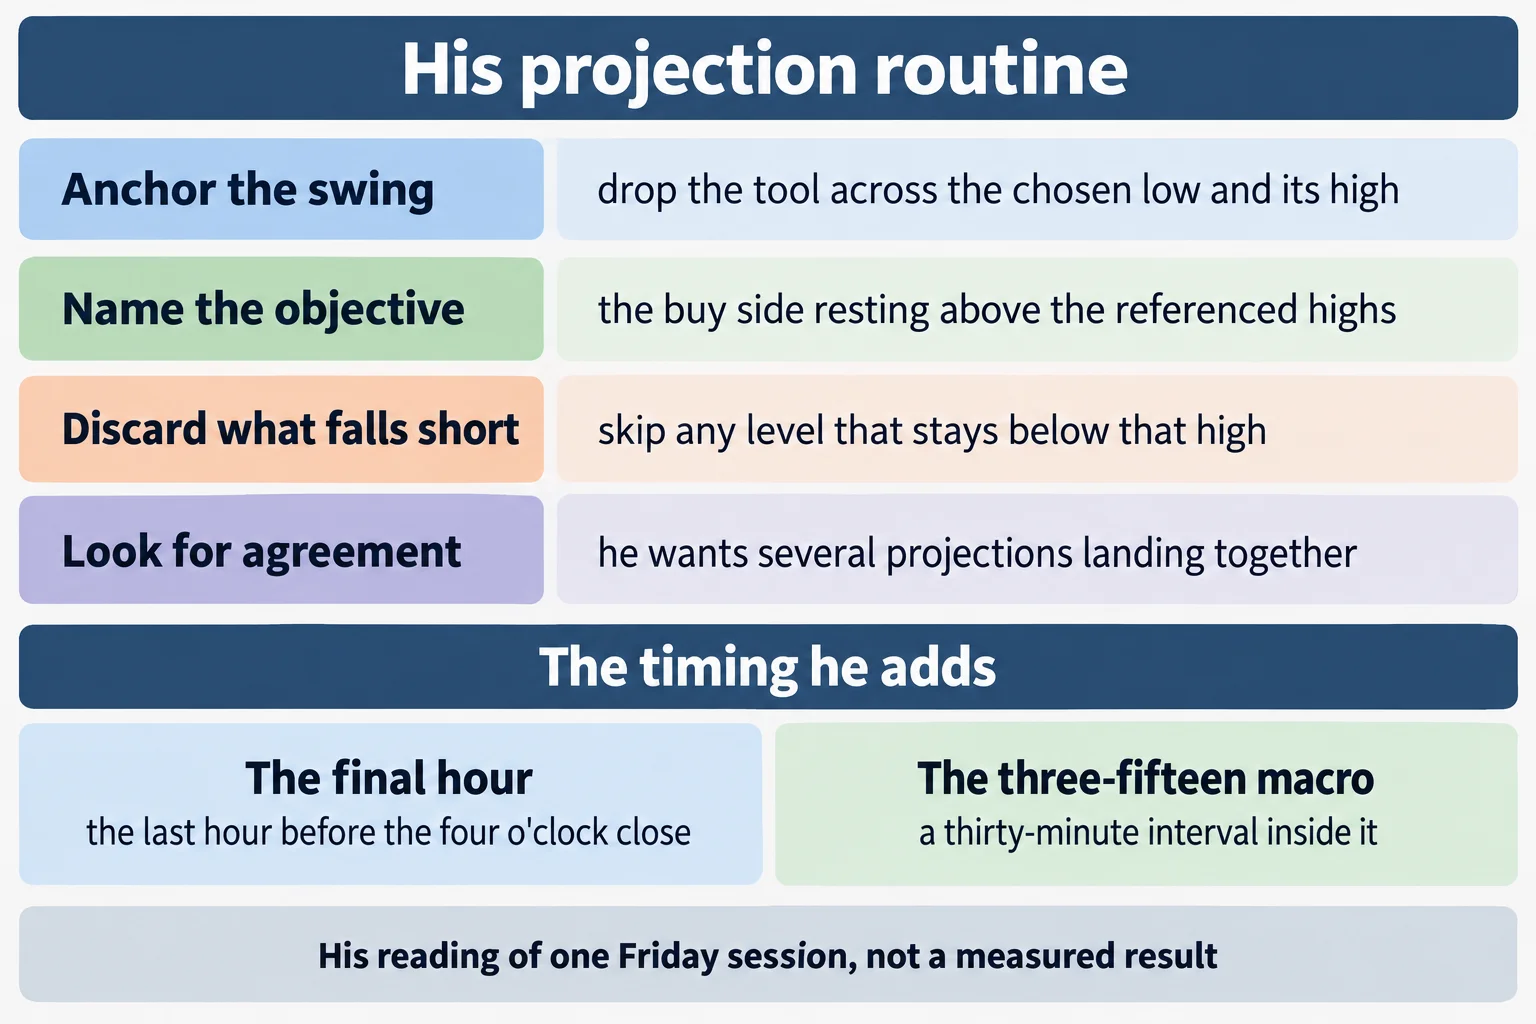
He anchors the tool across a selected swing (from a low and up to its high) and then reads the extension levels above that high (2:51). The rule he applies is a filter: a projected level is only interesting if it sits beyond the liquidity high he is aiming at. He says outright that one projection cannot be used because it lands below the high he is referencing (3:24), and that because the relevant high moved shallower he has to treat a different high as the buy-side reference, which rules out the first standard deviation (3:30 and 3:38).
ICT Standard Deviation Levels and Market Confluence
He reads several numbers off the tool during the clip, and they are worth recording exactly as he states them. Working from one swing he says the first level past the high is 4101.25 (1:47); from another low he says the first level past is 4101.5 and that this is why he called that number (2:05). He then says the next one up is 4104.25 (2:25), notes that price is already at that level, and anchors a measurement from the low up to the high (2:36 and 2:51). Because the high he is aiming above is comparable in size to the earlier one, he says the first available extension cannot be used and the next one (which the captions render as “negative 1.5”) he reads as 4104 even (3:00 and 3:04).
His main observation is the overlap: measuring from two structurally different lows, he says, produces 4104.25 twice, once from intermediate-term lows and once from a long-term low, both aimed at running the same buy-side liquidity (3:46 and 3:48).
Two caveats belong with those figures. The numbers are his spoken readings of a chart the viewer cannot see, taken from automatic captions that handle decimals and signs unevenly. The level he describes as “the next one” is captioned as a negative value, and the same sentence reads 4104.00 in one place and 4104 even in another. The instrument is never named, so no contract can be attached to the levels. Treat every figure in this section as a quotation of his narration, not a verified market observation.
Buyside Liquidity and the ICT Market High
He asks himself what the high of the day was on Friday and starts reading it off the chart (4:01). He first says 4104.00, immediately corrects himself, and then reads 4104.25 from the next candle, which he identifies as the candle at six minutes to four (4:09, 4:18 and 4:29). He states the time as 3:54 New York local time and says the high comes in at 4104.25 to the tick (4:33).
His stated conclusion is that he is looking for confluence of standard deviations at key market turning points, and he calls this institutional market structure, adding that it is not in books, that it has only been taught through his mentorship, that he will cover it in more depth that year and in chapters of forthcoming books, and that the writing exists so nobody can claim authorship of it (4:36 and 4:55). Those are his claims about his own material; this recording contains no statistical test of the confluence idea, and neither the books nor the mentorship are available to check here.
ICT Market Structure in the Final Hour
He then describes how price walked up into the buy side and into the 4104.25 level, and attributes it to what he calls the final-hour macro: three to four o’clock, the last hour of trading before the 4 p.m. close (5:05 and 5:19). He notes that trading continues until five but says the bulk of the volume is captured by 4 p.m., and that the 30-minute interval beginning 15 minutes after three is what he calls a macro (5:23 and 5:38). In his description of it, the algorithm runs a market-on-close move toward a liquidity point that had not yet been targeted but was the obvious one (the buy side he had marked) (5:45).
He points viewers to a live stream on his own channel, describing a February 10, 2023 market review and tape-reading event where he says he called each of those minute candles as it was delivered and walked the session up into 4104 (5:58 and 6:15). That is his account of his own broadcast, offered as the supporting material for this clip; the outcome is not independently documented in this recording, and a retrospective call of candles on a livestream is not the same as an audited trade record.
How to Study ICT Market Structure Claims
Read as a method rather than a signal, the clip sets out a repeatable routine:
- Label the short-term lows first, then decide which low qualifies as intermediate term under the speaker’s definition rather than by eye.
- Name the high that represents the liquidity you are actually targeting, and keep it fixed while measuring.
- Anchor projections consistently across the selected swings, and discard any level that does not clear the referenced high.
- Record where projections agree, and log the cases where they do not. Confluence is a hypothesis in this recording, not a demonstrated probability.
- Keep the timing layer separate from the level layer so each can be judged on its own rather than being credited together after the fact.
What ICT Market Structure Does Not Prove
The captions are YouTube’s automatic ones, and they mistranscribe several things: “buy side” appears as “boss side” and “eye side”, “intermediate term low” once as “intermittent term low”, the extension level he describes as the next one is captured as “negative 1.5” and the value he reads with it as “4104 even”, while his first attempt at the high of the day appears as “4104.00” before he corrects it to 4104.25, and the 4104.25 line elsewhere carries an inserted word as “4104.25 million”. The normalisations in this article are limited to passages where the surrounding context is unambiguous, and where it is not, the caption wording is quoted instead.
More broadly, this is a narrated screen recording of charts the article cannot measure. No instrument, contract month, account balance, entry, stop, fill or realised result appears anywhere in the captions; the levels and the 3:54 high are the speaker’s readings of his own annotations. Anyone studying this should reproduce the swings and projections on properly configured historical data before treating a confluence as meaningful, and should keep a retrospective explanation distinct from evidence of a repeatable edge. Nothing here is investment advice and leveraged futures trading carries substantial risk.
Watch the ICT Buyside Liquidity Recording
Institutional Market Structure & Standard Deviations With Buyside Liquidity
The Inner Circle Trader · published 11 February 2023 · about 6½ minutes. This is the primary source for this article; every timestamp link above points into it.
The video is not embedded here because the owner has disabled playback on other websites. That was checked directly on 15 September 2026 from a BestProps page origin: the embedded player loads and returns “Playback on other websites has been disabled by the video owner” instead of playing, so no empty player is left on this page.
The watch page was read on 15 September 2026 and rendered as a public video: title “Institutional Market Structure & Standard Deviations With Buyside Liquidity”, listed at 6 minutes 31 seconds, with an upload timestamp of 11 February 2023 at 9:07 a.m. Pacific. The scheduling inventory used for this article lists the same upload under the date 11 February 2023, so the two agree. The Friday session the speaker discusses is the 10 February 2023 session he names in the recording, one calendar day before the upload, a normal time-zone and session-labelling difference rather than a contradiction. The channel is The Inner Circle Trader on YouTube, which is the first-party record of what it publishes.
ICT Market Structure and Liquidity Resources
These are the sources checked for this article. The regulator and investor-education pages are general material about futures and about trading systems sold to the public; the platform page explains how to step through a completed session bar by bar without hindsight. None of them assesses the speaker, verifies a level quoted above, or endorses anything said in the recording. Any ICT, smart-money or third-party indicator, script, note set, transcript pack or re-upload circulating outside the publishing channel’s own page is unofficial and untested here.
- [1] Institutional Market Structure & Standard Deviations With Buyside Liquidity (The Inner Circle Trader; primary source; watch page read 15 September 2026, 6M31S)
- [2] The Inner Circle Trader (official YouTube channel; read 15 September 2026)
- [3] TradingView (how do I turn Bar Replay on?) (third-party platform documentation; read 15 September 2026) For stepping through a completed session without seeing later bars. TradingView is not affiliated with BestProps or with the speaker.
- [4] CFTC (Fraud Advisory: Commodity Trading Systems Sold on the Internet; read 15 September 2026)
- [5] Investor.gov (Glossary: Futures; read 15 September 2026)
This is independent educational commentary on one speaker’s framework and his reading of one session. It is not official ICT material, it is not a tested trading system and it is not investment advice. The recording contains no profit or loss figure and none is reported here.