
Key takeaways
In this 19-minute review of a live ES execution, ICT walks through a long he took on the March 2023 contract with 4030 as the objective — the 14 December 2022 daily closing price — after sell-side liquidity below the 9:20 low was swept around 9:40.
Read the full summary
In this 19-minute review of a live ES execution, ICT walks through a long he took on the March 2023 contract with 4030 as the objective — the 14 December 2022 daily closing price — after sell-side liquidity below the 9:20 low was swept around 9:40. He says he entered inside a fair value gap as it approached the middle of the shaded area, watched a volume imbalance form between two adjacent candle bodies, and described pyramiding by adding on returns into that imbalance and into a down-close candle he labelled a bullish order block, entering near that candle’s mean threshold. He reports eight contracts at a stated 1.2% risk on a hypothetical $100,000 account, 1.3% after another addition, and 14 contracts as the move accelerated, with nine planned off above 4030. He also reports an extra click that left him short four contracts, closed immediately, and a $10,400 result for the single run. The fills, the risk percentages and the result are his own narration over his own order screen; auto-generated captions confirm what he said and when, not that it happened as described.
How we researched this article
BestProps used document-based research from primary firm sources, checked September 24, 2026. The complete source list, scope, limitations, and commercial-state record appear near the end of this article.
This article is a source-grounded reading of ICT 2023 Mentorship \ ES Live Execution & Mean Threshold Risk Management, built from the recording’s timestamped English captions. The video’s own watch page gives a publication time of 17 January 2023, 10:09 a.m. Pacific, and a running length of 19 minutes 41 seconds. It is a narrated replay of one trader’s execution and the reasoning around it, not independent evidence that the concepts it applies produce a repeatable edge.
The central lesson is not the direction of the position. It is how he connected a previously identified objective with intraday liquidity, a fair value gap, a down-close candle he treats as a bullish order block, what he calls a volume imbalance, and the mean threshold of that candle — and then how he sized and moved risk around that story.
The objective: 4030 and where it comes from
He opens by saying he had outlined 4030 as his level in weekend commentary before the trading week began and again that morning on Twitter (0:28, 0:34). He then gives the derivation: on the daily chart for the March 2023 ES contract, 4030 is the closing price of 14 December 2022 (1:18, 1:29). In his framing, open, high, low and close plus time are what is needed to understand how price is delivered.
That level shapes the whole session. He says his attention was primarily on 4030 and that he would take the bulk of whatever he accumulated off there or higher (5:09). He also draws a distinction that matters for how the position was managed: he was not looking for a trending day, only an expansion up into 4030, which he describes as the upper end of the range set from that December close (3:51, 3:56).
The entries: a fair value gap, a swept low, and a volume imbalance
His account of the morning has two parts. First, sell-side liquidity below the 9:20 low was taken, with sell-side stops purged on a drop down at around 9:40 (3:00, 3:05). He says he stayed sidelined before the 9:30 open and waited for that sweep rather than pre-empting it (3:24, 3:30). Second, he says he went long inside a fair value gap as price approached the middle of the shaded area, and placed a limit order further up as a best-case exit in case price snapped higher (1:00, 1:04).
He points to the candle the idea rested on: the 9:43 candle, which he describes as the shaded, large bullish green candle he had drawn attention to on Twitter (1:55, 2:02). The down-close candle he says he entered on is, in his terminology, an order block (2:10).
He then introduces what he calls a volume imbalance: two adjacent candles whose bodies do not overlap, leaving an absence of traded bodies between them (2:14, 2:18). He says he wanted that gap between the current candle’s open and the previous candle’s close to stay open, because a return into it would let him add contracts and pyramid the position (2:26, 2:39). The captions render the term inconsistently — variously “volume and balance” and “volume amounts” — but the surrounding sentences describe the same imbalance concept, and the term is normalised here only on that basis. He also states the target in plain terms: about ten thousand dollars in one trade, built up from a single entry (2:47, 2:54).
Where the stop goes, and why
His main risk discussion begins at 4:17. He defines the mean threshold operationally as the midpoint of the relevant down-close candle and says his stop sat below it, on the reasoning that price should not trade back down there because the stops at the 9:20 low had already been taken (4:17, 4:32, 4:38). He adds a practical note that charts should be set to New York local time for the timings in his recordings to line up (4:46).
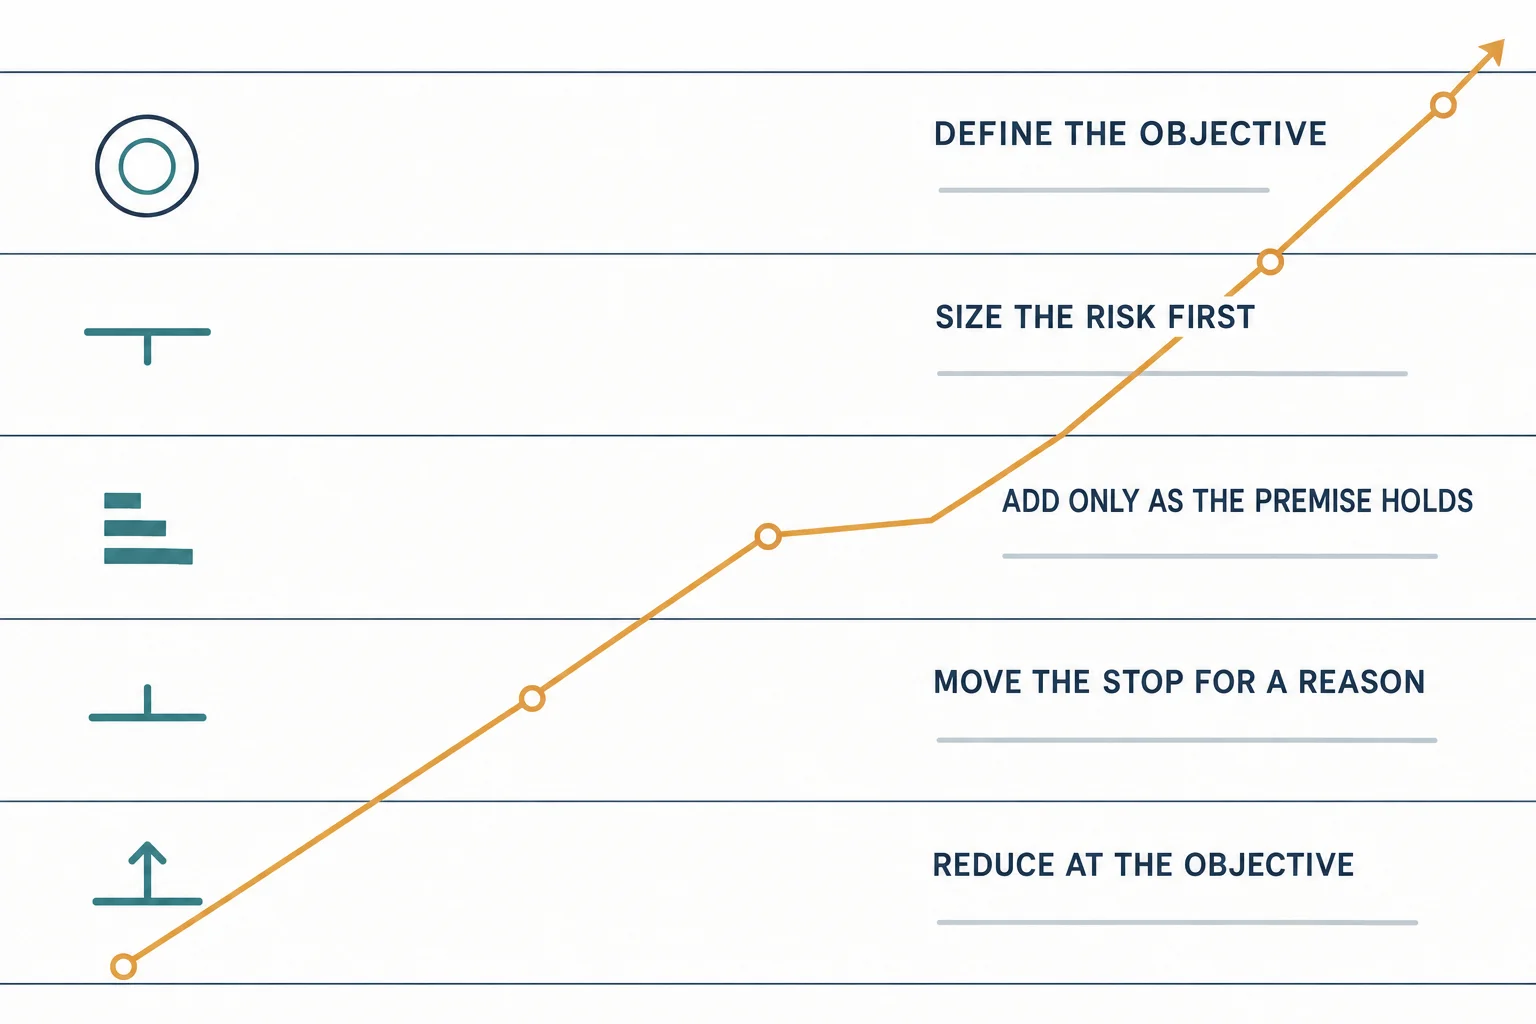
He raises the stop as the trade develops. Once price had traded through the bodies of the swing high several candles back, he says he was confident enough to hold his stop below the low of the retracement — the large down-close candle where he made his second partial entry — rather than back at the original level (9:36, 9:48, 10:02). He calls that adjustment removing the risk, with the caveat that spending too much time below the 9:30 low would weaken the idea (10:22, 10:25). The transcript describes the reasoning around that stop; it does not show the order ticket, so the exact fill prices are not independently established here.
Exposure, risk percentages and the five-handle lens
At 5:20 he reports holding eight contracts and frames the stop as 1.2% risk on a hypothetical $100,000 account; after a further addition he puts the risk at 1.3% (8:22). These are his stated figures over his own screen; the captions do not carry the order data needed to reconstruct them.
He also asks viewers to read price in five-handle increments, giving the arithmetic explicitly: a five-handle move is 20 ticks, and one standard ES contract is worth $50 per handle, or $250 per five-handle move (6:23, 6:30, 6:38). In the execution itself his management stays tied to structure and the 4030 objective rather than to exiting automatically every five handles.
He describes entries and exits as a deliberate pattern: entering long on down-closed or down candles and taking profits on up candles, which is the asymmetry he calls the market efficiency paradigm (8:11, 8:17). He also wants to see price clear the morning high with speed and distance rather than just poke above it, and he ties that judgement to the 4023.50 morning-session high (8:48, 8:58).
The order-block addition
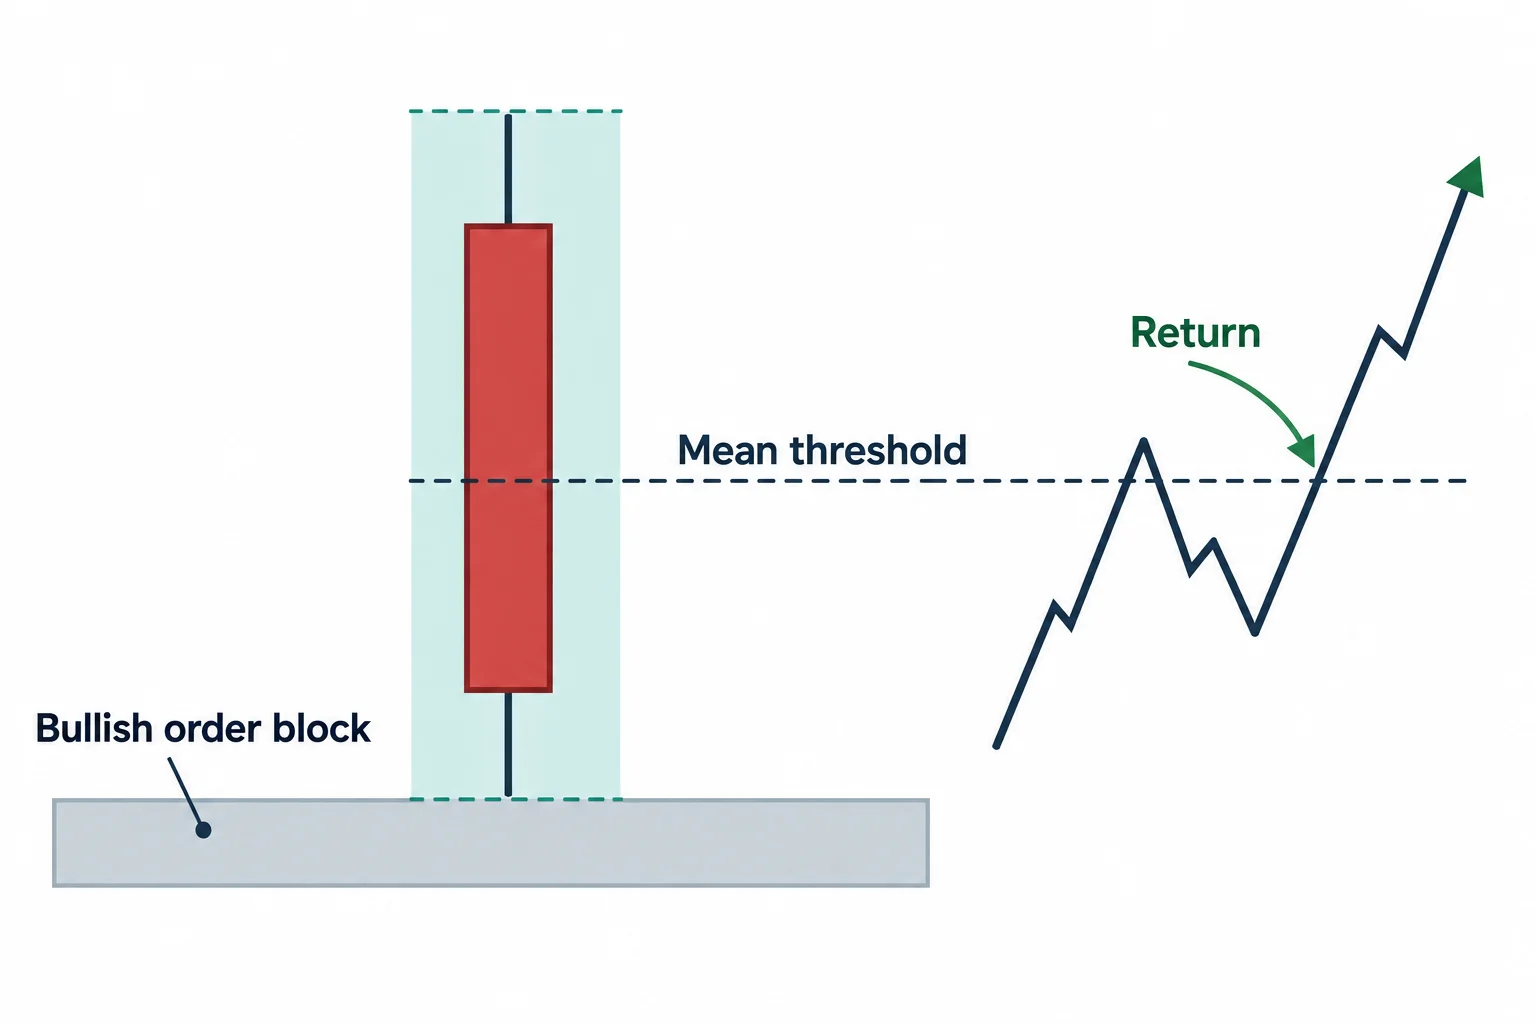
Later in the sequence he narrows onto a down-close candle and calls it a bullish order block, noting that it sat just left of his second partial entry and that the whole range inside that candle could serve as another partial or as a standalone entry (11:06, 11:15). At 13:35 he says he went long as price reached about the midpoint, or mean threshold, of that down-close candle, with the imbalance as the reference that should not be pierced (13:46, 13:51). He contrasts this with forex, saying a stop this close to price is not something he considers survivable there and that futures are the cleaner asset class for it (14:02, 14:26). That is his opinion about broker behaviour and market structure, not a claim verified here.
From there he says the requirement was a quick, strong new high above the 9:30 high, and he identifies the buy-side liquidity above the high formed around 9:53 to 9:54 as the destination (15:32, 15:44, 17:03). He mentions a recurring macro window between roughly 9:50 and 10:10 that he says often produces a run in price (18:24, 18:26).
The reduction, the extra click, and the reported result
As the move accelerated he reports holding 14 contracts and says he was taking nine off above 4030, having earlier considered removing six, or half, if price ran to that level (11:41, 17:16, 18:18). He says the position had stalled rather than continued, which is why he wanted the bulk off there. He also points out how many separate five-handle advances the session had already produced on the way to 4030 (17:52).
The ending is operational rather than analytical. He says that when the order filled it stalled, he hit it again, and the second action left him short four contracts, which he closed immediately once he worked out why the position was lagging (19:00, 19:08). He then reports ten thousand four hundred dollars in one trade and one run while risking no more than 1.3% of the account (19:16, 19:21). That result is self-reported narration over his own screen; nothing in the captions is an independently verified performance record.
Study takeaways
- Name the objective before the session and be able to say where it comes from — here, a prior daily closing price rather than an arbitrary number.
- Distinguish a targeted expansion from an expectation of a full trending session; it changes when the position should be reduced.
- Add to a position only while the stated premise still holds, and tie each stop adjustment to a specific structural reason.
- Translate a stated risk percentage into contract count before the trade, as he does with eight contracts against a hypothetical account; do the same arithmetic on your own account size.
- Treat execution errors as a real risk of their own: the accidental short in this recording is an operational mistake, not a change of view.
Two limits are worth stating. First, captions establish what the speaker said and when, not the order log: the contract counts, risk percentages, fills and the reported result cannot be checked from the transcript. Second, a single narrated replay is not a sample. Nothing here tests whether fair value gaps, order blocks, volume imbalances or mean-threshold entries hold up across sessions, and the recording’s own account includes an execution slip.
Watch the original recording
The source is the auto-generated English caption track of the recording, 453 timestamped segments covering the full 19-minute 41-second runtime. Those captions garble a number of terms of art and spoken figures — his volume-imbalance concept appears as “volume and balance” and “volume amounts”, “forex” appears as “foreign”, and prices are written out as spoken words such as “40 30” — so terms have been normalised only where the surrounding sentences make them unambiguous, and the captions’ own wording is quoted where the ambiguity is material. No chart detail, order fill or result has been inferred from anything other than what is spoken.
Watch the original lesson on YouTube
This recording cannot be played inside another website. Its embedded player was loaded from a BestProps origin and clicked on 15 September 2026: it reported “Video unavailable” and “Playback on other websites has been disabled by the video owner”, with no duration and no playback progress. The recording’s own watch-page data agrees that it is not playable in an embed, which is why no iframe is placed here. The video is public and available directly on YouTube.
Watch ICT 2023 Mentorship \ ES Live Execution & Mean Threshold Risk Management on YouTube ↗
Source and further reading
- ICT 2023 Mentorship \ ES Live Execution & Mean Threshold Risk Management — the primary source and the only recording used for this article. Published 17 January 2023; watch page read 15 September 2026. Use the timestamp links above to compare each step with what he actually said.
- The Inner Circle Trader YouTube channel — the publisher’s own channel, where this execution review and the concept lessons it references are posted. Unofficial reuploads and summaries are not the source used here.
- CME Group — E-mini S&P 500 Futures Contract Specs — the exchange specification page for the contract used in the recording. It is the reference for the tick value and multiplier behind the figures he quotes, so his five-handle and per-contract arithmetic can be checked against the source even though his fills cannot.
- CFTC — Fraud Advisory: Commodity Trading Systems Sold on the Internet — US regulator guidance on hypothetical and retrospectively presented results and on the execution and cost assumptions such presentations tend to omit. General context for reading a narrated execution recap like this one; it does not assess ICT or any figure here.
BestProps is not affiliated with the Inner Circle Trader, the CME Group or the CFTC, and no source listed here endorses this article or any setup. Objective, draw on liquidity, fair value gap, volume imbalance, order block, mean threshold, market efficiency paradigm and pyramiding are used as descriptive terms for what the recording teaches. The price levels, contract counts, risk percentages, stop placements, fills and the reported result are the speaker’s own narration over his own charts and screen and are not verified here. This is independent educational commentary: it is not official ICT material, not a tested trading system and not investment advice. Index futures trading with leverage involves substantial risk and is not suitable for everyone.
