
Key takeaways
The Inner Circle Trader on YouTube reviews ESH2023, the March 2023 E-mini S&P 500 contract, in an 80 minutes 58 seconds narrated chart review published 18 January 2023.
Read the full summary
The Inner Circle Trader on YouTube reviews ESH2023, the March 2023 E-mini S&P 500 contract, in an 80 minutes 58 seconds narrated chart review published 18 January 2023. ICT began without a directional bias and waited for overnight delivery plus the midnight New York, eight thirty and nine thirty opening prices. Key references were a 10 to 12 January fair value gap, the midpoint of the 9 January wick, 3982.50 derived from the 13 January daily low to open, resistance at 4030.75 and an old daily low at 3961.75. His preferred short required a run above Tuesday’s high toward 4036 or 4040, followed by a turtle soup failure targeting 3982.50, but that move never occurred. He instead reported two longs, one partial exit and a break-even stop on the remainder, with no order ticket, statement, fill details or account result shown. The review covers fair value gaps, order blocks, mean thresholds, bearish breakers and the institutional order flow entry drill, described as touching the candle that created an imbalance. ICT says partials should be taken half a point to one full point before obvious targets and illustrates 3943.75 versus 3944.25. His three-day study marks the highest high, lowest low and each individual daily high and low across the current and prior two trading days as a dynamic liquidity matrix. The video provides no independently verified levels, pattern-frequency data, comparison with another method or verified earnings, and its example that five handles equals $250 on one contract and $2,500 on ten contracts is illustrative arithmetic rather than a reported result.
How we researched this article
BestProps used document-based research from primary firm sources, checked September 24, 2026. The complete source list, scope, limitations, and commercial-state record appear near the end of this article.
The structure of the video is worth knowing before the levels. It opens with a short annotated daily-chart segment that was published before the session, then cuts to the recording made on the evening of 18 January, in which he plays back a portion of a Twitter space he had hosted the previous night to show what he had said before the market opened. The caption at the start labels the chart esh2023, which is the E-mini S&P 500 contract for March 2023 (0:47); the month is never spoken in the recording, so that identification rests on the contract code on screen.
ICT Emini Futures Levels for the Session
The pre-session segment runs through four references on the daily chart. First, a small fair value gap formed by the high of the 10 January candle, the 11 January up candle and the low of the 12 January candle (0:08). Second, the midpoint of the 9 January wick, which he notes lines up almost exactly with the high of 10 January (0:35). Third, the 3982.50 level, which he derives in front of the viewer by anchoring a Fibonacci tool on the low of the 13 January daily candle and dragging it to that candle’s open (1:28 and 2:07). Fourth, 4030.75, which he describes as a closing price he had flagged in his weekend commentary, and which he says price could not get through on the Tuesday and Wednesday before this recording (13:25 and 13:29).
A fifth reference appears much later in the recording: 3961.75, which he identifies as an old daily low and points out again on a daily chart during the afternoon review (62:48 and 63:40). In the same section he warns against reading an old daily low as a short signal by itself, saying he still needs a pattern the algorithm will refer to, such as a fair value gap, an institutional order flow entry or a bearish breaker (63:46).
Why ICT Began the Emini Session Without Bias
He is explicit that the position he started the session from was a lack of conviction rather than a neutral forecast. In the replayed segment he says that before going to sleep he did not have a clean scenario for the morning (7:43), and in the live commentary he repeats that he was neutral because he needed more information (14:17). He describes the previous evening’s space as starting around 7:20 p.m. Eastern (23:10), and says he was waiting on overnight delivery, anything that happened at 8:30, and the 9:30 cash open before committing (23:20).
That distinction matters for reading the rest of the video. “Neutral” here is a decision to wait, not a prediction that price would stay flat, and he treats the session opens as the information that would resolve it. He names three opening prices he works with inside the 24-hour period: midnight New York local time, 8:30 and 9:30 (38:31, 39:02 and 39:05). His stated preference when bearish is to be selling from above the midnight opening price, because that is where he says size is being accumulated for the daily range (38:45).
ICT Emini Futures Scenario and Actual Session
The setup he describes wanting was a run above the prior Tuesday’s high, first to 4036 and potentially into 4040, which he says was already on his notes from the previous week. He says he wanted that move to fail (he uses the phrase “turtle soup” fake breakout for it) and then to sell the failure back toward 3982.50 (25:32, 25:39, 25:51 and 25:55). He frames that as the sequence that would have aligned him with a short immediately (24:48).
The run did not happen. He says price stayed in a range, that he had to wait for more information on the sell side because there was no spike above Tuesday’s high (40:12), and that the market instead drifted down into 3982.50 and 3973, which he identifies as a daily candle with wicks at both ends (40:29 and 40:31). Against that backdrop he says he did two trades where he was long, got a partial exit, and was taken out at break-even on the balance (26:02, 26:09 and 26:19). Those are his own account of the morning; the recording shows no order ticket, no statement and no verified fill.
His explanation for not taking the downside break earlier is the most transferable part of the review. Because the prior Tuesday’s high had not been taken, he says the swing low he would have used to call a bearish shift in market structure did not exist yet, so he accepted the first break below as insufficient (42:01 and 42:07). He describes the whole process as a chain of conditional decisions (if this occurs then that, and if not, then something else) and says algorithmic logic relies on that if/then structure and on binary decisions (42:18, 42:22 and 42:31).
ICT Emini Futures Delivery in the Afternoon Session
From the one-minute chart he walks through the same session again at finer resolution (45:35). He marks an order block (an up-close candle before a displacement coupled with a fair value gap) and treats its mean threshold as the reaction point (47:20 and 47:27). He then explains a term he uses as an annotation, “iofed”, standing for institutional order flow entry drill: what he calls a high-frequency entry technique in which price only has to touch the candle that created the imbalance (47:38, 47:42 and 47:55). That definition is his own; the recording offers no independent test of it.
In the afternoon section he highlights the late-day window, which the captions render as “132 415” (55:05), describes a rally into a fair value gap that sells off toward the old daily low at 3961.75 (65:34 and 65:45), and explains why he does not place exits exactly on the obvious level: the market does not sit at a price, and a one-minute candle can touch it for a second, so he takes partials a little before the level, anywhere from half a point to a full point off it (58:55, 58:58 and 59:01). He illustrates that with 3943.75 against 3944.25 (59:20 and 59:24).
ICT Three-Day Emini Futures Study
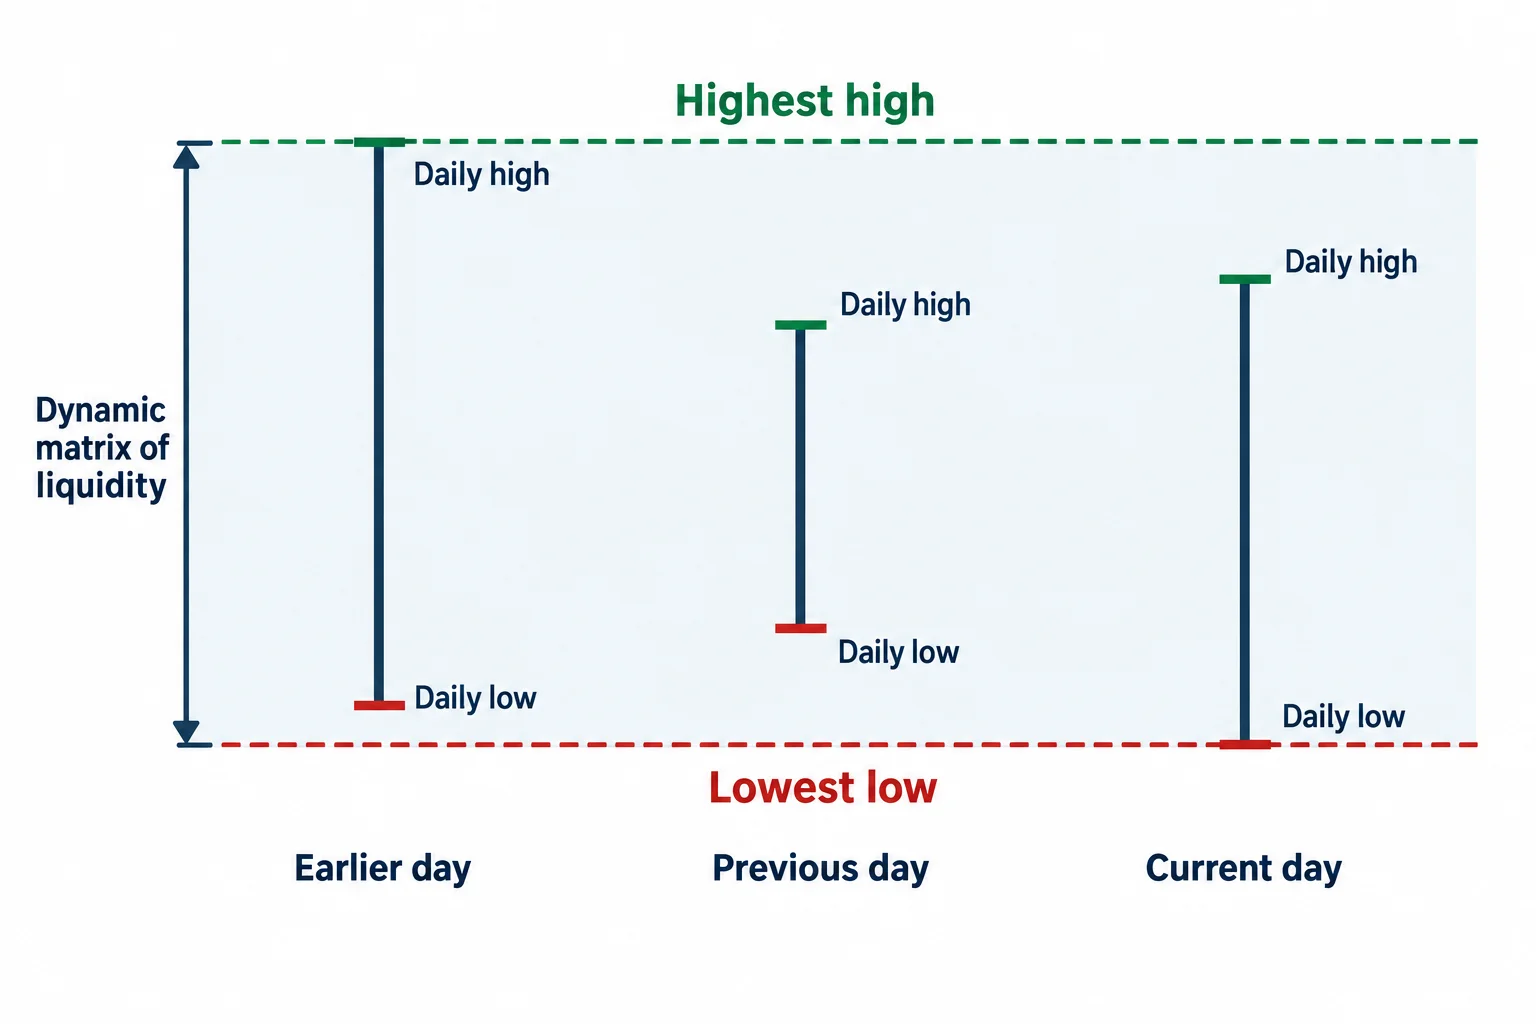
Near the end he gives a concrete chart exercise rather than another level. Count the current trading day as day one, the previous trading day as day two, and the day before that as day three (going back to the previous Friday when the calendar requires it), then mark the highest high and lowest low of that total range plus each individual daily high and daily low (65:57, 65:59, 66:08 and 66:55). He calls that set a dynamic matrix of liquidity around daily highs and lows (67:04 and 67:29).
He also uses the moment to describe what he treats as the signature of the setup he is teaching: in the final hour of the session, price runs above an opening price, returns to a fair value gap and sells off hard, with candle bodies respecting the gap edge and the reaction occurring at the midpoint (65:22, 68:15 and 68:17). That is his reading of the chart in front of him. He states the case in absolute terms and dismisses competing explanations, and nothing in the video tests the claim.
Limits of the ICT Emini Futures Review
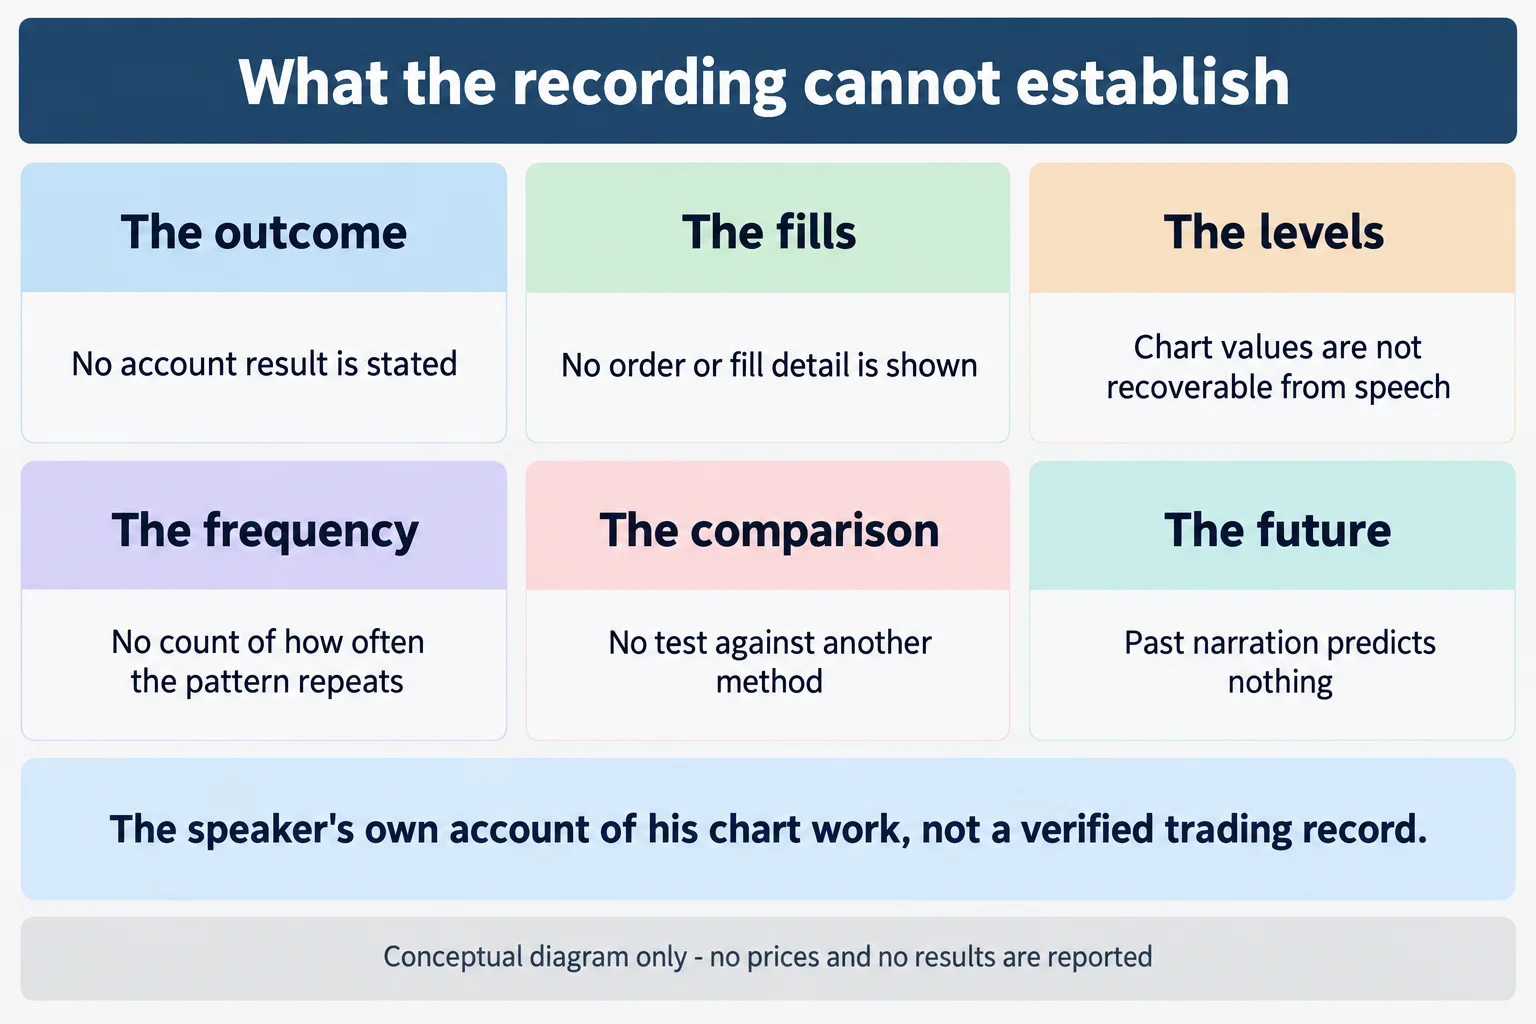
- No account result: the video contains no profit, loss, balance or statement, and the two long trades are reported only as a partial and a break-even exit (26:19).
- No verified levels: every price quoted here is spoken or typed on screen by the speaker, and the reviewer did not see the charts, so no level can be checked independently.
- No frequency data: the video does not say how often a run above the prior day’s high fails, how often price returns to an old daily low, or how often the pattern he calls a signature appears.
- No comparison: the recording does not test his framework against another method, and it does not show a losing sequence in the same detail as the ones he walks through.
- Unverified earnings arithmetic: he illustrates the point by saying five handles is $250 on one contract and $2,500 a day on ten (76:07 and 76:09). That is his own arithmetic, presented without a statement, and it is not a reported result.
A large share of the recording is also promotional rather than analytical. He repeats that only he has the algorithm he calls Enigma, asks viewers to comment if they listened to the prior evening’s space, and proposes a public challenge to call levels in advance (3:58, 7:02 and 73:16). Those are claims about his own product and his own record; this article reports them as claims and does not evaluate them.
Watch the ICT Emini Futures Review
ICT Emini Futures Review – January 18, 2023
The Inner Circle Trader · uploaded 18 January 2023 · about 81 minutes. This is the primary source for this article; every timestamp link above points into it.
The video is not embedded here because the owner has disabled playback on other websites. That was checked directly on 15 September 2026 from a BestProps page origin: the embedded player loads and returns “Playback on other websites has been disabled by the video owner” instead of playing, at both desktop and mobile viewport sizes, so no empty player is left on this page.
The watch page was read on 15 September 2026 and rendered as a public video: title “ICT Emini Futures Review – January 18, 2023”, listed at 80 minutes 58 seconds, with an upload timestamp of 18 January 2023 at 8:14 p.m. Pacific, 11:14 p.m. Eastern that same night, and 19 January in UTC, the date the scheduling inventory carries. In the recording the speaker gives his own local time as 8:50 p.m. Eastern on 18 January, so the review was recorded that evening and published a few hours later. The channel is The Inner Circle Trader on YouTube, the first-party record of what the publisher releases.
ICT Emini Futures Review Resources
These are the sources checked for this article. The publisher’s own channel and site are the first-party record of what ICT releases; the regulator page is general material about trading systems marketed to the public. None of them assesses the speaker, verifies a statement or a level in the recording, or tests the framework described. Any ICT, smart-money or third-party indicator, script, note set or re-upload circulating outside the publisher’s own pages, and any indicator built on these concepts, is unofficial and untested here.
- [1] ICT Emini Futures Review – January 18, 2023 (The Inner Circle Trader; primary source; watch page read 15 September 2026, 80m58s)
- [2] The Inner Circle Trader (official YouTube channel; read 15 September 2026)
- [3] The Inner Circle Trader (publisher’s own site and free library; read 15 September 2026)
- [4] CFTC (Fraud Advisory: Commodity Trading Systems Sold on the Internet; read 15 September 2026) Describes how hypothetical or simulated results are presented to the public.
This is independent educational commentary on one speaker’s own chart review. It is not official ICT material, it is not a tested trading system and it is not investment advice. The recording contains no profit or loss figure and none is reported here. Leveraged futures trading carries substantial risk.
