
Key takeaways
ICT’s Advanced Gap Theory classifies imbalances by context and subsequent fills rather than appearance.
Read the full summary
ICT’s Advanced Gap Theory classifies imbalances by context and subsequent fills rather than appearance. A common gap can be reclaimed repeatedly, a breakaway gap leaves an important higher-time-frame level and should remain partly unfilled, and a measuring gap marks roughly half of an implied dealing range and supports a projection. Using the June E-mini S&P morning runoff, ICT identifies a higher-time-frame weekly gap high, bearish structure breaks, and gaps that remain provisional until price behavior confirms them. A complete fill disconfirms either a breakaway or measuring gap. For the measuring-gap projection, he draws Fibonacci from the swing high to a gap boundary and combines the resulting negative-one standard-deviation level with old liquidity, reporting 4269.25 as the session low to the tick. He also describes a Silver Bullet short near 4298 with a 4278.75 objective worth roughly nineteen handles. The first 34 minutes review the Dollar Index, EUR/USD, and index futures while emphasizing neutral conditions, consolidation, and waiting for clearer one-way delivery. The practical routine is to mark the higher-time-frame level, identify the structure break and gap, delay classification, then journal whether price reclaims the gap or leaves part open. All levels and outcomes are ICT’s narrated chart readings from machine-generated captions and were not independently verified.
How we researched this article
BestProps used document-based research from primary firm sources, checked September 24, 2026. The complete source list, scope, limitations, and commercial-state record appear near the end of this article.
Roughly the first 34 minutes are market review and the last 13 are the lesson. What holds the session together is not a setup but a discipline: he keeps calling the current market neutral and refuses to force a direction out of a consolidation, then uses the gap hierarchy to explain why two gaps that look similar on a chart should not be traded the same way.
ICT Gap Theory and Market Neutrality
He opens the recording apologising for a cancelled live stream (his streaming software would not connect to his channel) and explaining that he waited for the close of the day and came back to record instead (0:26). Before any gap theory, he works through the weekly and daily Dollar Index, then EUR/USD and the June E-mini S&P contract.
The organising idea is his pair of terms for how price travels toward an objective. He says a high-resistance liquidity run can still deliver, but is met with a lot of resistance on the way, so it is likely to consolidate, move a little, retrace further than is comfortable, and consolidate again. A low-resistance run is closer to one-way delivery and gives near-immediate feedback. He is explicit that “resistance” here is not the retail chart concept: it does not mean support or resistance, it means the difficulty of getting one-way delivery (7:20 and 7:33).
His reason for standing aside is stated plainly: a lot of objectives have been met recently across the dollar, the euro and index futures, so the market has to be allowed to consolidate (11:07). He ties that to the four stages of price delivery he says he introduced in the first month of his core mentorship content (consolidation, expansion, retracement and reversal) and says the market is in the first of them (11:24). The instruction that follows is to wait: he says it is easy to predict where price will draw to when it is one-sided, and difficult to justify the opposite side when it is not, and that both directions can currently be argued.
He does not hide his personal lean. He says that if he were forced to commit he thinks the dollar goes higher (that he expects it to go lower first and higher later) while repeating that he is not reacting to price and is waiting for more information (28:20 and 28:33). He also names levels he is watching, including 104.54 as a weekly mean threshold and an area around 42.40 on the E-mini S&P (5:26 and 21:28). Those are his spoken chart readings, reported here as such.
ICT Gap Theory Lesson Setup
The lesson itself starts at 34:14, when he says he is going to teach advanced gap theory, and he takes as his example the first thirty minutes of that morning’s trading. Price runs higher from the 9:30 opening bell and stalls at the weekly gap high he says he flagged weeks earlier; the swing low then breaks, which leaves the small gap that becomes his first example (34:25 and 34:48).
Watch the original lesson on YouTube
The video cannot be played inside another website. The embedded player for this recording was loaded and clicked on 15 September 2026: it reported “Video unavailable” and “Playback on other websites has been disabled by the video owner”, with no duration and no playback progress, at both desktop and mobile widths. The recording’s own watch-page data agrees that embedding is unavailable, so no embed is placed here. The lesson is public and playable directly on YouTube.
Watch ICT Mentorship 2023 – Advanced Gap Theory Introduction on YouTube ↗
He reads the sequence through the model he taught in 2022: price takes buy-side liquidity into a higher-time-frame level, then shifts market structure lower, and the shift leaves a fair value gap that price can trade back up into. He is careful to separate the framework from supply-and-demand teaching, saying he cuts through candles to get to a narrative rather than reading the candles as institutional supply and demand (35:44 and 45:54).
ICT Gap Theory for Common Gaps
The first gap in his example, the small one left by the break of the swing low, he calls simply a common gap (34:51). The point of the label is that it carries no promise of immediate continuation. Later in the lesson he comes back to the same idea: common gaps can be traded back to more than once, and price reclaims them and sometimes treats the area as support or resistance (39:41 and 44:09).
He is careful with the consequence of that: a common gap is not a signal in itself. He says they can still be traded with the context he taught in the 2022 model, buy-side taken at a higher-time-frame level, the short-term low then traded through, the gap then traded back into (35:00). The hierarchy is what tells him which of several similar-looking imbalances deserves to be held.
ICT Gap Theory for Breakaway Gaps
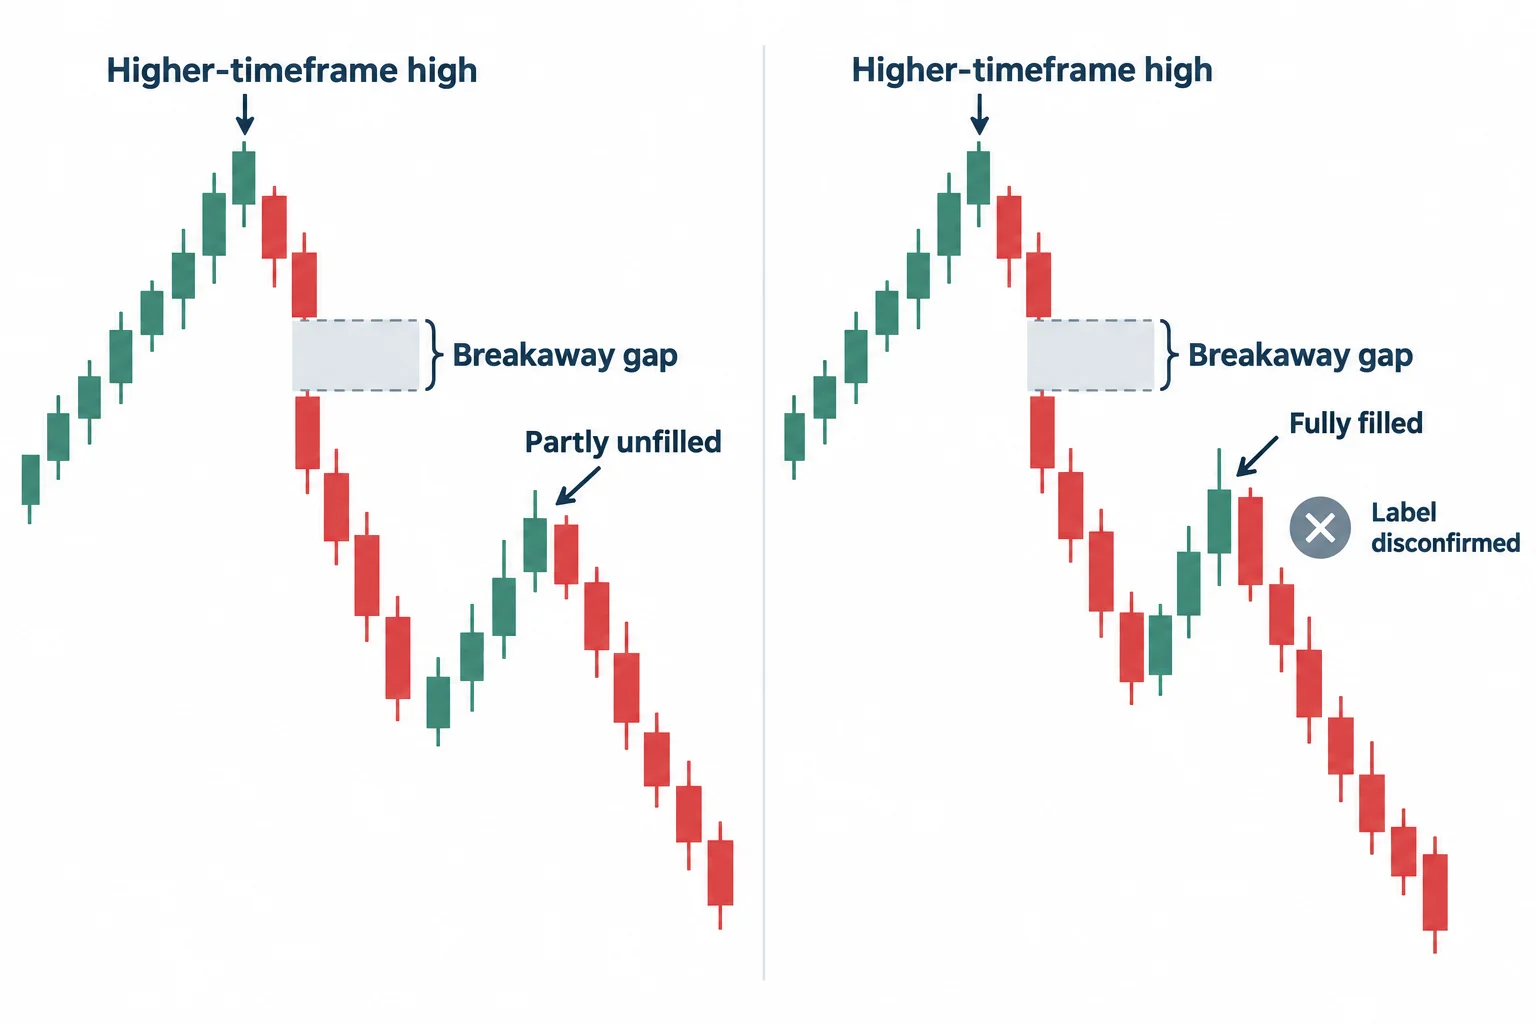
The second gap in the sequence he calls a breakaway gap, and he defines it by what it is breaking away from rather than by its shape: it is leaving an important higher-time-frame high, in this case the weekly gap high he had been tracking (35:29). He stresses that context is what qualifies it, and notes that by that point there had been two bearish shifts in market structure (35:53).
He then gives the expectation that distinguishes it: breakaway gaps tend to leave a portion of the gap unfilled (37:02). Crucially he treats the label as provisional rather than decided on sight. If price retraces and completely fills the gap, he says it is not a breakaway gap, and the plan becomes waiting for price to trade back to the higher-time-frame level, break lower again, create another gap and use that one instead (37:57 and 38:17).
His contextual argument is the part worth following closely. He says the run-up into that high looked like a bull flag to most retail traders and that trading above the prior high confirmed that read for them; without the weekly gap high already marked, he says, the failure that followed would not have been interpretable (38:40 and 38:53). This is the strongest statement of the lesson’s actual thesis: the gap label depends on a level established before the gap formed.
ICT Gap Theory for Measuring Gaps and Projections
The large imbalance formed by two down-closing one-minute candles is the one he calls a measuring gap (39:51 and 40:39). He defines it as approximately half of an implied dealing range (implied because the expectation is that price goes lower and it has not been there yet) and, like the breakaway gap, it is expected to leave a portion open. If price instead trades all the way back up through it, he says that disconfirms the label (42:35 and 44:25).
The projection follows from that label. He takes the high of the price swing and draws Fibonacci down to a boundary of the measuring gap, which gives a negative-one standard-deviation level. He adds a filter rather than treating the arithmetic as a target generator: the negative-one level has to agree with price moving below an area of old liquidity, and it is the combination that he says makes it precise (42:19, 43:05 and 44:39).
Two honest limits belong here. The Fibonacci settings themselves are not given in this recording; he points viewers to the preceding video in the same playlist for the settings and says he is reusing them (43:09). And the level he reports is a reading he takes off his own chart while recording: he says the negative-one standard deviation comes in at 4269.25 and that the day’s low arrived there to the tick and never traded lower, even after the session (43:25 and 43:37). That is his description of a chart he is annotating; it is not independent verification of a level or of any transaction.
Immediately before the gap lesson he also walks the morning Silver Bullet sequence and prices the move on the same session: a short taken around the 4298 level, with a negative-one standard-deviation objective he puts at 4278.75, which he counts as roughly nineteen handles (30:06, 33:05 and 33:58). He presents that as what the model offered on the chart, and he qualifies it himself: he says a viewer could have been overzealous and aimed at the weekly gap low, adding that he personally would not have (30:55). No account, contract count, risk figure or realised result is stated anywhere in this recording, and none is asserted in this article.
How to Practice ICT Gap Theory
The closing instruction is a study assignment rather than a signal. He asks viewers to go back through old price swings, break the gaps down using the hierarchy he has just given, and journal the results, describing this lesson as a benchmark for that work and saying deeper material in this area is still to come (46:41 and 47:03).
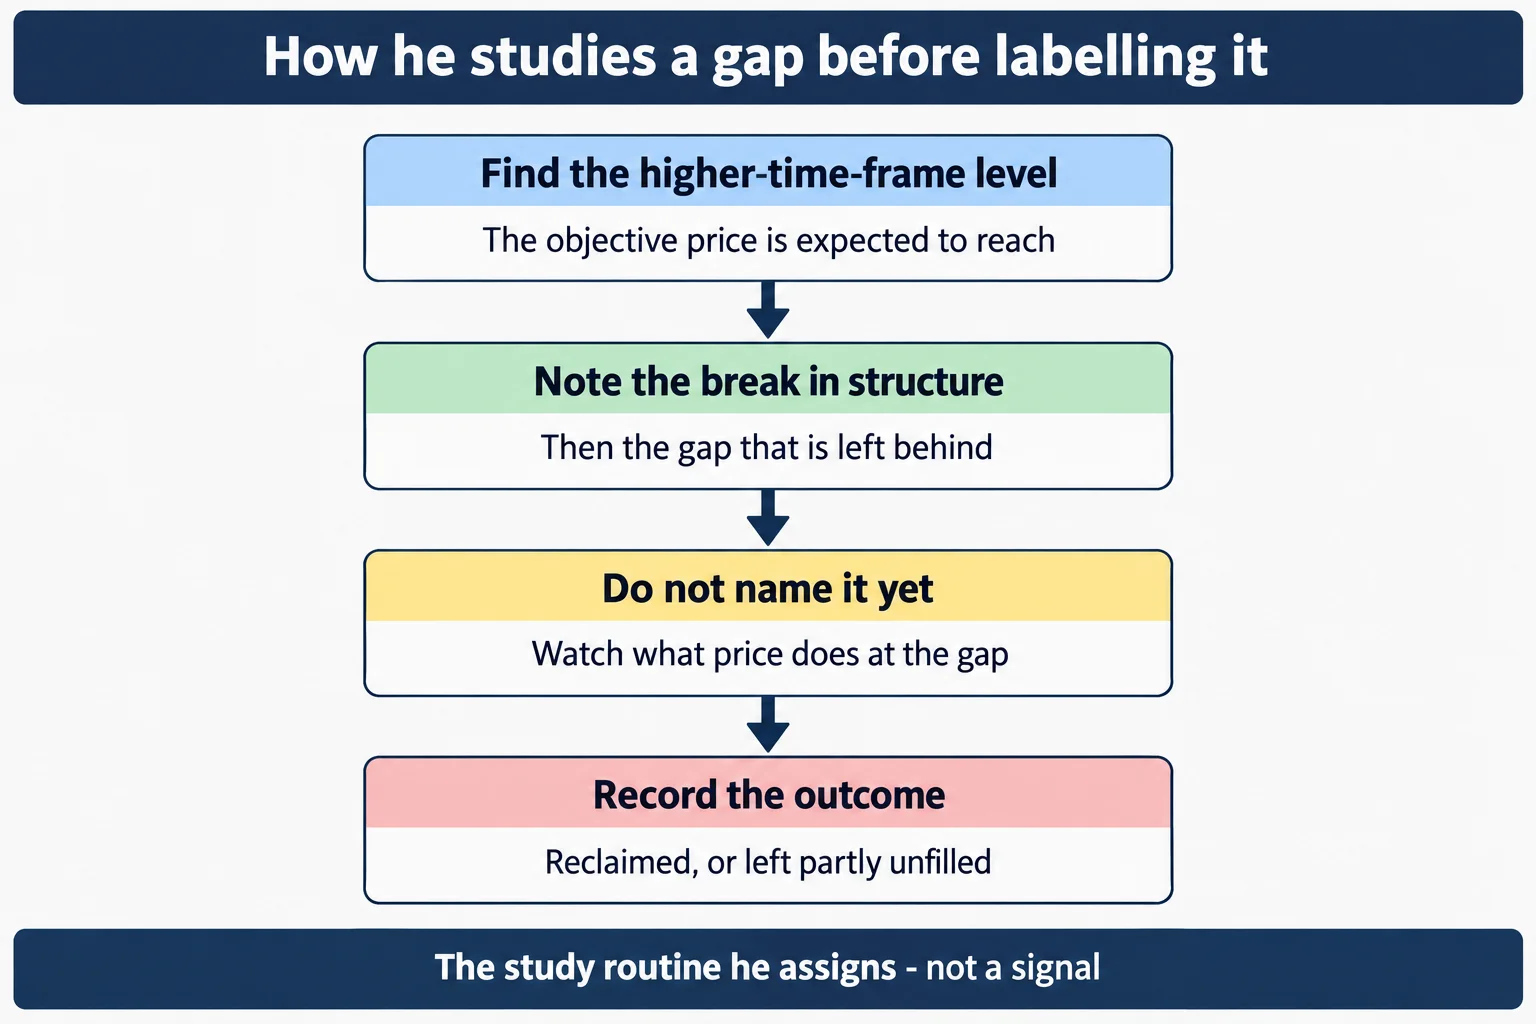
Read as a neutral study routine, the sequence he models is: establish the higher-time-frame level and the objective you expect price to reach; mark the break in structure and the gap it leaves; resist naming the gap at the moment you see it; then record whether price reclaims it or leaves part of it unfilled, and only afterwards compare that behaviour with the three definitions.
ICT Gap Theory Transcript Notes
This article was written from the recording’s own automatic English captions, which are machine-generated and not human-checked. They misrender several of his terms: “cell side” and “civi cells” for sell-side and sell-side imbalance, “bison efficiency” for buy-side imbalance, “volume and balance” for volume imbalance, “consequent encouragement” for consequent encroachment, and “Judah swing” for the morning false run he calls a Judas swing. Where the intended term is unambiguous from the surrounding sentences it has been normalised; the numbers he reads out are reported as the captions render them, which is why the two projection levels above appear in his spoken digit groups. The caption track establishes what he said. It cannot establish a chart level, a candle, a fill or a result, so every market description in this article is attributed to him rather than presented as verified fact, and the reviewer did not watch the video frames.
ICT Gap Theory Resources
These are the sources checked for this article. The regulator pages below are general investor-education and fraud-warning material about leveraged retail trading and about performance claims; they are not assessments of ICT, of this recording, or of anything said in it, and none of them verifies a statement made here. Any ICT, smart-money or third-party indicator, script, note set or transcript circulating outside the publisher’s own channel is unofficial and untested here.
- [1] ICT Mentorship 2023 – Advanced Gap Theory Introduction (The Inner Circle Trader) (primary source; watch page read 15 September 2026, 2,836 seconds, published 7 June 2023 at 7:21 p.m. Pacific)
- [2] The Inner Circle Trader (official YouTube channel) (read 15 September 2026)
- [3] YouTube Help (Embed videos & playlists) (read 15 September 2026; the platform documentation relevant to the disabled-embedding notice above)
- [4] CFTC Learn & Protect (Forex Frauds) (read 15 September 2026)
- [5] CFTC (Fraud Advisory: Commodity Trading Systems Sold on the Internet) (read 15 September 2026)
This is independent educational commentary on one speaker’s framework and on his own reading of his own charts. It is not official ICT material, it is not a tested trading system, it is not investment advice and it is not a claim that any result can be reproduced. Leveraged index futures and foreign-exchange trading involve substantial risk, most retail foreign-exchange traders lose money over time according to the regulator’s published data, and past or hypothetical performance does not indicate future results.
