
Key takeaways
The best indicators for prop firm challenges solve separate jobs: ATR for volatility and stop planning, session VWAP for futures price context, one SMA or EMA for trend, and RSI or another oscillator only when momentum is a distinct decision.
Read the full summary
The best indicators for prop firm challenges solve separate jobs: ATR for volatility and stop planning, session VWAP for futures price context, one SMA or EMA for trend, and RSI or another oscillator only when momentum is a distinct decision. None enforces account loss limits or guarantees a pass. TradingView ATR uses 14 bars and RMA by default, not a universal winning setting. Our 12 named $50K examples separate native charts, imported scripts, alerts and automatic orders. Topstep supports its standard native catalogue, not Pine imports; Apex permits read-only analysis and non-executing alerts; FundedNext is manual-only at $50K. An illustrative six-point futures stop costs $330 per ES or $34.50 per MES with assumed fees and slippage. At a $150 budget, skip ES or use at most four MES, subject to remaining room and account caps.

Quick indicator picks for prop firm challenges
- Stop planning
Start with ATR and a live loss-room calculation. Translate distance to dollars before choosing size. ATR measures price movement, not permission to risk that amount.
- Futures session context
Use session VWAP on the correct contract, exchange-volume feed and session. Add a fixed opening range only if session structure is part of the decision.
- Trend context
Use one SMA or EMA on the execution feed. A faster average reacts sooner but can also change direction repeatedly in a range.
- Momentum context
Choose RSI, MACD or Stochastic for a specific question. Adding all three is not three independent confirmations.
This is an indicator-selection guide, not a ranking of prop firms by price, review stars or alleged pass rate. Recommendations follow the decision a tool supports, its calculation, the data it needs and whether the named account route can use it. A native feature, a custom script, a notification and an automatic order are four different checks.
A minimal futures stack could be price, session VWAP and ATR, plus the account risk display. A minimal forex/CFD stack could be price, one moving average and ATR, adding an oscillator only if the trading plan has a separate momentum condition. These are starting combinations to evaluate, not measured winning systems. Remove any tool for which you cannot name the action that changes when its value changes.
For rule-to-tactic planning rather than choosing a chart tool, use our strategies for passing prop firm challenges. The entry signal comes after the account rule, not before it.
How we checked indicators for prop firm challenges
Technical explanations use official TradingView, MetaQuotes, NinjaTrader, cTrader and CME documentation. Firm examples use the exact named product and route, with current help and terms rather than a vendor feature list as permission evidence. Topic permissions, risk mechanics and indicator documentation were read on October 8, 2026. Retained facts keep their original dates, including Phidias review information from October 6 and some payout details from October 7. Videos retain their original upload dates and are described as background where they concern another product.
We did not buy an account, complete a checkout, log into a trading platform or measure indicator performance. Public cards and route instructions establish an advertised path, not US eligibility, a tested account, verified fills or a guaranteed permission for every script. The5ers exact selected $50K price and risk card could not be confirmed without substituting another size or older terms, so those figures remain Not published.
The same four capability checks apply to all 12 examples: built-in charts, imported scripts, discretionary alerts and order execution. A restriction fails only that mode; an automated-order ban does not prove a manual ATR overlay is banned. Examples are alphabetical within futures and forex/CFD groups, never ordered by a made-up indicator score. Source disagreements remain beside the affected product.
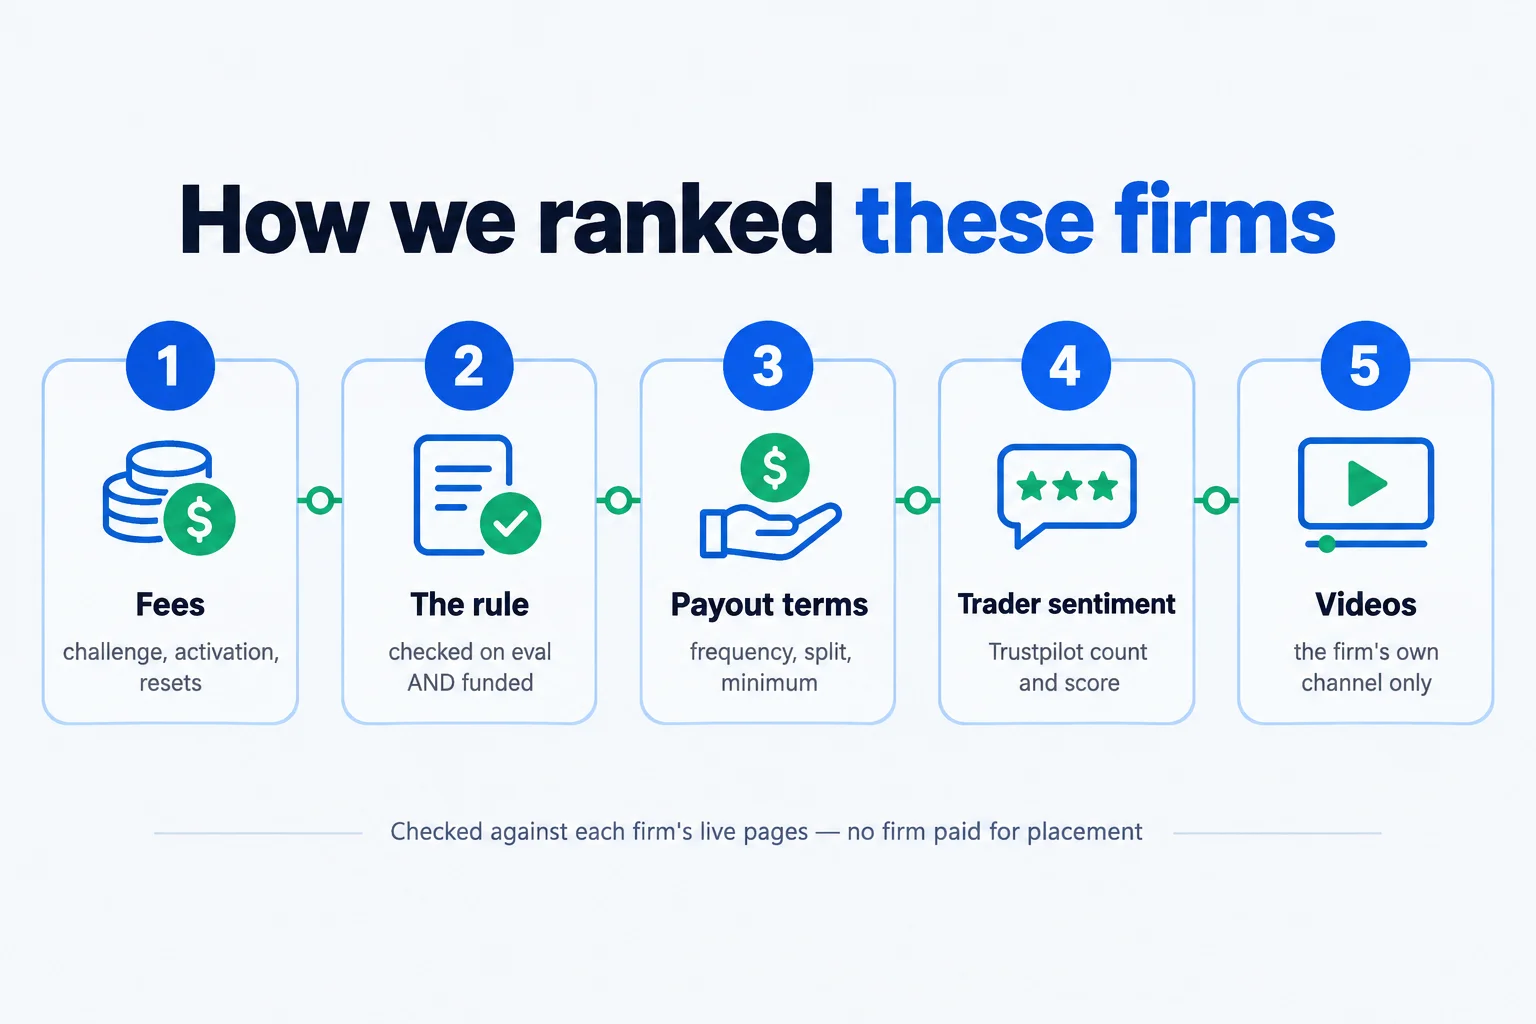
Prices are context. Fee-only figures use published list charges, not coupons. Where useful, the nominal baseline divides first-cycle known fees by the scheduled overall loss allowance and multiplies by $1,000. It is not a promise that the initial allowance survives a funded lock or payout. A strict through-first-payout comparison would instead require the smallest actual retained overall room along that path, plus all mandatory fees. If either is unknown or path-dependent, the result is unknown.
Indicator decision matrix for prop firm challenges
| Indicator | Decision | Input | Default to test | Main trap | Platform check | Rule check |
|---|---|---|---|---|---|---|
| ATR | Stop distance | High/low/close | TV 14 bars RMA | No direction | Exact smoothing | Dollar loss room |
| Session VWAP | Session context | Price and volume | TV hlc3; session | Wrong session | Volume and anchor | Flattening time |
| SMA or EMA | Trend context | Selected price | TV EMA 9; close | Lag and whipsaw | Period and feed | Position exposure |
| RSI | Momentum | Price changes | Vendor suggests 14 | Extreme can persist | Bar confirmation | No larger size |
| MACD | Trend momentum | Close prices | MT5 12/26/9 | Correlated with EMA | Signal smoothing | Costs still count |
| Stochastic | Range momentum | Close/high/low | Set all four inputs | Strong trend trap | K/D method | News restrictions |
| ADX | Trend strength | Directional moves | Vendor DI 14 | Not direction | ADX vs Wilder | No pass promise |
| Bollinger Bands | Price dispersion | Close prices | Vendor 20 SMA; 2 SD | Touch not reversal | Exact period/width | Stop in dollars |
| Standard Deviation | Dispersion | Applied price | Period not verified | Not drawdown | Applied price | No room estimate |
| Fibonacci | Pullback map | Two price anchors | Set before trade | Hindsight anchors | Drawing vs script | No rule override |
| Ichimoku | Trend and levels | High/low/close | Read actual inputs | Displaced plots | Align timestamps | No future signal |
A technical indicator transforms a price, volume or time series into a line, band or oscillator. A drawing tool such as Fibonacci also includes the trader’s chosen anchors. None is an independent observation of tomorrow’s price. Some tools update sooner than others, but being quicker does not establish accuracy, profitability or challenge suitability. The execution symbol, bar interval, smoothing and data source must be specified before comparing two readings.
ATR indicators and remaining challenge loss room
True range is the largest of the current high minus low, the distance from high to previous close, and the distance from low to previous close. ATR smooths that series. Including the previous close captures a price gap that an intrabar high-low range alone misses. TradingView documents a 14-bar length and RMA smoothing by default, with alternatives available. That does not establish the default for MT5 or another embedded implementation. TradingView documentation (read October 8, 2026).
ATR is a volatility measure, not a buy/sell direction, a drawdown alarm or a stop-execution guarantee. Absolute values also depend on the price scale and instrument: six points in one futures contract and six pips in EURUSD are not comparable dollar exposures. ATR can lag a news-driven change, and a current-bar value can expand before the bar closes. Decide which bar supplies the value before testing a multiple.
Use a stop distance as an input to sizing, not as justification for risking the entire advertised allowance. Calculate current equity less the enforced overall floor, then compare it with remaining daily room where a daily limit exists. Use the tighter room and reserve margin for costs and adverse fills. Account limits can be touched before a discretionary stop fills. A positive balance, a green dashboard and an ATR-based stop are not substitutes for that calculation.
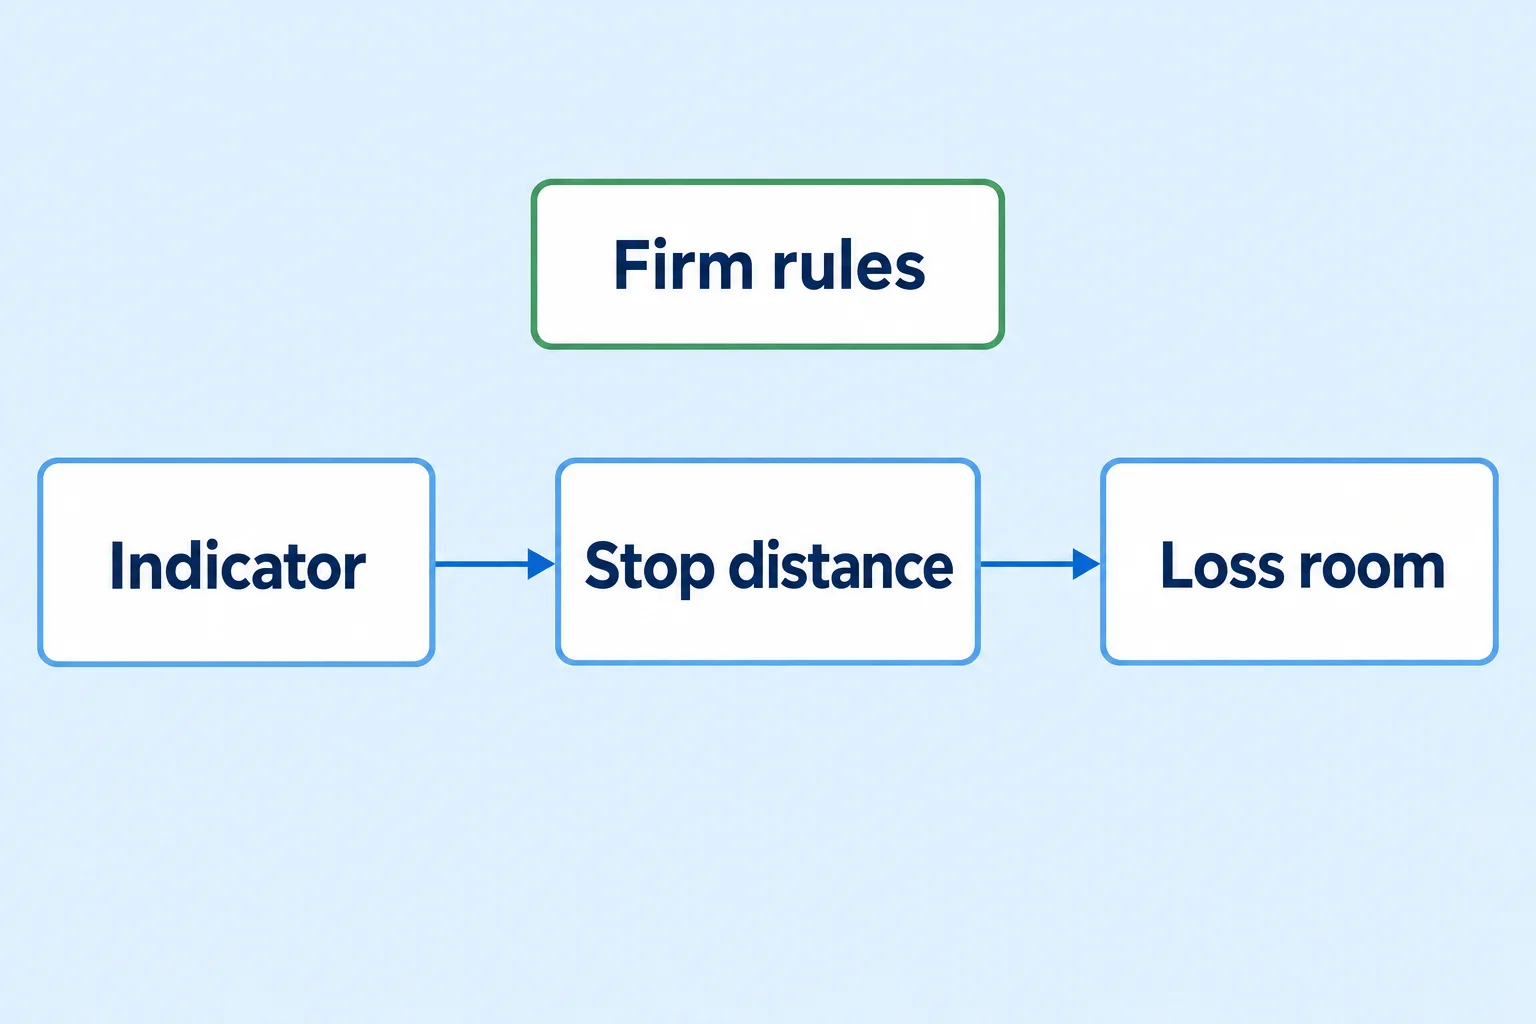
- Identify the exact product, stage, enforced floor and daily-loss reference.
- Choose an observed bar, stop-distance rule and maximum dollar budget before the trade.
- Convert the distance using the official instrument value and include assumed commissions and adverse slippage.
- Round size down to the actual permitted increment and apply combined account caps.
- Recalculate after open P&L, a reset, a floor lock or a payout request. Skip the trade when minimum size cannot fit.
For a live trade, exposure is stop distance times instrument value times size, plus relevant costs. Exposure as a percentage is that dollar amount divided by usable remaining room, multiplied by 100. This is an illustration of loss if the assumed stop and costs occur, not a prediction of maximum loss: gaps and execution failures can exceed the assumptions.
Futures indicator stop examples with ES and MES
The CME contract-value explanation establishes ES at $50 per point and MES at $5 per point. The Apex EOD Trail Standard $50K funded example begins within its current first-level combined ceiling of two minis or 20 micros. Do not treat each instrument ceiling as an independent allowance that can be stacked.
Assume ATR is four points and the chosen multiple is 1.5, creating a six-point stop. Neither ATR nor this setting was measured. Assume $1,000 remaining overall room, $1,000 remaining daily room and a $150 trade budget. Assume half a point of adverse slippage, plus $5 round-trip commission for ES or $2 for MES. These costs are chosen assumptions, not current quotes or reported fills.
| Instrument | Point value | Stop plus costs | Budget size | Total exposure | Room used |
|---|---|---|---|---|---|
| ES | $50 | $330 per contract | 0 contracts | Skip this trade | 1 ES would use 33% |
| MES | $5 | $34.50 per contract | 4 contracts | $138 | 13.8% of $1,000 |
One ES costs six points times $50, plus half a point times $50, plus $5 commission: $330, or 33% of assumed room. Flooring $150 divided by $330 gives zero. That means skip ES, not that ES has zero economic risk. One MES costs $30 plus $2.50 slippage plus $2 commission, or $34.50. Four cost $138, using 13.8% of the tighter $1,000 room and fitting the stated budget and current micro cap.
If remaining daily room later drops below overall room, repeat the calculation with that smaller amount. If the contract minimum no longer fits the budget, waiting or declining the setup is an outcome, not a sizing error. Check the live combined cap, current floor and session rules before applying the example to another account stage.
Forex indicator stop example for EURUSD
The FTMO EURUSD symbol specification gives 100,000 base units and USD profit currency. A 0.0001 pip therefore represents $10 per standard lot for EURUSD in this USD example. Other pairs require their own quote/account-currency conversion; a gold tick or an index CFD point is not a forex pip.
Assume ATR of 10 pips and a two-times-ATR stop, measured from executed entry to stop, for 20 pips. Assume $10 round-trip commission and one pip of adverse slippage per lot, $1,000 usable remaining room and a $250 budget. This gives $200 price risk plus $10 commission plus $10 slippage, or $220 per lot. It uses 22% of assumed room and allows one whole lot under the illustration’s rounding and the 100-lot symbol ceiling. Whole-lot rounding is for this explanation, not a claim about the platform’s minimum lot increment.
Spread is already reflected in executed entry when measuring entry-to-stop distance. If instead the starting measurement is a chart mid-price, explicitly include any extra spread distance. With an additional assumed one-pip spread in that sensitivity case, cost becomes $230, or 23% of room, and still one whole lot at the chosen budget. Do not double-count the spread or hide it entirely. Swaps, actual commission basis, lot increment, available margin and broker bid/ask must also be checked.
FTMO Standard 2-Step has a $5,000 static overall allowance but a separate $2,500 daily limit with midnight CE(S)T reset. Our $1,000 remaining room is an assumption after previous activity, not its initial allowance. The tighter current daily calculation can still bind, particularly when an open loss crosses midnight. No chosen multiple proves that a stop will fill before an account limit.
Indicator risk when unrealized profit changes a floor
The time a floor ratchets and the time a breach is enforced are separate. The selected futures examples above use end-of-day ratchets; they must not be relabelled as intraday-unrealized-peak trailing. Several still enforce the already-set floor against open equity during the session. An end-of-day label is not permission to let a position fall through that floor.
Consider a purely hypothetical account with $50,000 starting equity and a $2,000 trail. Price creates $51,000 peak equity intraday, then equity falls back to $50,000. An intraday-peak rule would raise the floor from $48,000 to $49,000 at the open-profit peak, leaving $1,000 room on the return. An end-of-day-only ratchet would keep the previously set $48,000 floor during that same session, leaving $2,000 at $50,000 until the specified closing calculation. This is a mechanics comparison, not a claim that any chosen EOD product uses the first method.
If the account instead ends the day at $51,000, an EOD $2,000 trail can raise tomorrow’s floor to $49,000, before any product-specific lock. Falling to the already-set floor intraday can still breach under an equity-enforcement rule. A chart that backtests only closed-bar losses can miss that path. Test the sequence of open P&L, commissions, floor updates and stop fills, not merely the final daily balance.
Payouts matter too. With a locked floor, a withdrawal lowers equity without lowering the floor. On E8’s explicit minimum-first-payout illustration, $500 profit leaves $250 retained above the newly lifted $50,000 floor; the other $250 at 80% pays $200 before external fees. The list $228 divided by the retained $250 times $1,000 is a fee-only $912 scenario. A different profit or request changes it. That is why a nominal initial allowance is not a universal through-payout denominator.
VWAP indicators for challenge sessions and volume
Session VWAP is accumulated price times volume divided by accumulated volume, restarting at the selected anchor. TradingView documents hlc3 as its usual source, the average of high, low and close, with zero offset and selectable anchor periods. That definition is platform-specific; an embedded route need not expose every setting. TradingView documentation (read October 8, 2026).
Before asking whether price is above VWAP, establish which session and feed created the line. Extended-hours and regular-hours charts accumulate different observations. An account’s daily-risk reset, an exchange session and a manually selected VWAP anchor are not necessarily the same moment. Daylight-saving transitions can shift local interpretations. A session VWAP on a chart with only one bar per session provides little intraday information; an unfinished current bar also changes its contribution.
Anchored VWAP begins from a user-selected point rather than an automatic session reset. TradingView documentation (read October 8, 2026) describes that distinction. Fix an event or anchor before observing the outcome. Moving the anchor after a bounce can create an attractive historical line without showing that it forecast the bounce. Save the selected time, source and session with the decision so a later chart can be reconstructed fairly.
For futures, reported volume represents contracts traded in the selected interval. TradingView documentation (read October 8, 2026) does not turn total contract volume into aggressor-side order flow or market depth. Contract rolls, continuous-series construction and time-of-day activity affect comparisons. A roll-adjusted continuous chart and the actual execution contract can differ; using matching symbols and sessions matters more than an apparently precise line. For depth and footprint seats, see prop firms for order flow traders.
Forex tick volume counts price changes or updates from the broker feed, not all contracts traded in a centralized forex exchange. MetaQuotes MetaTrader5 documentation documentation (read October 8, 2026) distinguishes tick and real volume. An index CFD is not the underlying CME futures contract. A volume-weighted line on a CFD feed is therefore a line weighted by that feed’s data, not automatically the exchange futures VWAP. Verify whether the symbol offers actual volume, tick volume or no usable volume at all.
VWAP is session price context, not a promise of mean reversion, a support level that must hold or a volume proof that smart money has entered. Band touches and late-session lag need the same testing and cost discipline as other indicators. Use it only if its answer changes a specified entry, exit or no-trade decision.
Moving average indicators for challenge trend context
An SMA gives equal weight to the selected prices over its period. An EMA gives greater weight to recent prices by combining current price with the preceding average. MetaQuotes documentation (read October 8, 2026) and MetaQuotes documentation (read October 8, 2026) explain the calculations. TradingView’s EMA documentation uses length nine, close and zero offset by default; TradingView documentation (read October 8, 2026). Do not call a chosen 20/50 pair a vendor default or an optimized challenge setting.
State whether length means bars on a five-minute chart, hours or daily bars. The same numeric period does not represent the same elapsed market time across those choices. The applied source also matters: close, typical price and another selection can produce different lines. A moving average from an external chart may disagree with the execution broker because its bars, feed or session differ, even when the calculation is correct.
Moving averages lag because they summarize observations already made. Faster weighting changes the trade-off, not the fact that the line is price-derived. A slope or crossover can be a trend condition if defined before testing, but a ranging market can repeatedly cross it. A closed-bar condition is not interchangeable with an alert that fires while the current bar is moving.
One trend filter may be enough. Adding another EMA, MACD and RSI can repeat information from the same closing-price sequence rather than provide independent evidence. Keep an extra tool only if it answers a different question, such as volatility or the exact session’s volume-weighted context, and test the combined rules instead of counting agreeing colors.
Momentum indicators for prop firm challenges
RSI indicators and persistent extremes
RSI uses average positive and negative price changes to produce an oscillator between zero and 100. The MetaQuotes explanation discusses Wilder’s recommended 14 periods along with other choices, not a tested best length for every instrument. MetaQuotes documentation (read October 8, 2026). An extreme value describes relative recent momentum; it does not compel price to reverse. A strong trend can keep the oscillator extreme while repeated countertrend entries consume the daily budget.
Specify the input period, bar-close policy and what an RSI observation changes in the plan. If it is only a filter on another price-derived filter, evaluate whether it meaningfully changes trade selection. Never enlarge position size simply because an oscillator looks more extreme; stop exposure still uses the instrument value and remaining account room.
MACD indicators and smoothing differences
MetaTrader documents MACD as the 12-period EMA minus the 26-period EMA, with a nine-period SMA of MACD as its signal calculation. MetaQuotes documentation (read October 8, 2026). Another vendor’s signal smoother may differ. A saved 12/26/9 label alone is not enough for like-for-like historical and live comparison. MACD can show trend/momentum change, but remains lagged and can whipsaw in a range.
Using EMA and MACD together can be coherent if their roles are distinct, but both are built from prices. Calling their agreement independent confirmation overstates the evidence. Log which line, crossover or completed-bar event triggers an action, and whether transaction costs erase any apparent benefit in an untouched test period. No such performance test was run for this guide.
Stochastic indicators in ranges and trends
Stochastic describes the close’s position within a rolling high-low range. Its %K calculation normalizes that location; %D smooths it. MetaQuotes documentation (read October 8, 2026) describes four separate inputs: K period, slowing, D period and D method. A fast-versus-slow comparison must hold those definitions constant; a generic label is not enough.
A range oscillator can stay extreme in a trend. Current high, low and close can change before the bar ends, so a live signal may disappear from the final-bar view without the author secretly rewriting history. Use a fixed observation time and test how the rule behaves during trends as well as ranges. RSI, Stochastic and MACD are alternatives for a chosen momentum task, not a mandatory three-tool bundle.
Optional volatility and structure indicators for challenges
ADX indicators measure strength rather than direction
ADX uses directional movement to describe trend strength; +DI and -DI provide different information about direction. MetaQuotes documentation (read October 8, 2026) describes 14-period directional lines, but the exact standard versus Wilder variant must be identified. A high ADX does not by itself say buy, and lag can keep the reading elevated after conditions change. Use it as a defined regime filter, not as an accuracy score or a reason to ignore a funded news rule.
Bollinger and Standard Deviation indicators
MetaQuotes describes Bollinger Bands as an SMA envelope expanded by standard deviation and recommends a 20-period SMA with bands two standard deviations away. MetaQuotes documentation (read October 8, 2026). That is a documented recommendation, not a measured winning configuration. A band touch is not proof of reversal, and a squeeze does not identify the direction of the next breakout.
Standard Deviation measures dispersion of applied prices around their moving average, taking the square root of the mean squared deviations. MetaQuotes / MT5 documentation (read October 8, 2026). It is not trend direction, account drawdown or exchange order flow. Period and applied price were not verified as a universal default. Because band width already contains a dispersion calculation, adding a separate Standard Deviation panel may duplicate the same information. Use it only for a separate, defined comparison.
Fibonacci indicators need fixed anchors
Fibonacci retracement is a drawing between two selected price extremes. Levels are proportions of the difference, and orientation and chosen anchors matter. MetaQuotes documentation (read October 8, 2026) lists configurable levels including 23.6%, 38.2%, 50% and 61.8%; the conventional 50% level is not itself evidence of a Fibonacci number or forecast. A touch of a level is not entry confirmation.
A manually fixed drawing need not repaint itself, but an automatic swing detector can revise or backfill the swing after later bars. Keep the exact original anchors and the time they became observable. Redrawing a perfect retracement after seeing the result is hindsight selection, not a tested leading indicator.
Ichimoku indicators and displaced plots
Ichimoku combines rolling high-low midpoint lines with a cloud drawn forward and a closing-price line drawn backward. MetaQuotes documentation (read October 8, 2026). A cloud ahead of the current bar is plot displacement, not future price data. Chikou displays a later closing price at an earlier chart location; reading that plot as if it was known on the earlier bar leaks information.
For testing, align each value with the source bar and the moment it became known, not just its plotted location. The vendor explanation did not establish universal numeric input defaults, so check the actual interface rather than claiming 9/26/52 was verified. Trend and support/resistance context can be useful; an attractive historical cloud still does not demonstrate profitable fills or challenge compliance.
Custom indicators alerts and bots in challenges
A built-in overlay performs the vendor’s supplied calculation. An imported script adds code and may request other data. A discretionary alert notifies a person. A webhook, EA, cBot or copier can place or modify an order. The last category requires execution permission even when its upstream signal comes from an otherwise allowed indicator. A risk manager that adjusts stops also acts on orders.
Pine is not MQL, and an embedded TradingView library is not a TradingView account with Pine Editor. Desktop MT5 custom files and mobile native-chart features should not be treated as interchangeable routes. External charting can be an analysis choice, but it cannot be used as a workaround for a firm’s order, copy or login restriction. Our TradingView prop-firm guide explains connection versus library access; the automated-trading prop-firm guide covers the separate execution decision.
Current Spotware / cTrader documentation (read October 8, 2026) describes C# or Python automated programs with desktop creation, backtesting and optimization. Spotware / cTrader documentation (read October 8, 2026) says current desktop indicators may use C# or Python and can trade directly when coded to do so, while web/mobile supports built-in customization. A file called indicator is therefore not proof it is read-only. The5ers FAQ’s C#/cAlgo description does not approve every vendor-supported Python or cloud route.
Ask